Investigation of Volatiles in Cork Samples Using Chromatographic Data and the Superposing Significant Interaction Rules (SSIR) Chemometric Tool - MDPI
←
→
Page content transcription
If your browser does not render page correctly, please read the page content below
biomolecules

Article
Investigation of Volatiles in Cork Samples Using
Chromatographic Data and the Superposing
Significant Interaction Rules (SSIR)
Chemometric Tool
Emili Besalú 1, * , Chantal Prat 2 and Enriqueta Anticó 3, *
 1   Institute of Computational Chemistry and Catalysis, University of Girona, 17003 Girona, Spain
 2   Francisco Oller S.A., 17244 Cassà de la Selva, Spain; cprat@ollerfco.com
 3   Department of Chemistry, University of Girona, 17003 Girona, Spain
 *   Correspondence: emili.besalu@udg.edu (E.B.); enriqueta.antico@udg.edu (E.A.);
     Tel.: +34-972-41-8875 (E.B.); +34-972-41-8276 (E.A.)

 Received: 14 April 2020; Accepted: 9 June 2020; Published: 11 June 2020

 Abstract: This study describes a new chemometric tool for the identification of relevant volatile
 compounds in cork by untargeted headspace solid phase microextraction and gas chromatography
 mass spectrometry (HS-SPME/GC-MS) analysis. The production process in cork industries commonly
 includes a washing procedure based on water and temperature cycles in order to reduce off-flavors and
 decrease the amount of trichloroanisole (TCA) in cork samples. The treatment has been demonstrated
 to be effective for the designed purpose, but chemical changes in the volatile fraction of the cork
 sample are produced, which need to be further investigated through the chemometric examination
 of data obtained from the headspace. Ordinary principal component analysis (PCA) based on the
 numerical description provided by the chromatographic area of several target compounds was
 inconclusive. This led us to consider a new tool, which is presented here for the first time for an
 application in the chromatographic field. The superposing significant interaction rules (SSIR) method
 is a variable selector which directly analyses the raw internal data coming from the spectrophotometer
 software and, combined with PCA and discriminant analysis, has been able to separate a group of
 56 cork samples into two groups: treated and non-treated. This procedure revealed the presence of
 two compounds, furfural and 5-methylfurfural, which are increased in the case of treated samples.
 These compounds explain the sweet notes found in the sensory evaluation of the treated corks.
 The model that is obtained is robust; the overall sensitivity and specificity are 96% and 100%,
 respectively. Furthermore, a leave-one-out cross-validation calculation revealed that all of the samples
 can be correctly classified one at a time if three or more PCA descriptors are considered.

 Keywords: cork; volatiles; GC-MS; SPME; superposing significant interaction rules

1. Introduction
     The unique properties of cork, including long-lasting flexibility, hydrophobicity and gas
permeability, make it still today the first choice for wine producers as a closure for bottled wine [1,2].
The complex chemical composition of cork, together with its importance in the wine industry,
has resulted in the investigation of extractable compounds that can be released from the cork into the
solution having become a subject of great interest [3–5]. Within the extractable components, volatiles
including terpenes, alcohols, aldehydes and pyrazines, among others, deserve special attention [6–10].
The origin of these compounds is diverse, although they are normally ascribed to the transformation
of lignin components, fatty acid oxidation or microbial degradation of fatty acids and aliphatic

Biomolecules 2020, 10, 896; doi:10.3390/biom10060896                        www.mdpi.com/journal/biomolecules
Biomolecules 2020, 10, 896 2 of 13
aldehydes [11,12]. The composition of the volatile fraction, also referred to as the volatile signature, is
an informative diagnostic tool for cork quality and sensory qualification. Analytical methods for the
study of volatiles rely on gas chromatography with mass spectrometry detection (GC-MS). GC-MS data
is combined with sensory evaluation and, in some cases, with olfactometric (GC-O) analysis [9,13,14].
The isolation of the compounds can be performed directly from the cork samples or from the aqueous
macerates [10,15,16]. In the latter case, the procedure employed consists in the simulation of the
interaction of stoppers with wine under specific maceration conditions and using water or ethanol:water
mixtures as matrices [17]. For the preconcentration of volatile molecules, the most commonly used
techniques are static headspace (SHS), multiple HS, dynamic HS, headspace sorptive extraction (HSSE),
solid phase extraction (SPE) and solid phase microextraction (SPME) [9–11,18,19]. The ideal method
should have a high capacity and high extraction efficiency, no saturation, moderate selectivity, be easy
to automate and not be time-consuming. SPME has been extensively employed in the field of aroma
analysis because of its advantages: easy automation, high preconcentration factor, and the possibility
of selecting the most appropriate coating for the intended application [20].
In general, the chemical composition of the volatile signature is rather complex. A few volatiles in
cork present specific odor descriptors and low odor thresholds. The compound 2,4,6-tricholoranisole
(TCA) is undoubtedly the one that has been more extensively studied [18,21], for two main reasons:
firstly, it is responsible for the musty, or moldy, aroma, a negative sensory attribute that can be transferred to
the wine; and secondly, TCA bears an extremely low sensory threshold, at around 1 ng L−1 in water [21].
Other compounds, for example 2,4,6-tribromoanisole, 1-octen-3-one, geosmin, methylisoborneol,
2,3-dimethyl-5-methoxypyrazine and guaiacol, have also been described as contributing to the
musty/moldy aroma in corks, but they are rarely found in cork macerates, with the exception of
guaiacol [10,22]. Although some of these compounds are endogenous to cork, contamination from
external sources has been described, especially in the case of chlorophenols, which were extensively
used as pesticides. The transformation of chlorophenols into chloroanisoles as a detoxification
mechanism has been demonstrated [23].
The presence of TCA in cork stoppers constitutes one of the most important problems that the
cork industry faces, since it causes significant economic losses and can damage the reputation of a
cellar. Cork industries are continuously improving their production processes by applying different
treatments to cork material to remove odorous compounds, seeking the inertness required in the
fabrication of wine closures and, very particularly, the elimination of TCA. Some examples are the
ROSA technology developed by the AMORIM cork company, which is based on the use of a distillation
process with water steam [24,25], different improved washing procedures, extraction using supercritical
carbon dioxide, and the application of different types of radiation or electron beam irradiation [26].
Recio et al. [27] have used hydrogen peroxide as an oxidant catalyzed by molybdate ions in alkaline
conditions for the efficient destruction of TCA and pentachloroanisole. Vlachos et al. [28] recommend
ozone and/or sterilizing gases, such as steam, via the sequential application of pulsed vacuum-pressure
cycles. The most common industrial treatments include temperature and humidity cycles, although
the precise characteristics and experimental conditions are not in the public domain. The positive effect
of such treatments is a reduction in the TCA levels in cork, which are usually verified at the quality
control laboratories of the cork producer. However, other unquantified changes in the cork material
may also be expected, such as the modification of the naturally present diversity of microorganisms,
changes in the humidity and other physical properties of the material, and the modification of the
volatile signature of corks, as determined by sensory analysis.
A systematic strategy for the untargeted investigation of the volatile signature of cork can be
applied based on the multivariate analysis of either chromatographic data or data from sensor arrays
(an electronic nose) [29]. Boudaoud et al. [30] have studied the volatile signature of cork based on
chemometric methods and dynamic headspace (DHS) coupled to mass spectrometry with and without
chromatographic separation. Here, we present for the first time the superposing significant interaction
rules (SSIR) technique [31] for this purpose. SSIR is a combinatorial procedure which deals with in situBiomolecules 2020, 10, 896 3 of 13
generated rules consisting of the combination of chromatographic variables (pairs of fragment mass
and retention time ranges) that probabilistically correlate with a binary classification of the samples.
The counting of the variables involved in the most significant rules allows for the identification of
relevant fragment masses and times which are presumably responsible for the classification of the
samples. From the probabilistic point of view, it is expected that these identified masses are related to
the eliminated or newly originated molecules.
The main goal of this study, therefore, is to investigate the possibility of using SSIR together with
HS-SPME/GC-MS data for the untargeted analysis of cork volatile signatures, with a special focus on
the changes produced when cork samples are submitted to a washing cycle. More specifically, we
make an attempt to understand the chemical effect produced by washing cycles on cork barks.
2. Materials and Methods
2.1. Reagents and Solutions
The pure standards of compounds listed in Table 1 were all purchased from Sigma. Deuterium-labelled
2,4,6-trichloroanisole (d5-TCA) was used as the internal standard (IS). These compounds were employed
to confirm the identification of the peaks observed in the chromatograms.
Table 1. Compounds used for target analysis of cork volatiles: retention time, m/z fragments used for
the identification and concentration of the compounds in the working solution prepared to confirm
the identification.
Concentration
Compound Retention Time (min) m/z 1
(µg L−1 )
1,8-cineol (eucalyptol) 12.33 81,108,139,154 3.95
MDMP 2 12.66 137 0.46
IPMP 2 13.55 137 0.38
Guaiacol 13.51 81,109,124 19.58
(±)-linalool 13.88 71,93,121 3.33
(+)-fenchol 14.33 81 5.26
1,2-dimethoxy benzene (veratrol) 14.84 95,123,138 15.62
Camphor 15.00 95 3.66
Sec-IBMP 2 15.42 124,138 0.68
(-)-borneol 15.6 95 4.25
IBMP 2 15.65 124 21.12
Menthol 15.71 95 3.82
Methylisoborneol 16.02 95,108 0.57
α-terpineol 16.13 93,121,136 5.54
Benzothiazole 16.86 108,135 21.89
TCA 19.30 210,212 0.01
d5-TCA 19.22 215,217 0.06
Geosmin 21.50 112,125 0.6
1 m/z in bold are used for quantification. 2 MDMP: 2,3-dimethyl 5-methoxy-pyrazine; IPMP: isopropyl methoxy
pyrazine; IBMP: isobutyl methoxy pyrazine.
Individual stock solutions of about 500–3000 mg L−1 were prepared by weight in methanol and
stored at 4 ◦ C. Mixed working solutions were made by diluting the required volumes of the intermediate
solutions (prepared from stock solutions, also in methanol) with ultrapure water. In Table 1, the selected
concentrations for the working solutions are shown.
Sodium chloride (99.9%) and HPLC-gradient grade methanol were supplied by Carlo-Erba
Reagents. Ultrapure water from a Milli-Q Plus water purification system (Millipore Ibérica) was used.Biomolecules 2020, 10, 896 4 of 13
2.2. Headspace Solid-Phase Microextraction Procedure
HS-SPME experiments were manually performed using a 50/30 µm divinylbenzene/Carboxen/
polydimethylsiloxane (DVB/CAR/PDMS) fiber from Supelco. Before use, the fiber was conditioned
according to the manufacturer’s instructions to remove contaminants and stabilize the solid phase.
Five mL of the sample solution were placed in 15 mL amber glass vials containing 1.2 g of NaCl.
Next, 100 µL of the IS solution in methanol (3.2 µgL−1 ) was added. Finally, the vials were closed and
introduced to the water bath. The fiber was exposed at 50 ◦ C for 30 min to the headspace above the
aqueous solution. Constant stirring was applied during the extraction process. After the completion of
the sampling, the fiber was pulled into the needle and the SPME device was removed from the vial
and inserted into the injection port of the GC for thermal desorption and analysis.
2.3. Equipment and Chromatographic Conditions
Gas chromatographic analyses were performed with a Trace GC 2000 coupled to a PolarisQ ion
trap mass spectrometer detector (Thermo Scientific, Waltham, MA, USA). A TG-5SIL MS capillary
column (30 m × 0.25 mm i.d.; 0.25 µm film thickness) (Thermo Scientific) was used, and the carrier
gas was 99.9990% pure helium (Abelló) at a constant inlet flow rate of 1 mL min−1 . The split/splitless
injection port was operated in splitless mode (maintained for 5 min) at 250 ◦ C.
The oven temperature program started at 40 ◦ C, held for 5 min, increased up to 100 ◦ C at 8 ◦ C/min,
increased up to 170 at 5 ◦ C/min, finally increased up to 270 at 15 ◦ C/min and held for 2 min; the total run
time was 35.0 min. The transfer line temperature was set at 270 ◦ C, and the ion source temperature was
set at 225 ◦ C. MS analyses were conducted in scan mode with two m/z intervals: from 40 to 250 amu
(from min 3 to 19 min) and from 100 to 350 amu (from 19 min to the end of the chromatographic run).
Ionization was performed in the electron impact mode at 70 eV. The acquisition of chromatographic
data was performed using Xcalibur 1.4 software (Thermo Scientific). Table 1 shows the list of the target
compounds, their retention times and their qualifier ions.
2.4. Cork Samples and Preparation of Cork Macerates
The 56 samples consisted of cork discs obtained before (28 samples) and after (28 samples) the
temperature and humidity cycles addressed to eliminate TCA (see supplementary Table S1). According
to the information provided by the cork stopper producer, the TCA level was reduced toBiomolecules 2020, 10, x FOR PEER REVIEW 5 of 13
Biomolecules 2020, 10, 896 5 of 13
of the HIV-1 reverse transcriptase [33] and a family of substituted peptides [34]. The procedure is
related to the design of experiments field, and has been applied to obtain fast qualitative preliminary
the modelling of binding affinities [31], and the classification of former inhibitors of the HIV-1 reverse
results before the development of a full design [35]. This method is presented here for a
transcriptase [33] and a family of substituted peptides [34]. The procedure is related to the design
chromatographic application for the first time.
of experiments field, and has been applied to obtain fast qualitative preliminary results before the
development of a full design [35]. This method is presented here for a chromatographic application for
3. Results and Discussion
the first time.
3.1.Results
3. Targeted Analysis
and and First Attempt to Evaluate the Impact of Cork Treatment Using Principal
Discussion
Component Analysis
3.1. Targeted Analysis and First Attempt to Evaluate the Impact of Cork Treatment Using Principal
As already mentioned in Section 2.4, the aqueous cork macerates were analyzed by a sensory
Component Analysis
panel, and the main conclusion was an increase in biscuit and sweet aromatic notes in the treated
As already mentioned in Section 2.4, the aqueous cork macerates were analyzed by a sensory panel,
samples.
and the main
A list conclusion was
of compounds an increase
contributing in biscuit
to the volatileand sweet aromatic
signature of cork wasnotes in the treated
established fromsamples.
a survey
A list
of data of compounds
from the literature contributing
(Table 1), to
andtheavolatile
solution signature
containingof cork wascompounds
all the established from
and athesurvey of
IS was
data from the
extracted andliterature
analyzed(Table
by the 1),proposed
and a solution
methodcontaining
(Sectionall2.2).
the Retention
compounds and the
times wereIS was extracted
collected and
and
usedanalyzed by the proposed
for the identification of themethod (Section
compounds in 2.2). Retention times were collected and used for the
the samples.
identification
Some of the of the compounds
target compounds in the
weresamples.
identified in the set of studied samples both before and after
Some of cycle.
the washing the target compounds
It was expectedwere identified
that the washing in the setwould
cycle of studied samplestoboth
contribute the before and after
elimination not
the washing cycle. It was expected that the washing cycle would contribute to
only of TCA but also of other volatiles present in the cork disc. An inspection of the area ratios (see the elimination not
only of TCA butTable
supplementary also ofS1)other volatiles
has shown present
that in the cork
the maximum disc.was
signal Anreduced
inspection
for of
somethe of
areatheratios (see
volatiles,
supplementary Table S1) has shown that the maximum signal was reduced
including TCA, but no clear trend in the decrease in the values for washed cork samples was for some of the volatiles,
including
observed. TCA, but no clear trend in the decrease in the values for washed cork samples was observed.
Further analysis was performed using PCA, giving a plot as shown in Figure 1. No useful
information couldcouldbe beextracted.
extracted.ForFor instance,
instance, in Figure
in Figure 1 the1 first
the two
first components
two components only collect
only collect 32.4%
32.4% and of
and 19.8% 19.8% of the
the total total variance,
variance, respectively.
respectively. The firstThe first principal
principal component component shows maximum
shows maximum squared
squared
loadings loadings
(ranging(ranging
from 0.16 fromup0.16 up tofor
to 0.29) 0.29) forcompounds
four four compounds (eucalyptol,
(eucalyptol, fenchol,
fenchol, camphor
camphor and
and αterpineol), whereas the second component is mainly defined
αterpineol), whereas the second component is mainly defined by guaiacol and borneol by guaiacol and borneol (squared
loadings of 0.44 and 0.37, respectively). The contributioncontribution of of TCA
TCA in in both
both components
components is is almost
almost zero.
zero.
Similar results to those shown in Figure 1 did not help to identify a compound or set of compounds
that were
were responsible
responsiblefor forthethedifferences
differences found
found in the
in the olfactory
olfactory evaluation
evaluation between
between treatedtreated and
and non-
non-treated samples.
treated samples.
Figure 1. Typical results obtained during the first study by means of PCA. No clear separation of
samples (non-treated 0 and treated
treated 1)
1) was
was obtained.
obtained.
It
It was
was not
not possible
possible to
to evaluate
evaluate the
the influence
influence ofof the
the treatment
treatment and
and to
to explain
explain the
the differences
differences
observed
observed in the sensory analysis from this first attempt. The need is therefore seen for aa different,
in the sensory analysis from this first attempt. The need is therefore seen for different,Biomolecules 2020, 10, 896 6 of 13
Biomolecules 2020, 10, x FOR PEER REVIEW 6 of 13
objective approach to the evaluation the effect of the treatment and for the identification of a set of
objective approach to the evaluation the effect of the treatment and for the identification of a set of
compounds that can explain the olfactory characteristics described by the panel.
compounds that can explain the olfactory characteristics described by the panel.
3.2. Data
3.2. Data Processing Results Obtained
Processing Results Obtained with
with SSIR
SSIR
The set
The set of
of 56
56 samples
samples waswas dichotomized
dichotomized into into two
two classes:
classes: treated
treated and
and non-treated.
non-treated. The
The bulk
bulk
chromatographic raw
chromatographic rawdata
datafile
filewas
wasobtained
obtainedusing
usingthethe
filefile
converter
converter tooltool
of the Xcalibur
of the software.
Xcalibur For
software.
each sample, all the time and mass registers were reorganized in a rectangular
For each sample, all the time and mass registers were reorganized in a rectangular grid of time and grid of time and mass
combination
mass (see the
combination (seeintensities represented
the intensities in the
represented schematic
in the schematic bubble
bubble chart
chartofofFigure
Figure2a).
2a). A first
A first
calculation using
calculation usingthethewhole
wholedatadataininthe
thetime
timedomain
domain between
between 3 and
3 and 19 19
min min
andand mass
mass fragments
fragments 40–
40–350
350 was used to confirm that no variable was selected before 6 min, and that the
was used to confirm that no variable was selected before 6 min, and that the ions of mass 210 and 212ions of mass 210 and
212 attached
attached to TCA
to TCA (see (see
TableTable 1) not
1) did didappear
not appear at a time
at a time greatergreater
than than 18 min.
18 min.
Figure 2. Schematic representation for a sample of the variables and levels grid definition needed to
Figure 2. Schematic representation for a sample of the variables and levels grid definition needed to
apply the superposing significant interaction rules (SSIR) method: (a) a bubble graph representation of
apply the superposing significant interaction rules (SSIR) method: (a) a bubble graph representation
the original peak signals; (b) after gridding, each node is ultimately assigned to a binary label: low level
of the original peak signals; (b) after gridding, each node is ultimately assigned to a binary label: low
(grey) or high level (black); (c) representation of the discretized grid variables and the respective low
level (grey) or high level (black); (c) representation of the discretized grid variables and the respective
and high level series for three samples. Each sample bears its own distribution of labels (codification)
low and high level series for three samples. Each sample bears its own distribution of labels
along the grid. See text for more details.
(codification) along the grid. See text for more details.
Hence, in order to reduce the search space and exclude d5-TCA, which was used as an internal
Hence, in order to reduce the search space and exclude d5-TCA, which was used as an internal
standard, the time range was set from 6 to 17 min. The corresponding time partitions were 20 s (1/3 min)
standard, the time range was set from 6 to 17 min. The corresponding time partitions were 20 s (1/3
wide, resulting in 33 intervals. In turn, the range for the permitted m/z variable values was set from 49
min) wide, resulting in 33 intervals. In turn, the range for the permitted m/z variable values was set
to 170.5 amu. In the case of the mass interval, this was partitioned into 243 intervals (i.e., in steps of
from 49 to 170.5 amu. In the case of the mass interval, this was partitioned into 243 intervals (i.e., in
0.5 amu), centered at half integer and integer mass values. Therefore, the original rectangular grid
steps of 0.5 amu), centered at half integer and integer mass values. Therefore, the original rectangular
was made up of 33 × 243 = 8019 nodes for each sample, with each node being the combination of two
grid was made up of 33 × 243 = 8019 nodes for each sample, with each node being the combination of
intervals (time and ion mass). A symbolic representation (in a simple schematic 10 × 10 grid) of the
two intervals (time and ion mass). A symbolic representation (in a simple schematic 10 × 10 grid) of
time and mass variable combinations is shown in Figure 2b.
the time and mass variable combinations is shown in Figure 2b.
All the intensity registers were normalized by re-scaling and setting the mean of intensities to
All the intensity registers were normalized by re-scaling and setting the mean of intensities to
an arbitrary value of 1000 units per sample. All these intensity values were then added into the
an arbitrary value of 1000 units per sample. All these intensity values were then added into the
corresponding nodes of Figure 2b, according to the defined time and mass intervals. Therefore,
corresponding nodes of Figure 2b, according to the defined time and mass intervals. Therefore, the
the available data descriptors per sample are a two-dimensional grid collecting a sum of intensities in
available data descriptors per sample are a two-dimensional grid collecting a sum of intensities in
each node.
each node.
The SSIR method deals only with categorical variables. For the sake of simplicity, only binary
The SSIR method deals only with categorical variables. For the sake of simplicity, only binary
variables have been considered here, as it was decided to dichotomize the values of the collected
variables have been considered here, as it was decided to dichotomize the values of the collected
intensities in each node. The top 1% percentile values constituted the high level (black squares in
intensities in each node. The top 1% percentile values constituted the high level (black squares in
Figure 2b,c), and the remaining values constituted the low level (grey squares). In effect, each sample has
Figure 2b,c), and the remaining values constituted the low level (grey squares). In effect, each sample
been codified by a string of levels (Figure 2c). The goal is to select those grid nodes (i.e., combinations of
has been codified by a string of levels (Figure 2c). The goal is to select those grid nodes (i.e.,
time and mass intervals) that correlate with the previously defined dichotomization label of the samples.
combinations of time and mass intervals) that correlate with the previously defined dichotomization
label of the samples.Biomolecules 2020, 10, 896 7 of 13
Figure 2c shows a simplified representation of the discretized grid variables and the codification
series of low and high binary levels for some samples (horizontal readings). Particular possibilities
were considered. Firstly, some nodes can exhibit a constant state over all the samples, i.e., they are
always present the same level feature (see, for instance, the vertical readings along the first and last
drawn nodes in Figure 2c). These types of nodes are not useful at all and were discarded. Of the 8019
dichotomized nodes, only 299 change their low or high condition over the samples. Secondly, some of
the remaining nodes could present a degeneration, i.e., the same pattern variation along the samples,
as is shown schematically for nodes 3 and 4 in Figure 2c. These degenerated nodes are equivalent
and redundant. In these cases, only a single node is passed to the SSIR procedure, together with
the individual nodes which are not degenerated (all these nodes are called representative nodes or,
simply, representatives). Of the previously mentioned 299 non-constant nodes, 237 were selected as
representatives. The SSIR procedure detects which representative binary nodes are relevant to classify
the samples. At the end of the calculation, the final reported variables are those attached to all the
selected nodes and also the represented ones, if any degeneration has occurred.
The SSIR algorithm generates rules. A rule is the combination of several levels of distinct nodes.
Normally, and for the sake of simplicity, only order 2 and 3 rules are considered when applying
SSIR. This is the same as occurs within the design of experiments theory: usually contributions and
interactions of two or, at most, three factors are able to explain the relevant variables governing
the experiment. Despite finding that order 2 rules were able to detect the relevant variables in
this chromatographic problem, surprisingly, the simplest rules of order one performed equally well.
This implies that all of the 237 discretized variables were inspected alone, one at a time. A total of
11 representative nodes exhibited a p-value less than or equal to the threshold value of 0.0005 (see below).
As was expected, all intervals centered on half integer values were automatically discarded by the
procedure. The total number of represented variables is 13. Table 2 lists the corresponding associated
intervals of the selected variables (see supplementary material Algorithm S2 for details of the ranking
procedure).
Table 2. Selected variables by SSIR after the binary codification of the signals.
Time Interval m/z Interval (amu) 1st PCA Loading 2nd PCA Loading
Variable # 1
(min) in Figure 3 in Figure 3
1 [7.3, 7.7) 95 0.335 −0.106
2 [6.7, 7.0) 95 0.225 0.286
3 [10.3, 10.7) 110 0.341 0.194
4 [10.3, 10.7) 109 0.332 0.221
5 [7.0, 7.3) 97 0.315 −0.058
6 [7.0, 7.3) 67 0.294 0.166
7 [6.7, 7.0) 96 0.249 0.198
8 [7.3, 7.7) 96 0.299 −0.243
9 [10.7, 11.0) 109 0.285 −0.217
10 [10.7, 11.0) 110 0.272 −0.286
11 [7.0, 7.3) 51 0.308 0.237
12 [8.7, 9.0) 51 −0.106 0.497
13 [9.0, 9.3) 78 −0.111 0.509
1 The interval center is indicated. The interval has a radius of 0.25 amu.
For each variable, a reckoning was performed to look for the number of high and low levels found
along the two classes of samples. Table 3 presents the relevant data. The values for high and low levels
of the same kind of sample (either treated or non-treated) are complementary, with the total sum being
the constant of 28 samples. Visually, the asymmetric distribution of values along the columns of high
and low variable levels shows classification tendencies. For instance, variables 2 and 7 are found at
the high level in all the treated samples, but also in many non-treated ones (5 and 15, respectively).
Remarkably, variables 3 and 4 are found at the high level in 23 of the treated samples and in none ofBiomolecules 2020, 10, 896 8 of 13
Biomolecules 2020, 10, x FOR PEER REVIEW 8 of 13
the
andnon-treated ones.
in none of the On the other
non-treated ones.hand,
On the variables 3, 4,variables
other hand, 6, 9, 10 and
3, 4,116,are present
9, 10 and 11atare
a low levelatina
present
all
low level in all the non-treated samples, and the first two of them are present at a low level treated
the non-treated samples, and the first two of them are present at a low level in only five in only
samples. Variable
five treated 12 is
samples. present12
Variable in is
itspresent
low level in all
in its lowthe treated
level in allsamples.
the treated samples.
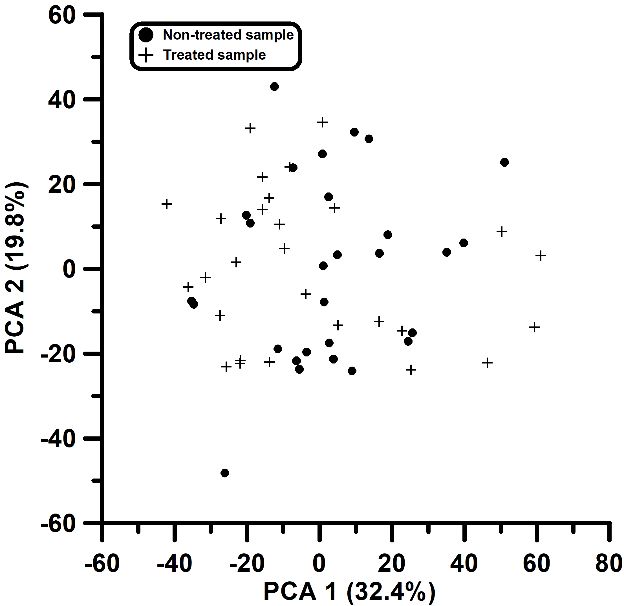
3. PCA representation of the treated and non-treated
Figure 3. non-treated samples from the selected
selected variables by
SSIR. See text
text for
for more
more details.
details.
Table 3. Reckoning of high or low levels for dichotomic selected variables of the treated and
Table 3. Reckoning of high or low levels for dichotomic selected variables of the treated and non-
non-treated samples.
treated samples.
High Level Low Level
High Level Low Level
Variable # p-Value 1
Non-Treated Treated Non-Treated
Variable # Non-Treated Treated Non-Treated Treated Treated p-Value 1
Samples Samples Samples Samples
Samples Samples Samples Samples
1 1 2 2 27 27 26
26 1 1 1.4·10−12 1.4·10−12
2 5 28 23 0 3.1·10−11
2 5 28 23 0 3.1·10−11
3 0 23 28 5 3.1·10−11
4 3 0 0 23 23 28
28 5 5 3.1·10 −11
3.1·10−11
5 4 4 0 25 23 28
24 5 3 3.1·10−119.3·10−9
6 5 0 4 16 25 24
28 3 12 9.3·10−97.3·10−7
7 6 15 0 28 16 13
28 12 0 7.3·10−72.0·10−5
8 14 27 28 14 −5
7 15 13 0 1 2.0·10−57.1·10−4
9 0 11 28 17 1.4·10
8 14 27 14 1 7.1·10−5
10 0 11 28 17 1.4·10−4
11 9 0 0 10 11 28
28 17 18 1.4·10 −4
3.7·10−4
12 10 10 0 0 11 28
18 17 28 1.4·10 −4
3.7·10−4
13 11 12 0 1 10 28
16 18 27 3.7·10 4.7·10−4
−4
1 According to12 10 in the text. The
the formulation given 0 total number18
of samples is 56 28
of which 283.7·10 −4
are treated and 28
are non-treated.
13 12 1 16 27 4.7·10−4
1 According to the formulation given in the text. The total number of samples is 56 of which 28 are
Similarly,
treated andvariable 13 is present at a low level in all of the treated samples but one. Variables 12
28 are non-treated.
and 13 can be associated with the disappearance of a certain compound or compounds. This is also
Similarly,
concurrent withvariable 13 isthe
the fact that present
meanatpeaka low level
areas of in all of
these the treated
variables amongsamples
treatedbut one. Variables
samples 12
is less than
and of
that 13 the
can non-treated
be associated withThese
ones. the disappearance of a certainallow
numerical distributions compound or compounds.
the significance Thistoiseach
attached also
concurrent
selected with to
variable thebefact that the(p-value).
evaluated mean peak Theareas of these calculation
probabilistic variables among treated was
of the p-value samples is less
performed
than that
using of the 6non-treated
equations ones. These
and 7 of reference [31]. numerical distributions allow the significance attached to
each The
selected variable
key idea of thetoSSIR
be evaluated
method is (p-value). The probabilistic
that each variable acts as ancalculation of theextractor
a priori random p-value and
was
performed
classifier of using equations
samples. 6 andis7 then
The p-value of reference
used to [31].
determine how difficult it is to find a certain number
The key
of treated idea of
samples the SSIR
within method
the set selectedis that each
by the variable
variable. In acts
this as an aeach
study, priori random
time extractor
the p-value and
is equal
classifier of samples. The p-value is then used to determine how difficult it is to find a certain number
of treated samples within the set selected by the variable. In this study, each time the p-value is equalBiomolecules 2020, 10, 896 9 of 13
to or less than the predefined threshold, the variable was selected for classification purposes, as it is
expected to correlate with the dichotomic classification of the samples.
It has been found by inspection that, for all but the last two variables, there is a correlation with the
increase in the chromatographic mean intensities of the treated samples with respect to the non-treated
ones. Hence, the related ions are to be attached to compounds that were generated after sample
treatment. This was surprising, as the treatment (temperature and washing cycles) was conducted
with the aim of removing compounds. With regards to the last two variables in Table 2, the mean
cumulative areas among treated samples is about half the areas found among the non-treated ones.
These ions can be attributed to the process of compound removal.
The selected variables in Table 3 were considered for modelling purposes. The variables were
entered as descriptors in a PCA calculation using the original sum of collected peak intensities found
before the dichotomization as the descriptor value (see supplementary Table S3). The scores map
generated is depicted in Figure 3. The first principal component retains 58.3% of the variance, and the
second, 19.6%. This constitutes an important increase with respect to the values found in Figure 1.
Furthermore, it is clearly seen that the first component alone acts as a discriminant function for the
classification of both types of samples. The loadings of the two first components are given in the last
column in Table 2. The loadings along the first principal component are similar, and almost all the
variables contribute equally. The last two variables are associated with a negative contribution. This is
not surprising because these variables are associated with a possible disappearance of a compound,
as has been mentioned above. The behavior of variables 11 and 12 is worth noting: both are attached to
the same mass of 51 units, but the first appears in treated samples while the last one seems to disappear
after the washing treatment. Despite the fragment mass being the same, the origin must be attributed
to distinct compounds, given that they correspond to different time intervals (i.e., retention times).
3.3. Discrimination and Prediction
As stated above, the first principal component described above constitutes a valid variable
to discriminate samples. The discriminant model correctly classified all but one of the samples.
Thus, the sensitivity of the model was about 96% and the specificity was 100%. In order to test the
robustness of such a model, a leave-one-out cross-validation calculation was conducted. The procedure
consisted of the elimination of one sample at a time and then redoing all of the calculations with
the remaining 55 (i.e., reading all the bulk chromatographic files from scratch, defining the grid and
dichotomizing it, constructing the SSIR model, performing the PCA calculation and deriving the linear
discriminant function). The discriminant function was then applied to the removed sample in order
to predict whether it was treated or non-treated. All of the 56 samples passed their own individual
cross-validation tests, and for all but two of them the prediction was correct (96% performance).
Additionally, discriminant functions involving 2 to 5 of the first principal components were also
considered in all the leave-one-out procedures. When the model involved the two first principal
components, only one classification error was found. The models involving 3 to 5 principal components
correctly classified all of the samples.
3.4. Identification of the Compounds Responsible for Group Separation
The acquired chromatograms were inspected, taking into consideration the information obtained
from the SIRR procedure and Table 2. From the table, three specific time intervals can be distinguished,
corresponding to different compounds eluting out of the chromatographic column: from 6.7 to 7.7 min
(with ions 51, 67, 95, 96 and 97), from 10.3 to 11.0 min (with ions 109 and 110) and from 8.7 to
9.3 min (with ions 51 and 78). The three intervals correspond to variables 5, 7, 8 and 11 (first interval),
variables 3, 4, 9 and 10 (second interval), and variables 12 and 13 (third interval), as shown in Table 2.
An inspection of the NIST library allows a tentative identification of the compounds for the two first
time intervals, namely furfural and 5-methylfurfural (see Figure 4). The identity of the compounds was
verified by injecting pure standards. Variables of the third interval could not be identified despite themBiomolecules 2020, 10, 896 10 of 13
Biomolecules 2020, 10, x FOR PEER REVIEW 10 of 13
possibly playing
associated a relevant that
to compounds role in the treatment;
presumably these are
disappear orthe
areonly variables
removed dueassociated to compounds
to the washing cycles.
that presumably disappear or are removed due to the washing cycles. Taking into
Taking into account the results shown in Figure 3, we can conclude that the three compoundsaccount the results
are
shown in Figure
responsible 3, we
for the can conclude
separation of thethat the three
56 cork compounds
samples are responsible
into the treated for the separation
and non-treated of the
groups, which
56 achieved
is cork samples intountargeted
by the the treated and non-treated
analysis groups, whichdata
of chromatographic is achieved
without bythe
the possibly
untargeted analysis
subjective
of chromatographic data without
contribution of human perception. the possibly subjective contribution of human perception.
Figure 4.
Figure XICof
4. XIC ofsample
sample‘mostra46R-1xCD’.
‘mostra46R-1xCD’.The
Theions
ionsselected
selectedwere
were 51+67+78+95+96+97+109+110.
51+67+78+95+96+97+109+110. The
The mass
mass spectra
spectra of theoftwo
themain
two main
peaks,peaks, with identifications
with identifications according
according to thelibrary,
to the NIST NIST library, are
are shown
shown
below. below.
The presence
The presence of of various
variousfuran
furanderivatives
derivativesinincork
corksamples
samples has
hasalready
already been
beendescribed
described[11,36–38].
[11,36–
The authors related the presence of various furan derivatives to
38]. The authors related the presence of various furan derivatives to carbohydrate degradationcarbohydrate degradation
(Maillard-type and
(Maillard-type and acid-catalyzed
acid-catalyzed sugarsugar degradation).
degradation). This This suggests
suggests that
that the
the thermal
thermal treatment
treatment
applied to corks intended to reduce the TCA content may have the parallel
applied to corks intended to reduce the TCA content may have the parallel effect of favoring an effect of favoring an
increase in the concentration of furans. In fact, furfural and 5-methylfurfural
increase in the concentration of furans. In fact, furfural and 5-methylfurfural were found to be present were found to be
present
in winesinaged
winesinaged in barrels.
barrels. FurfuralFurfural compounds
compounds are formed
are formed by by thermolysis
thermolysis ofofthe
thecellulose
cellulose and
and
hemicelluloses, together with Maillard reactions that take place during cooperage
hemicelluloses, together with Maillard reactions that take place during cooperage [39]. Moreover, [39]. Moreover,
furfural and
furfural and 5-methylfurfural
5-methylfurfural are are described
described asas having
having anan almond-type
almond-type aroma, aroma, which
which agrees
agrees with
with the
the
sweet notes identified in treated cork by the sensory
sweet notes identified in treated cork by the sensory panel. panel.
Boudaoud et
Boudaoud et al.
al. [30]
[30] demonstrate
demonstrate aa DHS-MS
DHS-MS method
method in in conjunction
conjunction withwith multivariate
multivariate analysis
analysis
as aapromising
as promisingand and simple
simple solution
solution to determine
to determine the origin
the origin of cork.of Incork. In the study,
the present presentthestudy,
HS-
the HS-SPME/GC-MS-SSIR method has shown itself to be a useful tool
SPME/GC-MS-SSIR method has shown itself to be a useful tool not only in distinguishing between not only in distinguishing
betweenand
treated treated and non-treated
non-treated cork samples
cork samples but also
but also in identifying
in identifying thethe volatilecompounds
volatile compoundsthat that are
are
responsible for
responsible for the
the sensory
sensory changes
changesproduced
producedasasaaresult
resultofofthe
thetreatments.
treatments.The Theindustrial
industrialrelevance
relevanceof
these findings is evident.
of these findings is evident.
4. Conclusions
4. Conclusions
Given the challenging problem of sample classification for which traditional numerical treatment
Given the challenging problem of sample classification for which traditional numerical
of chromatographic data was inconclusive, it has been demonstrated that the application of the SSIR
treatment of chromatographic data was inconclusive, it has been demonstrated that the application
procedure leads to the identification of a set of 13 relevant variables. These variables allowed for a
of the SSIR procedure leads to the identification of a set of 13 relevant variables. These variables
PCA and DA classification with good figures of merit. The inspection in detail of these variables
allowed for a PCA and DA classification with good figures of merit. The inspection in detail of these
in the original chromatographs leads to the conclusion that three compounds are responsible for
variables in the original chromatographs leads to the conclusion that three compounds are
the separation of the 56 cork samples into the treated and non-treated groups presenting different
responsible for the separation of the 56 cork samples into the treated and non-treated groups
presenting different sensory descriptors. Additionally, despite the treatment of samples beingBiomolecules 2020, 10, 896 11 of 13
sensory descriptors. Additionally, despite the treatment of samples being conducted in order to
remove certain compounds, thanks to the proposed methodology, evidence has been found that, on the
contrary, some new compounds, i.e., furfural and 5-methylfurfural, were also possibly generated by
the treatment itself.
Supplementary Materials: The following are available online at http://www.mdpi.com/2218-273X/10/6/896/s1.
Table S1: List of samples and the condition of being treated (1) or non-treated (0). Area ratios for each target
compound used in the first manual inspection and in the first PCA analysis, conducting to Figure 1; Algorithm S2:
Description of the SSIR algorithm adapted to dichotomic variables selection; Table S3: List of samples and the
condition of being treated (1) or non-treated (2). Peak intensities collected for each sample at the 13 variables
(Table 2) selected by SSIR procedure. The PCA of this matrix conducted to Figure 3.
Author Contributions: Conceptualization, E.B.; Data curation, E.B. and E.A.; Formal analysis, E.B. and E.A.;
Investigation, E.B., C.P. and E.A.; Methodology, E.B., C.P. and E.A.; Resources, E.B., C.P. and E.A.; Software, E.B.;
Supervision, E.B., C.P. and E.A.; Writing—original draft, E.B. and E.A.; Writing—review and editing, E.B. and E.A.
All authors have read and agree to the published version of the manuscript.
Funding: This research was partially funded by the University of Girona.
Acknowledgments: The contribution of J. Parreño and M. Pozo are gratefully acknowledged.
Conflicts of Interest: The authors declare no conflict of interest. The funders had no role in the design of the
study; in the collection, analyses, or interpretation of data; in the writing of the manuscript, or in the decision to
publish the results.
References
1. Pereira, H. The Rationale behind Cork Properties: A Review of Structure and Chemistry. Bioresources 2015,
10, 1–23. [CrossRef]
2. Silva, S.P.; Sabino, M.A.; Fernandes, E.M.; Correlo, V.M.; Boesel, L.F.; Reis, R.L. Cork: Properties, capabilities
and applications. Int. Mater. Rev. 2005, 50, 345–365. [CrossRef]
3. Fernandes, A.; Sousa, A.; Mateus, N.; Cabral, M.; de Freitas, V. Analysis of phenolic compounds in cork from
Quercus suber L. by HPLC-DAD/ESI-MS. Food Chem. 2011, 125, 1398–1405. [CrossRef]
4. Varea, S.; García-Vallejo, M.C.; Cadahía, E.; Fernández de Simon, B. Polyphenols susceptible to migrate from
cork stoppers to wine. Eur. Food Res. Technol. 2001, 213, 56–61. [CrossRef]
5. Pinto, J.; Oliveira, A.S.; Lopes, P.; Roseira, I.; Cabral, M.; Bastos, M.L.; Guedes de Pinho, P. Characterization
of chemical compounds susceptible to be extracted from cork by the wine using GC-MS and 1H NMR
metabolomics approaches. Food Chem. 2019, 271, 639–649. [CrossRef] [PubMed]
6. Azevedo, J.; Fernades, I.L.; Lopes, P.; Roseira, I.; Cabral, M.; Mateus, N.; Freitas, V. Migration of phenolic
compounds from different cork stoppers to wine model solutions: Antioxidant and biological relevance.
Eur. Food Res. Technol. 2014, 239, 951–960. [CrossRef]
7. Moreira, N.; Lopes, P.; Cabral, M.; Guedes de Pinho, P. HS-SPME/GC-MS methodologies for the analysis of
volatile compounds in cork material. Eur. Food Res. Technol. 2016, 242, 457–466. [CrossRef]
8. Barreto, M.C.; Vilas Boas, L.; Carneiro, L.C.; San Romao, M.V. Volatile compounds in samples of cork and
also produced by selected fungi. J. Agric. Food Chem. 2011, 59, 6568–6574. [CrossRef]
9. Prat, C.; Trias, R.; Culleré, L.; Escudero, A.; Anticó, E.; Bañeras, L. Off-odor compounds produced in cork by
isolated bacteria and fungi: A gas chromatography-mass spectrometry and gas chromatography-olfactometry
study. J. Agric. Food Chem. 2009, 57, 7473–7479. [CrossRef]
10. Prat, C.; Besalú, E.; Bañeras, L.; Anticó, E. Multivariate analysis of volatile compounds detected by headspace
solid-phase microextraction/gas chromatography: A tool for sensory classification of cork stoppers. Food Chem.
2011, 126, 1978–1984. [CrossRef]
11. Rocha, S.; Delgadillo, I.; Ferrer Correia, A.J. GC-MS Study of Volatiles of Normal and Microbiologically
Attacked Cork from Quercus suber L. J. Agric. Food Chem. 1996, 44, 865–871. [CrossRef]
12. Belitz, H.-D.; Grosch, W.; Schieberle, P. Food Chemistry, 3rd ed.; Springer: Berlin/Heidelberg, Germany, 2004;
ISBN 978-3-540-69933-0.
13. Rocha, S.; Delgadillo, I.; Ferrer Correia, A.J.; Barros, A.; Wells, P. Application of an electronic aroma sensing
system to cork stopper quality control. J. Agric. Food Chem. 1998, 46, 145–151. [CrossRef] [PubMed]Biomolecules 2020, 10, 896 12 of 13
14. Culleré, L.; Cacho, J.; Ferreira, V. Comparative study of the aromatic profile of different kinds of wine cork
stoppers. Food Chem. 2009, 112, 381–387. [CrossRef]
15. Aroso, I.M.; Araújo, A.R.; Fernandes, J.P.; Santos, T.; Batista, M.T.; Pires, R.A.; Mano, J.F.; Reis, R.L.
Hydroalcoholic extracts form the bark of Quercus suber L. (cork): Optimization of extraction conditions,
chemical composition and antioxidant potential. Wood Sci. Technol. 2017, 51, 855–872. [CrossRef]
16. Macku, C.; Gonzalez, L.; Schleussner, C.; Mesquita, A.C.; Herwatt, J.W.; Kirch, L.C.; Schwartz, R.J. Sensory
screening for large format natural cork by “dry soak” testing and its correlation to headspace solid-phase
microextraction (SPME) gas chromatography/mass spectrometry (GC/MS) releasable trichloroanisole (TCA)
analysis. J. Agric. Food Chem. 2009, 57, 7962–7968. [CrossRef] [PubMed]
17. Tarasov, A.; Rauhut, D.; Junga, R. “Cork taint” responsible compounds. Determination of haloanisoles and
halophenols in cork matrix: A review. Talanta 2017, 175, 82–92. [CrossRef] [PubMed]
18. Soleas, G.J.; Yan, J.; Seaver, T.; Goldberg, D.M. Method for gas chromatographic assay with mass selective
detection of trichloro compounds in corks and wines applied to elucidate the potential cause of cork taint.
J. Agric. Food Chem. 2002, 50, 1032–1039. [CrossRef]
19. Castro, R.; Natera, R.; Duran, E.; García-Barroso, C. Application of solid phase extraction techniques to
analyse volatile compounds in wines and other enological products. Eur. Food Res. Technol. 2008, 228, 1–18.
[CrossRef]
20. Pawliszyn, J. Solid Phase Microextraction Theory and Practice; Wiley-VCH: New York, NY, USA, 1997;
ISBN 0-471-19034-9.
21. Amon, J.M.; Vandepeer, J.M.; Simpson, R.F. Compounds responsible for cork taint in wine. Wine Ind. J. 1989,
4, 62–69.
22. Chatonnet, P.; Bonnet, S.; Boutou, S.; Labadie, M.-D. Identification and Responsibility of 2,4,6-Tribromoanisole
in Musty, Corked Odors in Wine. J. Agric. Food Chem. 2004, 52, 1255–1262. [CrossRef]
23. Alvárez-Rodríguez, M.L.; López-Ocaña, L.; López-Coronado, J.M.; Rodríguez, E.; Martínez, M.J.; Larriba, G.;
Coque, J.-J.R. Cork taint of wines: Role of filamentous fungi isolated from cork in the formation of
2,4,6-trichloroanisole by O methylation of 2,4,6-trichlorophenol. Appl. Environ. Microbiol. 2002, 68, 5860–5869.
[CrossRef] [PubMed]
24. Hall, M.; Byrd, N.; Williams, J. An assessment of the effect of the ROSA treatment on the level of TCA in
naturally-contaminated cork granules. Aust. N. Z. Grapegrow. Winemak. 2004, 484, 57–59.
25. Sefton, M.A.; Simpson, R.F. Compounds causing cork taint and the factors affecting their transfer from
natural cork closures to wine—A review. Aust. J. Grape Wine Res. 2005, 11, 226–240. [CrossRef]
26. Corsi, A.; Robles Hernandez, F.C.; Cordúa Cruz, G.; Neal, J.A. The effectiveness of electron beam irradiation
to reduce or eliminate mould in cork stoppers. Int. J. Food Sci. Technol. 2016, 51, 389–395. [CrossRef]
27. Recio, E.; Álvarez-Rodríguez, M.L.; Rumbero, A.; Garzón, E.; Coque, J.-J.R. Destruction of Chloroanisoles by
Using a Hydrogen Peroxide Activated Method and Its Application To Remove Chloroanisoles from Cork
Stoppers. J. Agric. Food Chem. 2011, 59, 12589–12597. [CrossRef]
28. Vlachos, P.; Kampioti, A.; Kornaros, M.; Lyberatos, G. Development and evaluation of alternative processes
for sterilization and deodorization of cork barks and natural cork stoppers. Eur. Food Res. Technol. 2007, 225,
653–663. [CrossRef]
29. Martí, M.P.; Boqué, R.; Busto, O.; Guasch, J. Electronic noses in the quality control of alcoholic beverages.
Trends Anal. Chem. 2005, 24, 57–66. [CrossRef]
30. Boudaoud, N.; Eveleigh, L. A New Approach to the Characterization of Volatile Signatures of Cork Wine
Stoppers. J. Agric. Food Chem. 2003, 51, 1530–1533. [CrossRef]
31. Besalú, E. Fast Modeling of Binding Affinities by means of Superposing Significant Interaction Rules (SSIR)
method. Int. J. Mol. Sci. 2016, 17, 827. [CrossRef]
32. MINITAB Version 14 for Windows; Minitab Inc.: State College, PA, USA, 2004.
33. Besalú, E.; Pogliani, L.; De Julián-Ortiz, J.V. The Superposing Significant Interaction Rules (SSIR) Method in Applied
Chemistry and Chemical Engineering; Volume 4 (Experimental Techniques and Methodical Developments);
Haghi, A.K., Pogliani, L., Castro, E.A., Balköse, D., Mukbaniani, O.V., Chia, C.H., Eds.; Apple Academic
Press (AAP): Waretown, NJ, USA, 2017; ISBN 9781771885874.
34. Besalú, E.; Pogliani, L.; De Julián-Ortiz, J.V. Superposing Significant Interaction Rules (SSIR) method:
A simple procedure for rapid ranking of congeneric compounds. Croat. Chem. Acta 2016, 89, 481–492.
[CrossRef]Biomolecules 2020, 10, 896 13 of 13
35. Besalú, E.; Pogliani, L.; De Julián-Ortiz, J.V. Fast Qualitative Inspection of Designed Experiments by Means of
the Superposing Significant Interaction Rules (SSIR) Method. In Physical Chemistry for Chemists and Chemical
Engineers. Multidisciplinary Research Perspectives; Vakhrushev, A.V., Haghi, R., De Julián-Ortiz, J.V., Eds.;
Series: Innovations in Physical Chemistry: Monograph Series (Volume 9); Apple Academic Press (AAP):
Waretown, NJ, USA, 2019; ISBN 9781771886550.
36. Rocha, S.M.; Coimbra, M.A.; Delgadillo, I. Occurrence of furfuraldehydes during the processing volatile of
Quercus suber L. cork. Simultaneous determination of furfural, 5-hydroxymethylfurfural and 5-methylfurfural
and their relation with cork polysaccharides. Carbohydr. Polym. 2004, 56, 287–293. [CrossRef]
37. Horn, W.; Ullrich, D.; Seifert, B. VOC emissions from cork products for indoor use. Indoor Air 1998, 8, 39–46.
[CrossRef]
38. Brandão, P.F.; Ramos, R.M.; Almeida, P.J.; Rodrigues, J.A. Determination of carbonyl compounds in cork
agglomerates by GDME-HPLC-UV: Identification of the extracted compounds by HPLC-MS/MS. J. Agric.
Food Chem. 2017, 65, 1037–1042. [CrossRef] [PubMed]
39. Ortega-Heras, M.; González-Sanjosé, M.L.; González-Huerta, C. Consideration of the influence of aging
process, type of wine and oenological classic parameters on the levels of wood volatile compounds present
in red wines. Food Chem. 2007, 103, 1434–1448. [CrossRef]
© 2020 by the authors. Licensee MDPI, Basel, Switzerland. This article is an open access
article distributed under the terms and conditions of the Creative Commons Attribution
(CC BY) license (http://creativecommons.org/licenses/by/4.0/).You can also read