Spring foraging movements of an urban population of grey-headed flying foxes (Pteropus poliocephalus) - Oxford University ...
←
→
Page content transcription
If your browser does not render page correctly, please read the page content below
Journal of Urban Ecology, 2021, 1–10

                                                                                doi: 10.1093/jue/juaa034
                                                                                Research Article

Spring foraging movements of an urban population of
grey-headed flying foxes (Pteropus poliocephalus)

                                                                                                                                                        Downloaded from https://academic.oup.com/jue/article/7/1/juaa034/6105788 by guest on 30 April 2021
Wayne S. J. Boardman ,1,* David Roshier,2 Terry Reardon,3
Kathryn Burbidge,1 Adam McKeown,4 David A. Westcott,4
Charles G. B. Caraguel,1,1 and Thomas A. A. Prowse5,1
1
 Department of Pathobiology, Infectious Disease and Public Health, School of Animal and Veterinary Sciences,
University of Adelaide, Roseworthy, SA 5371, Australia, 2Australian Wildlife Conservancy, Subiaco, WA 6008,
Australia, 3South Australia Museum, Adelaide, SA 5000, Australia, 4CSIRO Land and Water, Atherton, QLD
4883, Australia and 5Department of Ecology and Evolutionary Biology, School of Biological Sciences, Adelaide,
SA 5000, Australia
*Corresponding author: E-mail: wayne.boardman@adelaide.edu.au
†
 These authors are equal last.

Submitted: 22 July 2020; Received (in revised form): 16 November 2020. Accepted: 22 July 2020

Abstract
Flying foxes provide ecologically and economically important ecosystem services but extensive clearing and modification of
habitat and drought combined with the planting of commercial and non-commercial trees across various landscapes, has
meant flying foxes in Australia are increasingly seeking foraging resources in new areas. In 2011, grey-headed flying foxes
formed a camp in Adelaide, South Australia, outside their previously recorded range. We used global positioning system te-
lemetry to study the movements and foraging behaviour of this species in Adelaide in spring (September to November)
2015. High-frequency location data were used to determine the foraging range and the most frequently visited foraging sites
used by each bat which were ground-truthed to identify forage plants. A total of 7239 valid locations were collected over 170
nights from four collars. Despite being a highly mobile species, the mean core foraging range estimate was only 7.30 km2
(range 3.3–11.2 km2). Maximum foraging distance from the camp in the Botanic Park was 9.5 km but most foraging occurred
within a 4-km radius. The most common foraging sites occurred within the residential area of Adelaide and included intro-
duced forage plant species, Lemon-scented gum (Corymbia citriodora) and Port Jackson fig (Ficus rubiginosa). Other observed
movement activities included dipping behaviour on inland and marine waters and travel across flight paths around
Adelaide airport. Our findings suggest that urban habitats in Adelaide provide sufficient foraging resources for grey-headed
flying foxes to use these areas exclusively, at least in spring. This creates substantial opportunities for bats to interact with
humans and their infrastructure.

Key words: urban, foraging, global positioning systems, grey-headed flying fox, Pteropus poliocephalus

Introduction                                                                    competition for resources (Webb and Tidemann 1996) and other
                                                                                global change phenomena including climate change (Parris and
The distribution of Australian flying-foxes (Pteropodidae,                      Hazell 2005; Kessler et al. 2018). In some instances, this has
Chiroptera) is changing in response to habitat loss (Markus and                 resulted in the expansion and establishment of flying-fox
Hall 2004; McDonald-Madden et al. 2005; van der Ree et al. 2006),               camps in urban areas (Williams et al. 2006). Evidence from a

C The Author(s) 2021. Published by Oxford University Press.
V
This is an Open Access article distributed under the terms of the Creative Commons Attribution License (http://creativecommons.org/licenses/by/4.0/),
which permits unrestricted reuse, distribution, and reproduction in any medium, provided the original work is properly cited.

                                                                                                                                               1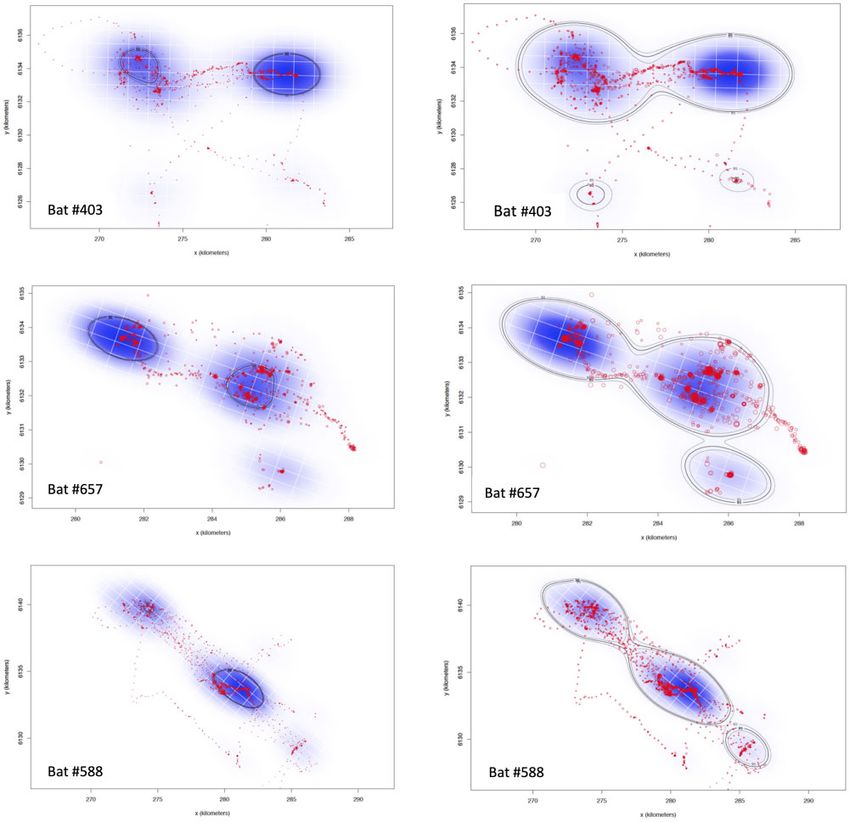
2 | Journal of Urban Ecology, 2021, Vol. 6, No. 1
range of urban-dwelling animals indicates that some of these Australia. The advent of satellite telemetry broadened our un-
urban visitors alter their ecological traits to adapt to urbanisa- derstanding of long-distance movements and the distribution
tion, including their movement and migratory behaviour (Lowry of Black flying fox (Breed et al. 2010; Smith et al. 2011) and
et al. 2013) and foraging preferences (Contesse et al. 2004). GHFFs (Tidemann and Nelson 2004; Roberts et al. 2012). By in-
Flying foxes use most habitats in which suitable foraging corporating a duty cycle that provides more frequent fixes, te-
resources are to be found and, compared to natural forests, ur- lemetry can be used to analyse fine-scale movements and
ban environments can provide increased availability and easier foraging activities of flying foxes across local landscapes. These
access of food resources (McDonald-Madden et al. 2005; van der fine-scale foraging movements have been investigated in
Ree et al. 2006; Nakamoto et al. 2012). At least 20 species of bats Madagascan flying foxes (Pteropus rufus) (Oleksy et al. 2019) and
have found useful resources in urban environments (McFarlane Lyle’s flying fox (Pteropus lylei) (Choden et al. 2019); however,
2015) and some urban areas may support a greater diversity of there is no report on fine-scale movements, foraging activities
bats than forested areas (Threlfall et al. 2013). and ground-truthing of forage plants for flying foxes within ur-
The grey-headed flying fox (GHFF, Pteropus poliocephalus) is ban landscapes in Australia.
listed as Vulnerable under the Environment Protection and Apart from sporadic anecdotal reports, we have limited un-
Biodiversity Conservation Act 1999 (Threatened Species Scientific
Downloaded from https://academic.oup.com/jue/article/7/1/juaa034/6105788 by guest on 30 April 2021
derstanding of the foraging resource use by Adelaide’s GHFF’s
Committee 2001). The species is endemic to the eastern states nor the extent of their nocturnal movements, and with it their
of Australia with the majority of the population found from potential interactions with the public. Here we documented the
south east Victoria through to Mackay (Westcott et al. 2015). foraging movements of GHFF from the Adelaide’s camp using
More recently, they have expanded their range, as far north as global positioning system (GPS) telemetry. Our study objectives
Innisfail in Queensland, along the western slopes of the Great were to (i) characterise space use and foraging range over the
Dividing Range (Westcott et al. 2015), and to the west as far as greater Adelaide region, (ii) analyse foraging site use and (iii)
the study camp in Adelaide. ground-truth and identify foraged food plants. We expected
GHFFs are a generalist nectarivore and frugivore that GHFF would forage beyond the Adelaide boundaries to find
(Schmelitschek et al. 2009) and use food resources such as man- sufficient and suitable food resources.
groves, coastal and montane woodlands (Woinarski and
Burbidge 2014; Westcott et al. 2015). The species is considered a
sequential specialist, that is, within one area it will use a limited Methods
number of food sources hierarchically consuming a plentiful re- Ethics
source until it is consumed or becomes unavailable (Parry-Jones
and Augee 1991). Common food trees include the fruits of A permit to undertake scientific research was granted by the
Moraceae, the blossom of Myrtaceae, Proteaceae and a variety Government of South Australia Department of Environment,
of planted native and exotic trees in urban areas (Eby 1991; Water and Natural Resources (M26371). Field procedures were
Parry-Jones and Augee 1991; Tidemann 1999; van der Ree et al. approved by the University of Adelaide Animal Ethics
2006; Williams et al. 2006; Schmelitschek et al. 2009; Griffith Committee (S-2015-028).
et al. 2020).
In 2011, GHFF expanded their former range and formed a Study site, animal capture and deployment of GPS
camp in Adelaide’s Botanic Park, South Australia, a popular rec- tracking devices
reational site for the city’s populace. Since that time, the camp
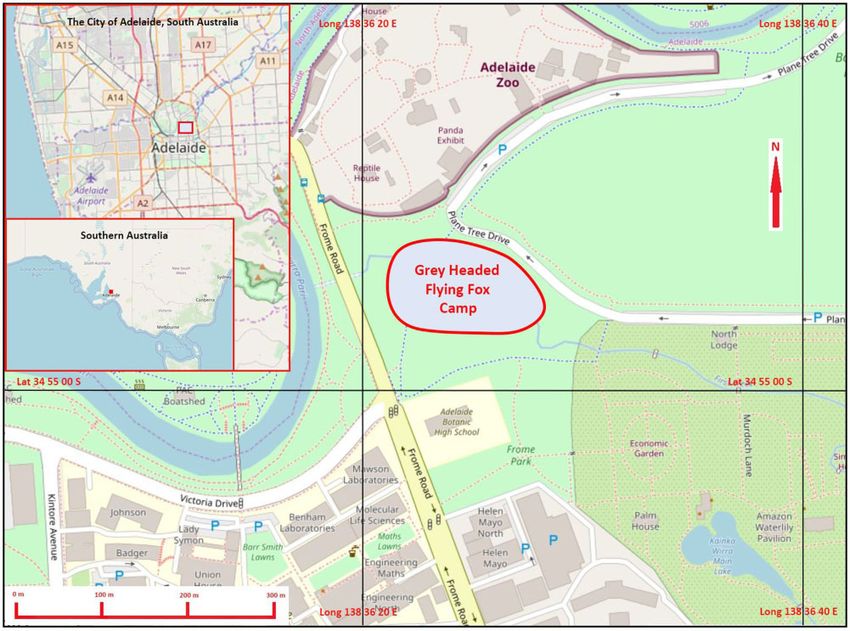
has increased from an estimated 300 to 20 000 individuals The population used for this study was the GHFF camp (Fig. 1)
(Jason Van Weenen, pers. comm., March 2020) through breeding established in Adelaide’s Botanic Park, Adelaide, South
and seasonal immigration and is now classified as a nationally- Australia ( 34.91588; 138.6065) in Aleppo pine (Pinus halopensis).
important permanent camp (Commonwealth of Australia 2015). Between 31 August and 3 September 2015, study animals were
Adult counts tend to be highest in winter and lowest in summer captured at the roost site, using 12- or 18-m-long mist nets
(Jason Van Weenen, pers. comm., March 2020). The increase in (Ecotone, Gdynia, Poland) installed beneath the camp. Mist nets
camp size has occurred despite seasonal emigration and large were raised 20 m above the ground before bats returned from
bat mortality events during extreme heat waves in the sum- their nightly foraging activity. As each bat became entrapped,
mers of 2017 and 2019. The reason for the GHFF range expan- the net was lowered, the bat carefully removed and placed se-
sion into an urban environment is unknown, but it has been curely in a pillowcase, and the net was then raised again to
suggested that flying foxes aggregate in urban environments to catch additional bats. The bagged bats were immediately relo-
exploit greater food resources (Kessler et al. 2018). The presence cated to the Animal Health Department of the adjacent
of large bat camps in urban areas can also lead to animal–hu- Adelaide Zoo.
man conflicts. Flying foxes from this camp have caused power We attached prototype CSIRO Camazotz data loggers (Jurdak
outages, occasional plane strikes, foraged in orchards and gar- et al. 2013) to five individuals using c. 2-cm-wide neoprene col-
dens (Jason Van Weenen, pers. comm., April 2020) and are lars with a kangaroo-leather lining. All selected bats were free
known to carry a variety of viruses with zoonotic potential from any clinical signs of disease or abnormalities and of suffi-
(Boardman et al. 2020). cient size that the combined weight of transmitter and collar
Telemetry studies have been undertaken on several Pteropus (23 g) was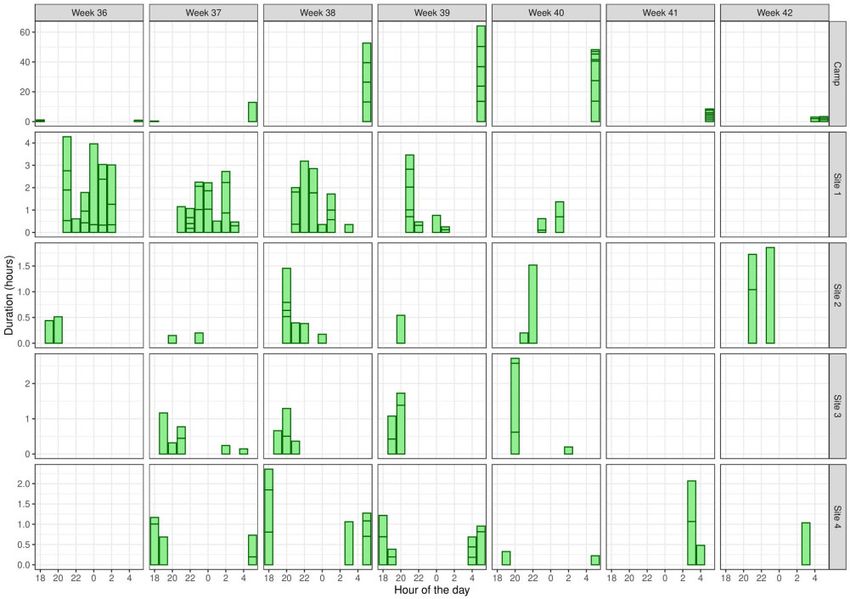
Spring foraging movements of flying foxes           |   3

                                                                                                                                                                       Downloaded from https://academic.oup.com/jue/article/7/1/juaa034/6105788 by guest on 30 April 2021
Figure 1: Location of the GHFF (Pteropus poliocephalus) camp in Adelaide’s Botanic Park showing camp extent (red line) and proximity to Adelaide Zoo where bats were
tagged. Insets illustrate central Adelaide and Southern Australia to show geographical relationships. Geodata from OpenStreetMap was downloaded via the Maperitive
application and the map was rendered with further information supplied by the author.

and air pressure logger, audio recorder and inertial units to                        fixes in the dataset were managed in Movebank (Kranstauber
modulate recording when bats were stationary for long periods                        et al. 2011). We thinned the dataset to one fix per minute and, in
(Jurdak et al. 2013). Tracking devices were powered by a solar                       addition, we removed all locations between sunrise and sunset,
panel affixed to the exterior dorsal surface for recharging batter-                  when bats were roosting in the camp, using the crespuscule func-
ies of 300 milliamp-hour capacity, and an antenna projecting                         tion in the maptools package (v. 0.9.5, Lewin-Koh et al. 2011) in R
approximately 7 cm dorsally and caudally to transmit data via                        (v. 3.6.2, R Core Team 2019). All times are Australian Central
short range UHF radio waves.                                                         Standard Time and take no account of daylight-saving time.

Data acquisition and management                                                      Foraging range estimation
Each GPS device recorded an individuals’ 3D position at 1-sec-                       In ecology, kernel density estimation (KDE) is a widely used
ond intervals unless battery life was low (
4 | Journal of Urban Ecology, 2021, Vol. 6, No. 1
estimators of home-range (Noonan et al. 2019). We used the Individual bat movements
ctmm.select function in R package to examine candidate models
Each individual bat had preferred and distinct foraging path-
using maximum likelihood (Fleming et al. 2014) and selected
ways that included several foraging sites that they revisited
the best model based on the lowest Akaike information criterion multiple times (Supplementary Fig. S1). Two individuals appear
(Akaike 1973, 1974). In all cases, the best model for individuals to regularly follow major geographic landmarks, being Port
was the anisotropic Ornstein-Uhlenbeck F process model for Road (Bat #403) and the River Torrens (Bat #588), while the third
individuals that display limited space use and correlated veloci- followed a smaller drainage line to the foot of the Adelaide Hills
ties (Calabrese et al. 2016). We then calculated the weighted uti- (Bat #657) (Supplementary Fig. S1). Bat #403 ranged mostly to
lisation distribution using the akde function for both core area the west of the camp in the Botanic Gardens with outward and
and extended foraging range area. return flights following the course of the River Torrens and of-
ten diverged north westerly to repeatedly visit the same forag-
Foraging sites and visitation ing sites in the western suburbs. This routine remained
throughout the tracking period from early September to late
We used the recurse package (v. 1.1.0; Bracis, Bildstein and
October. Bat #403 made two notable extensions to its regular
Mueller 2018) in R (v. 3.6.2; R Core Team 2019) to determine the
Downloaded from https://academic.oup.com/jue/article/7/1/juaa034/6105788 by guest on 30 April 2021
route. One atypical flight took a path 9.6 km to the south flying
location and frequency of visits to foraging sites. The recurse
across Adelaide International Airport (at 40 m above mean sea
package counts the number of trajectory segments of the move-
level at 22h10; 19 September 2015) and then a 10 km loop out
ment paths of individuals that intersect a circle specified by a
to sea. On several occasions, bat #403 was recorded on the water
radius set at 25 m around GPS fixes. It then counts the number
surface of the River Torrens and made short excursions onto
of trajectory segments of the movement paths of one or many
the sea at Henley Beach, approximately 6 km from its usual for-
individuals that intersect the circle. Each such intersection was
aging sites.
classified as one visit. The package used linear interpolation to Bat #657 ranged to the east of the city repeatedly following
estimate the entrance and exit times and calculated visit dura- the course of First Creek ( 34.9295 S; 138.6443 E) to the eastern
tion and time since previous visit. We used a frequency histo- suburbs, with various short extensions of less than 2 km from
gram to identify a foraging site visitation threshold of >20 visits its regular path. On two occasions it extended its route to a
per location and selected the six most frequented foraging sites quarry dam at Slapes Gully (34.9469 S; 138.6803 E) and is
for each individual bat over the study period to ground-truth recorded close to the estimated water surface height. Bat #588
what they had been eating. Further, we compared the visit fre- ranged mostly to the north-west of the camp, travelling out and
quency with each site, duration of each visitation and duration back along a busy tree lined thoroughfare corresponding to Port
by week of the year to assess foraging site usage over time. Rd and the Port Adelaide railway line ( 34.8783 S; 138.5321 E).
This individual repeatedly visited selected trees in residential
Identification of foraging plants suburbs. Two atypical extensions to its usual course were made
on two consecutive nights, one to the south of Adelaide and
The most frequently visited GPS fixes selected above were
south east to Brown Hill Creek ( 34.9859 S; 138.6512 E), and
ground-truthed (including 25-m radius around the fix) to iden-
one west along the River Torrens. The first extension was made
tify foraging plants. Photographs were taken of trees of interest,
on the same night that Bat #657 travelled south. Bat #588 also
and buds, flowers or fruiting bodies and leaf-branch structure
visited wetlands at St. Clair ( 34.8680 S; 138.5322 E) on six
were sampled for identification. These samples were identified,
occasions. Bat #684 returned only limited data at 10-minute
where possible to species, using expertise at the State intervals for 5 days (suggesting that battery levels were persis-
Herbarium of South Australia and appropriate keys and identifi- tently low) has been excluded from Supplementary Fig. S1, be-
cation guides. Confirmed (investigated) feeding sites were clas- cause it showed limited linear data only. It ranged to the north-
sified as park, street or private land types. ‘Park’ was defined as east following the course of the River Torrens, a vegetated and
a vegetated public space, sporting field, school, park and fore- landscaped park area on both banks. It took a similar route for
shore; ‘street’ was defined as residential road frontage, curb- all recorded flight periods and foraged along the River Torrens
side, roadside footpath or median-strips and railway or highway and adjacent suburbs either side of the river. However, there
screens, and ‘private’ was defined as privately owned vegeta- were insufficient data to further analyse foraging site range or
tion in business premises, domestic gardens, rear yards or re- visitation.
stricted access areas including, for example, the private off-road
car park of a housing community. Core and extended foraging-range and forage site visita-
tion patterns
Results The foraging range (weighted utilisation distribution) from the
GPS tracker performance camp site varied between individuals. Of the three individuals
that provided sufficient data, the mean core foraging area
Five adult males had tracking devices attached of which only (AKDE50), the area used for 50% of the foraging time, was
four returned data (Table 1). Our GPS devices transmitted for 5– 7.30 km2 (range 3.3–11.2 km2) (Table 2; Fig. 2). The mean ex-
62 nights and a total of 7239 valid locations were collected over tended foraging range (AKDE95), was 45.0 km2 (range 1.78–
170 nights from the four collars (Table 1). These fixes included 62.2 km2) (Table 2; Fig. 2). Both of these areas included the camp
some from within the camp itself when the individual departed site, but daytime locations were not used to calculate the uti-
after sunset or returned to camp before sunrise. The proportion lisation distribution. An example of the frequency and pattern
of valid data (i.e. data with an actual geographic location) was of visitation is illustrated in Fig. 3 for bat #403. Frequency and
99.8%. Mean PDOP across all points was 3.06, and all were patterns of visitation for bat #657 and #588 are included in
within the recommended range of 2–5 for reliable navigation. Supplementary Figs. S2 and S3, respectively.Spring foraging movements of flying foxes | 5
Table 1: Morphometrics, GPS collar deployment and thinned fixes and foraging distances of four adult male GHFFs from the Adelaide camp be-
tween 31 August 2015 and 2 November 2015.
Bat ID# Weight (g) FAL (mm) Tagging date First record date Last record date Tracking Location Night time
night fix location
count count fix count
403 883 169 3 September 15 3 September 2015 21 October 2015 48 3072 2492
657 854 166 31 August 2015 31 August 2015 24 October 2015 55 3684 2901
588 846 156 1 September 2015 1 September 2015 02 November 2015 62 2254 1790
684 944 173 3 September 15 3 September 2015 09 September 2015 5 68 46
575 851 172 31 August 15 N/A N/A N/A N/A N/A
Total 170 9078 7239
FAL, forearm length; N/A, not applicable.
Downloaded from https://academic.oup.com/jue/article/7/1/juaa034/6105788 by guest on 30 April 2021
Table 2: Utilisation distribution (km2) with confidence intervals us- identified at these sites, including the Flooded gum (E. grandis)
ing weighted AKDE for the foraging range of three GHFFs from the and Sugar gum (E. cladocalyx), do not flower during spring and
Adelaide camp between 31 August 2015 and 2 November 2015 with were therefore unlikely to be a food source at the time of our
meaningful data study. Of the species identified at the foraging sites only River
Bat ID # Core Utilisation distribution Extended Utilisation
red gum (E. camaldulensis) and Sugar gum are native to South
defined by AKDE distribution defined by Australia and neither flower in spring. All other species identi-
50 (km2) (95% CI) AKDE 95 (km2) (95% CI) fied are either not native to South Australia (10 species) or are
exotic to Australia (two species) and were introduced to the
403 11.2 (9.8–12.6) 62.2 (57.1–73.8) Adelaide region following European settlement. Plants at two
657 3.3 (2.9–3.6) 17.8 (15.8–19.9) locations (once each for bat #657 and bat #588) could not be
588 7.4 (6.5–8.3) 55.0 (48.7–61.7) identified due to access restrictions.
CI, confidence interval.
Discussion
Our study provides insights into the fine scale movements of
GHFFs in an urban environment in Australia. Our data show
Overall 15 frequently visited foraging sites were identified
that, during spring 2015, the four tracked GHFFs foraged entirely
(>20 visits over the period of observations). Bats #403, #657 and
within the urban area of Adelaide on tree species either non-
#588 had 5, 6 and 5 frequently visited foraging sites, respec-
native to South Australia or exotic trees. A similar preference
tively. The most commonly visited foraging sites were on
for urban plantings of forage trees was observed in Cambodia in
streets (7 of 15; 47%) and foraging plants were either not native
the only other study to examine fine-scale movements and for-
to South Australia or exotic. One site in close proximity to the
aging preferences of a large flying fox (Choden et al. 2019).
camp in the Botanic Gardens ( 34.9169 S; 138.6118 E) was used
Consistent with other studies across Australia, GHFFs repeat-
by two of the tracked bats, #403 and #657. In weeks 37–42, bat
edly returned to the same foraging sites at similar times over
#403 often visited this site immediately after leaving the camp
several nights and weeks often for extended periods of time
and revisited again before returning to the camp, suggesting a
(Fig. 4 and Supplementary Figs. S4 and S5). Recorded distances
reliable food resource during that period (Fig. 4). Productive for-
covered nightly were consistent with those reported for individ-
aging sites were visited repeatedly. For example, bat #403 spent
uals in Queensland and New South Wales, which foraged within
42 hours in total at site 3 over 4 weeks (36–39) feeding on a
a 20-km radius of the camp (Eby 1991; Tidemann 1999).
Lemon-scented gum (Corymbia citriodora) (Fig. 4). Visitation de-
However, in these studies the primary foraging sites were rem-
clined thereafter. Similarly, bat# 657 made visits to site 4,
nant native forest patches areas within largely agricultural
European olive (Olea europaea), during weeks 37–40
landscapes. We found that all collared bats had small core
(Supplementary Fig. S4) spending over 22 hours foraging in total
home ranges, with the most commonly visited foraging sites
at this site. This bat also foraged on Queensland box
within 9.5 km of the roost camp and most of regular foraging
(Lophostermon confertus) flowers at site 6, close to site 4, during
sites occurring within a 4-km radius of the camp. This relatively
weeks 37–41 for approximately 31 hours overall. In contrast, bat
small foraging range suggests that food resources were plentiful
#588 only visited a single site (site 2) during weeks 36–39, to for-
for the GHFF population, estimated to be approximately 3000
age on Port Jackson fig (Ficus rubiginosa) for 41 hours total
(Jason Van Weenen, pers. comm.). Bats often returned to the
(Supplementary Fig. S5). Following foraging, all three bats regu-
camp before sunrise suggesting they found sufficient food
larly returned to the camp up to 2 hours before sunrise.
resources in the time that they were foraging (Fig. 4 and
Supplementary Figs. S4 and S5). Consistently between 2015 and
Identification of foraging plants 2018, the body condition of flying foxes in this camp in Adelaide
Fourteen plants used by GHFF were identified at the most vis- was better in spring than in summer (Boardman et al. 2020)
ited foraging sites (Table 3). At seven foraging sites, there were which is opposite to the findings of GHFFs in Queensland and
more than one plant species. Common spring forage plants in- New South Wales. This further indicates that food resources are
cluded the nectar of the Lemon-scented gum (three sites), fruit relatively plentiful in residential Adelaide in spring.
of the Port Jackson fig (three sites) and the nectar of the Yellow Optimising foraging activities, and ultimately survival, is
box (Eucalyptus melliodora) (two sites). Other forage species contingent on an individual’s ability to locate and consume6 | Journal of Urban Ecology, 2021, Vol. 6, No. 1
Downloaded from https://academic.oup.com/jue/article/7/1/juaa034/6105788 by guest on 30 April 2021
Figure 2: Utilisation distribution (blue) and core and extended home-range estimates with confidence intervals for the period from 31 August 2015 and 2 November
2015. Core home-range (AKDE50) (left) and extended home-range (AKDE95) (right). Lighter contours represent confidence intervals and the grid lines provide a scale in
kilometres.
food at a rate sufficient to maintain physiological functions and from roost to foraging sites (Genzel et al. 2018) which was noted
improve fitness (Krebs 2009). Any change in the environment in our study.
that allows improved foraging efficiency, such as expansion of Our results suggest that GHFFs in Adelaide were feeding on
human-dominated urban development, is an opportunity to be species that are not native to South Australia but rather were
exploited. Frugivores and nectarivores like flying foxes and feeding on the same species found in their previous known geo-
birds can benefit from increased availability of resources in ur- graphic range (Queensland and New South Wales) or on exotic
ban areas (Nakamoto et al. 2007; Nakamoto et al. 2012; Wood species. This reflects studies of the Melbourne population of
and Esaian 2020). Food predictability in urban landscapes GHFFs where approximately 40% of feeding observations were
shapes foraging patterns (Egert-Berg et al. 2018), and the pre- in parks on exotic plant genera (McDonald-Madden et al. 2005).
dictability of the location of nectar and fruit resources empha- We found the most commonly visited foraging sites were on
sises the role played by spatial memory for guidance (Genzel streets where 100% of the foraging plants were not native to
et al. 2018), and allows for fidelity to the same foraging sites South Australia. Of the 201 species of recorded foraging plants
over multiple nights (Egert-Berg et al. 2018) or weeks (Korine for GHFFs (Williams et al. 2006), 133 have been planted within
et al. 1999). This is reflected in frequently used flight routes Adelaide, including 39 species exotic to Australia (MartinSpring foraging movements of flying foxes | 7
Downloaded from https://academic.oup.com/jue/article/7/1/juaa034/6105788 by guest on 30 April 2021
Figure 3: Map of pattern of revisitation for bat #403, from 3 September 2015 to 21 October 2015 (weeks 36–42 of 2015) from the Adelaide camp. Circles mark locations;
the warmer the colour of the circle is, the higher frequency of visitation. See Table 3 for GPS locations of the most visited foraging sites. The camp is represented by the
cross.
Figure 4: Foraging activity histogram for GHFF, bat #403 from 3 September 2015 to 21 October 2015 (weeks 36–42 of 2015) including for comparison camp location and
most frequently visited sites including frequency, timing and duration of visitation.8 | Journal of Urban Ecology, 2021, Vol. 6, No. 1
Table 3: Ground-truthed plants associated with the most frequently visited foraging sites of GHFFs in Adelaide from 31 August 2015 to 2
November 2015 inferred from GPS locations.
Bat ID# Site ID Longitude Latitude Type Forage plants
403 1 34.9045 138.5077 Private Corymbia citriodora Eucalyptus sideroxylon
403 2 34.9065 138.5092 Private Callistemon sp
403 3 34.9233 138.5190 Street Ficus rubiginosa Eucalyptus camaldulensis
403 4 34.9169 138.6118 Park Ficus macrophylla Corymbia maculata Podocarpus elatus Eucalyptus grandis
a b
403 34.9210 138.5228 Street Phoenix canariensis
a
657 34.9169 138.6118 Park Ficus macrophylla Corymbia maculata Podocarpus elatus Eucalyptus grandis
657 5 34.9338 138.6496 Private N/A
a
657 6 34.9295 138.6443 Street Olea europaea Eucalyptus sideroxylon
657 7 34.9323 138.6466 Private Eucalyptus melliodora
657 8 34.9264 138.6539 Street Lophostemon confertus Eucalyptus sideroxylon
657 9 34.9247 138.6512 Street Corymbia citriodora
Downloaded from https://academic.oup.com/jue/article/7/1/juaa034/6105788 by guest on 30 April 2021
588 10 34.8591 138.5343 Park Ficus rubiginosa
588 11 34.8611 138.5321 Street N/A
588 12 34.9176 138.5902 Park Eucalyptus melliodora Eucalyptus camaldulensis Eucalyptus cladocalyx
588 13 34.9052 138.5830 Street Corymbia citriodora Eucalyptus salmonophloia
588 14 34.9564 138.6499 Park Ficus rubiginosa
Only trees accessed and identified are listed. Land type categories are determined by the location of the base of the tree. ‘Park’ includes public spaces, sporting fields,
schools, parks and foreshore. ‘Street’ includes residential curb-side streets, road frontage, median strip, or transport corridor screens. ‘Private’ includes privately owned
trees in domestic gardens, business premises or restricted-access areas. Bold type indicates plants known to flower or grow fruit during spring. .
N/A, access to identify trees was not possible.
a
These data could not be captured in foraging activity histograms.
b
Exotic to Australia.
O’Leary pers. comm. February 2020). Only 16 species recorded in as an aborted dispersion attempt (Adam McKeown, pers.
the diet of GHFFs are found naturally in Adelaide and these do comm).
not flower or fruit in spring when this study was conducted.
Hence the dependence of this population on introduced and ex-
Conclusion
otic tree species during this study. By comparison in Victoria,
Australia, Williams et al. (2006) found that 87 plant species that GHFFs ranged and foraged on introduced plants across the
provide food for GHFFs have been planted in Melbourne, as Adelaide metropolitan area during spring 2015. The planting of
compared to only 13 naturally occurring species. street trees, in particular, provided foraging resources for the
The two most common tree species frequented by GHFFs in tracked individuals and likely for the camp as a whole. The es-
this study were Port Jackson fig and Lemon-scented gum tablishment of urban camps of the GHFF raises numerous ques-
(Table 3). The Port Jackson fig, native to the eastern coastal for- tions about their adaptive ecology and their potential to interact
with human populations—most notably, during heat stress
ests of Queensland and northern New South Wales (Boland
events or when individual bats stray into high-risk environ-
et al. 2006), is a frequently used as a food source by GHFFs else-
ments such as the flight paths around Adelaide airport. Further
where (Williams et al. 2006; Schmelitschek et al. 2009). Foraging
and extended satellite or GPS telemetry investigations would
sites of this species in Adelaide occurred in parks and a school
provide further insights into the fine-scale movement ecology
grounds and were visited repeatedly. The natural distribution of
of this nationally important camp of flying foxes.
the Lemon-scented gum is eastern Queensland (Brooker and
Kleinig 2012) and is often planted in Adelaide as a municipal
street tree. This species flowers from June to November (Boland Supplementary data
et al. 2006). Lesser used species such as the Yellow box occur Supplementary data are available at JUECOL online.
naturally along the east coast of Australia from southern
Queensland to northern Victoria (Brooker and Kleinig 2012).
Acknowledgements
Yellow box is a common component of GHFF diet (Williams
et al. 2006) and flowers from September to December (Boland We thank Martin O’Leary from the State Herbarium of South
et al. 2006), making it available as a foraging source in early Australia with assistance in identifying foraging plants and
spring in Adelaide. GPS data revealed individuals visited known Dr Andrew Carter from the Australian Wildlife Conservancy
water sources in the Adelaide Botanic Gardens and wide areas with mapping expertise. We thank Dr Ian Smith of Zoos SA
of the River Torrens close to the camp, as well as suburban and staff of the Adelaide Zoo Animal Health Centre, Dr Celia
drainage ponds, an artificial quarry dam and the sea. We pre- Dickason, Biosecurity SA, staff at the School of Animal and
sumed that bats were dipping or drinking on these occasions Veterinary Sciences, Dr Annette Scanlon, Guy Bottroff,
but the case of the movement over the sea could be considered Denis Matthews, Gary Crameri, Simon Owler and studentsSpring foraging movements of flying foxes | 9
of the School of Animal and Veterinary Sciences, University Fleming, C. H. et al. (2014) ‘From Fine-Scale Foraging to Home
of Adelaide for assistance with capture, data collection, Ranges: A Semi-Variance Approach to Identifying Movement
resources and support. Modes across Spatiotemporal Scales’, The American Naturalist,
183: e154–e167.
et al. (2015) ‘Rigorous Home Range Estimation with
Funding Movement Data: A New Autocorrelated Kernel Density
This research was funded by the University of Adelaide PhD Estimator’, Ecology, 96: 1182–8.
stipend. Genzel, D., Yovel, Y., and Yartsev, M. M. (2018) ‘Neuroethology of
Bat Navigation’, Current Biology , 28: R997–1004.
Griffith, P., Parry-Jones, K., and Cunningham, A. A. (2020)
Data availability ‘Dietary Partitioning in Newly Sympatric Urban Flying-Foxes
(Pteropus Poliocephalus and Pteropus Alecto)’, Australian
The datasets generated analyzed during the current study
Mammalogy, 42: 361–6.
are available in the Movebank Data Repository, https://doi.
Jonsson, N. N. et al. (2004) ‘Field Anaesthesia of Three
org/10.5441/001/1.5bd6pq55 (Boardman and Roshier 2020).
Australian Species of Flying Fox’, Veterinary Record, 154: 664.
Downloaded from https://academic.oup.com/jue/article/7/1/juaa034/6105788 by guest on 30 April 2021
Conflict of interest statement. None declared. Jurdak, R. et al. (2013) ‘Camazotz: Multimodal Activity-based GPS
Sampling’ in Proceedings of The International Conference on
Information Processing in Sensor Networks, pp. 67–78
References Kessler, M. K. et al. (2018) ‘Changing Resource Landscapes and
Akaike, H. (1973) ‘Information Theory and an Extension of the Spillover of Henipaviruses’, Annals of the New York Academy of
Maximum Likelihood Principle’ in B. N., Petrov and F., Csaki Sciences, 1429: 78–99.
(eds.) Proceedings of the 2nd International Symposium on Korine, C., Izhaki, I., and Arad, Z. (1999) ‘Is the Egyptian Fruit-Bat
Information Theory, pp. 267–281. Budapest: Akademiai Kiado. Rousettus Aegyptiacus a Pest in Israel? an Analysis of the Bat’s
(1974) ‘A New Look at the Statistical Model Identification’, Diet and Implications for Its Conservation’, Biological
IEEE Transactions on Automatic Control, 19: 716–23. Conservation, 88: 301–306.
Bander, R., and Cochran, W. (1991) ‘Radio-Location Telemetry’ in Kranstauber, B. et al. (2011) ‘The Movebank Data Model for
Wildlife Management Techniques. Washington DC, USA: Wildlife Animal Tracking’, Environmental Modelling & Software, 26:
Society. 834–835.
Boardman, W. S. J. et al. (2020) ‘Seroprevalence of Three Krebs, C. J. (2009) Ecology, the Experimental Analysis of Distribution
Paramyxoviruses; Hendra Virus, Tioman Virus, Cedar Virus and Abundance, 6th ed. San Franscisco: Pearson Benjamin
and a Rhabdovirus, Australian Bat Lyssavirus, in a Range Cummings.
Expanding Fruit Bat, the Grey-Headed Flying Fox (Pteropus Lewin-Koh, N. J. et al. (2011) ‘maptools: Tools for Reading and
Handling Spatial Objects’ R Package Version 0.8-10.
Poliocephalus)’, Plos One, 15: e0232339.
Lowry, H., Lill, A., and Wong, B. B. M. (2013) ‘Behavioural
, and Roshier, D. (2020) ‘Data from: Spring Foraging
Responses of Wildlife to Urban Environments’, Biological
Movements of an Urban Population of Grey-Headed Flying
Reviews, 88: 537–549.
Foxes (Pteropus Poliocephalus)’, Movebank Data Repository,
Markus, N., and Hall, L. (2004) ‘Foraging Behaviour of the Black
https://doi.org/10.5441/001/1.5bd6pq55.
Flying-Fox (Pteropus Alecto) in the Urban Landscape of
Boland, D. J. et al. (2006). Forest Trees of Australia, 5th ed.
Brisbane, Queensland’, Wildlife Research, 31: 345–355.
Canberra, Australia: CSIRO Publishing.
McDonald-Madden, E. et al. (2005) ‘Factors Affecting
Bracis, C., Bildstein, K. L., and Mueller, T. (2018) ‘Revisitation
Grey-Headed Flying-Fox (Pteropus Poliocephalus: Pteropodidae)
Analysis Uncovers Spatio-Temporal Patterns in Animal
Foraging in the Melbourne Metropolitan Area, Australia’,
Movement Data’, Ecography, 41: 1801–11.
Austral Ecology, 30: 600–8.
Breed, A. C. et al. (2010) ‘Bats without Borders: Long Distance
McFarlane, R. A. (2015) ‘Health of People, Places and Planet’.
Movements and Implications for Disease Risk Management’,
Canberra, Australia: ANU Press.
EcoHealth, 7: 204–12.
Misra, P., Burke, B. P., and Pratt, M. (1999) ‘GPS Performance in
Brooker, I., and Kleinig, D. (2012) Eucalyptus. An Illustrated Guide to
Navigation’ Proceedings of the IEEE, 87: 65–85.
Identification. Sydney, Australia: Reed New Holland. Nakamoto, A., Kinjo, K., and Izawa, M. (2007) ‘Food Habits of
Calabrese, J. M., Fleming, C. H., and Gurarie, E. (2016) ‘Ctmm: An Orii’s Flying-Fox, Pteropus Dasymallus, in Relation to
R Package for Analyzing Animal Relocation Data as a Food Availability in an Urban Area of Okinawa-Jima Island,
Continuous-Time Stochastic Process’, Methods in Ecology and the Ryukyu Archipelago, Japan’, Acta Chiropterologica, 9:
Evolution, 7: 1124–32. 237–249.
Choden, K. et al. (2019) ‘Pteropus Lylei Primarily Forages in , , and (2012) ‘Ranging Patterns and Habitat Use
Residential Areas in Kandal, Cambodia’, Ecology and Evolution, of a Solitary Flying Fox (Pteropus Dasymallus) on Okinawa-Jima
9: 4181–91. Island, Japan’, Acta Chiropterologica, 14: 387–399.
Contesse, P. et al. (2004) ‘The Diet of Urban Foxes (Vulpes vulpes) Noonan, M. J. et al. (2019) ‘A Comprehensive Analysis of
and the Availability of Anthropogenic Food in the City of Autocorrelation and Bias in Home Range Estimation’, Ecological
Zurich, Switzerland’, Mammalian Biology, 69: 81–95. Monographs, 89: e01344.
Eby, P. (1991) ‘Seasonal Movements of Grey-Headed Oleksy, R. Z. et al. (2019) ‘The Movement Ecology of the
Flying-Foxes, Pteropus Poliocephalus (Chiroptera: Pteropodidae), Mauritian Flying Fox (Pteropus niger): A Long-Term Study Using
from Two Maternity Roosts in Northern New South Wales’, Solar-Powered GSM/GPS Tags’, Movement Ecology, 7: 12.
Wildlife Research, 18: 547–59. Palmer, C., Price, O., and Bach, C. (2000) ‘Foraging Ecology of the
Egert-Berg, K. et al. (2018) ‘Resource Ephemerality Drives Social Black Flying Fox (Pteropus Alecto) in the Seasonal Tropics of the
Foraging in Bats’, Current Biology, 28: 3667–73. Northern Territory, Australia’, Wildlife Research, 27: 169–178.10 | Journal of Urban Ecology, 2021, Vol. 6, No. 1
Parris, K. M., and Hazell, D. L. (2005) ‘Biotic Effects of Climate , and Nelson, J. (2004) ‘Long-Distance Movements of the
Change in Urban Environments: The Case of the Grey-Headed Grey-Headed Flying Fox (Pteropus Poliocephalus)’, Journal of
Flying-Fox (Pteropus Poliocephalus) in Melbourne, Australia’, Zoology, 263: 141–6.
Biological Conservation, 124: 267–276. Threatened Species Scientific Committee (2001). Commonwealth
Parry-Jones, K. A., and Augee, M. L. (1991) ‘Food Selection by Listing Advice on Pteropus poliocephalus (Grey-headed
Grey-Headed Flying Foxes (Pteropus Poliocephalus) Occupying a Flying-fox). . accessed 6 July
Research, 18: 111–124. 2020. In effect under the EPBC Act from 06-Dec-2001.
R Core Team. (2019). R: A language and environment for statisti- Threlfall, C. G. et al. (2013) ‘Roost Selection in Suburban
cal computing. Bushland by the Urban Sensitive Bat Nyctophilus Gouldi’, Journal
Commonwealth of Australia, Referral guideline for management of Mammalogy, 94: 307–319.
actions in Grey-headed and Spectacled flying-fox camps, van der Ree, R. et al. (2006) ‘The Establishment and Dynamics of
Commonwealth of Australia 2015. accessed 6 Zoology, 268: 177–185.
Downloaded from https://academic.oup.com/jue/article/7/1/juaa034/6105788 by guest on 30 April 2021
July 2020. In effect under the EPBC Act from 06-Dec-2001. Webb, N. J., and Tidemann, C. R. (1996) ‘Mobility of Australian
Roberts, B. J. et al. (2012) ‘Long Distance and Frequent Flying Foxes, Pteropus Spp. (Megachiroptera): Evidence from
Movements of the Flying-Fox Pteropus Poliocephalus: Genetic Variation’, Proceedings. Biological Sciences, 263: 497–502.
Implications for Management’, Plos One, 7: e42532. Westcott, D. A. et al. (2015) ‘The status and trends of Australia’s
Schmelitschek, E., French, K., and Parry-Jones, K. (2009) ‘Fruit EPBC-Listed flying-foxes’, Technical Report CSIRO, Australia,
Availability and Utilisation by Grey Headed Flying Foxes .
Australia’, Wildlife Research, 36: 592–600. Williams, N. S. G. et al. (2006) ‘Range Expansion Due to
Smith, C. S. et al. (2011) ‘Satellite Telemetry and Long-Range Bat Urbanization: Increased Food Resources Attract Grey-Headed
Movements’, Plos One, 6: e14696. Flying-Foxes (Pteropus Poliocephalus) to Melbourne’, Austral
Spencer, H. J., Palmer, C., and Parry-Jones, K. (1991) ‘Movements Ecology, 31: 190–198.
of Fruit-Bats in Eastern Australia, Determined by Using Woinarski, J. C. Z., and Burbidge, A. A., Harrison, P. (2014) The
Radio-Tracking’, Wildlife Research, 18: 463–468. Action Plan for Australian Mammals 2012, Collingwood,
Tidemann, C. R. (1999) ‘The Biology and Management of the Grey Australia: CSIRO Publishing.
Headed Flying Fox, Pteropus Poliocephalus’, Acta Chiropterologica, Wood, E. M., and Esaian, S. (2020) ‘The Importance of Street
1: 151–164. Trees to Urban Avifauna’, Ecological Applications, 30: e02149.You can also read