Reply to: Caution over the use of ecological big data for conservation
←
→
Page content transcription
If your browser does not render page correctly, please read the page content below
Matters arising

Reply to: Caution over the use of ecological
big data for conservation

https://doi.org/10.1038/s41586-021-03464-9                Nuno Queiroz1,2, Nicolas E. Humphries2, Ana Couto1, Marisa Vedor1,3, Ivo da Costa1,
                                                          Ana M. M. Sequeira4,5, Gonzalo Mucientes1, António M. Santos1,3, Francisco J. Abascal6,
Published online: 7 July 2021
                                                          Debra L. Abercrombie7, Katya Abrantes8, David Acuña-Marrero9, André S. Afonso10,11,
    Check for updates                                     Pedro Afonso12,13,14, Darrell Anders15, Gonzalo Araujo16, Randall Arauz17,18,19, Pascal Bach20,
                                                          Adam Barnett8, Diego Bernal21, Michael L. Berumen22, Sandra Bessudo Lion19,23,
                                                          Natalia P. A. Bezerra10, Antonin V. Blaison20, Barbara A. Block24, Mark E. Bond25,
                                                          Ramon Bonfil26, Camrin D. Braun27,28, Edward J. Brooks29, Annabelle Brooks29,30,
                                                          Judith Brown31, Michael E. Byrne32,33, Steven E. Campana34, Aaron B. Carlisle35,
                                                          Demian D. Chapman25, Taylor K. Chapple24,108, John Chisholm36, Christopher R. Clarke37,
                                                          Eric G. Clua38, Jesse E. M. Cochran22, Estelle C. Crochelet39,40, Laurent Dagorn20,
                                                          Ryan Daly41,42, Daniel Devia Cortés43, Thomas K. Doyle44,45, Michael Drew46,
                                                          Clinton A. J. Duffy47, Thor Erikson48, Eduardo Espinoza19,49, Luciana C. Ferreira50,
                                                          Francesco Ferretti51, John D. Filmalter20,42, G. Chris Fischer52, Richard Fitzpatrick8,
                                                          Jorge Fontes12,13,14, Fabien Forget20, Mark Fowler53, Malcolm P. Francis54,
                                                          Austin J. Gallagher55,56, Enrico Gennari42,57,58, Simon D. Goldsworthy59, Matthew J. Gollock60,
                                                          Jonathan R. Green61, Johan A. Gustafson62, Tristan L. Guttridge63, Hector M. Guzman64,
                                                          Neil Hammerschlag56,65, Luke Harman44, Fábio H. V. Hazin10, Matthew Heard46,
                                                          Alex R. Hearn19,66,67, John C. Holdsworth68, Bonnie J. Holmes69,109, Lucy A. Howey70,
                                                          Mauricio Hoyos19,71, Robert E. Hueter72, Nigel E. Hussey73, Charlie Huveneers46,
                                                          Dylan T. Irion74, David M. P. Jacoby75, Oliver J. D. Jewell76,77, Ryan Johnson78,
                                                          Lance K. B. Jordan70, Warren Joyce53, Clare A. Keating Daly41, James T. Ketchum19,71,
                                                          A. Peter Klimley19,79, Alison A. Kock42,80,81,82, Pieter Koen83, Felipe Ladino23,
                                                          Fernanda O. Lana10,84, James S. E. Lea37,85, Fiona Llewellyn60, Warrick S. Lyon54,
                                                          Anna MacDonnell53, Bruno C. L. Macena10,13, Heather Marshall21,86, Jaime D. McAllister87,
                                                          Michael A. Meÿer15, John J. Morris72, Emily R. Nelson56, Yannis P. Papastamatiou25,
                                                          Cesar Peñaherrera-Palma19,88, Simon J. Pierce89, Francois Poisson20, Lina Maria Quintero23,
                                                          Andrew J. Richardson90, Paul J. Rogers59, Christoph A. Rohner89, David R. L. Rowat91,
                                                          Melita Samoilys92, Jayson M. Semmens87, Marcus Sheaves8, George Shillinger19,24,93,
                                                          Mahmood Shivji32, Sarika Singh15, Gregory B. Skomal36, Malcolm J. Smale94,
                                                          Laurenne B. Snyders15, German Soler19,23,87, Marc Soria20, Kilian M. Stehfest87,
                                                          Simon R. Thorrold28, Mariana T. Tolotti20, Alison Towner58,77, Paulo Travassos10,
                                                          John P. Tyminski72, Frederic Vandeperre12,13,14, Jeremy J. Vaudo32, Yuuki Y. Watanabe95,96,
                                                          Sam B. Weber97, Bradley M. Wetherbee32,98, Timothy D. White24, Sean Williams29,
                                                          Patricia M. Zárate19,99, Robert Harcourt100, Graeme C. Hays101, Mark G. Meekan50,
                                                          Michele Thums50, Xabier Irigoien102,103, Victor M. Eguiluz104, Carlos M. Duarte22,
                                                          Lara L. Sousa2,105, Samantha J. Simpson2,106, Emily J. Southall2 & David W. Sims2,106,107 ✉

                                                          replying to A. V. Harry & J. M. Braccini Nature https://doi.org/10.1038/s41586-021-03463-w
                                                          (2021)

Our global analysis1 estimated the overlap and fishing exposure risk              in our previously published paper1 that gear reclassifications were likely
(FEI) using the space use of satellite-tracked sharks and longline fishing        to occur for a small percentage of the more than 70,000 vessels studied,
effort monitored by the automatic identification system (AIS). In the             however, here we demonstrate that even using much larger numbers
accompanying Comment, Harry and Braccini2 draw attention to two                   of vessel reclassifications than those proposed by Harry and Braccini2,
localized shark–longline vessel overlap hotspots in Australian waters,            the central results and conclusions of our paper1 do not change.
stating that 47 fishing vessels were misclassified as longline and purse             In our use of a third-party dataset such as GFW3, we stated clearly1
seine vessels in the Global Fishing Watch (GFW)3 2012–2016 AIS fishing            that the dataset is undergoing continuous refinement to correct for
effort data product that we used. This, they propose2, results in misi-           acknowledged contamination of some gear types with others in some
dentifications that highlight fishing exposure hotspots that are subject          regions (for example, drifting longlines with bottom-set longlines off
to an unexpected level of sensitivity in the analysis and they suggest            New Zealand1). The characterization of GFW vessels (gear) is under-
that misidentifications could broadly affect the calculations of fishing          taken using two convolutional neural networks that were trained3
exposure and the central conclusions of our study1. We acknowledged               on 45,441 marine vessels (fishing and non-fishing) that identified six

A list of affiliations appears at the end of the paper.

E20 | Nature | Vol 595 | 8 July 2021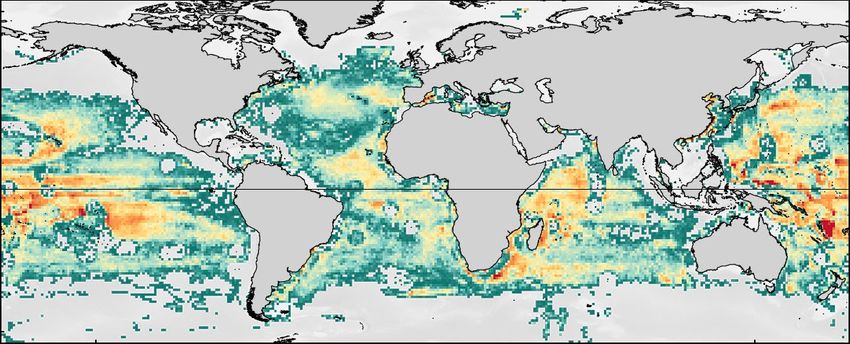
a b
Number of days fishing FEI
1 1,886 3.2 × 10⁻⁷ 1.0 × 100
c d
Number of days fishing FEI
1 457 2.2 × 10⁻⁶ 1.0 × 100
e f
Number of days fishing FEI
1 501 5.4 × 10⁻⁷ 1.0 × 100
g h
Number of days fishing FEI
1 939 4.9 × 10⁻⁷ 1.0 × 100
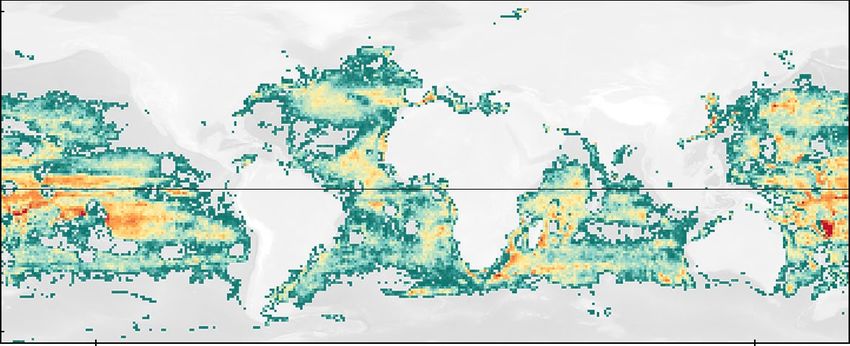
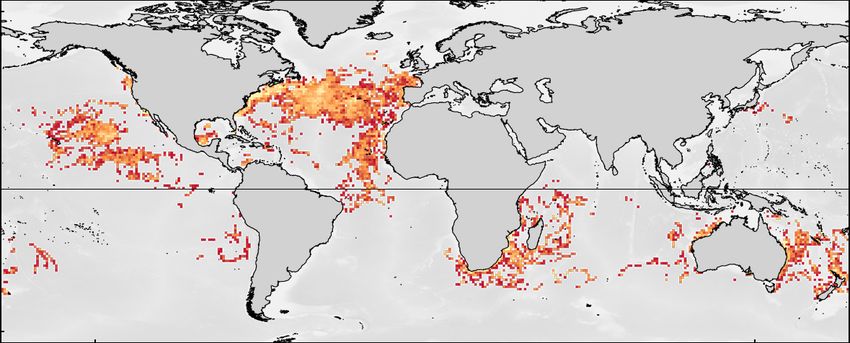
Fig. 1 | Comparing AIS longline fishing datasets. a–h, Comparison of GFW the new data releases of GFW fishing effort for 2012–2016 (c, d), 2012–2018 (e, f)
data of AIS longline fishing effort (a, c, e, g; fishing days, where 1 day = 24 h and 2018 only (g, h). These analyses show minor global differences across the
fishing effort) and spatial overlap intensity (FEI) with pelagic sharks (b, d, f, h) datasets even in the light of improvements in gear characterization algorithms
for three GFW datasets of longline fishing effort and Queiroz et al.1. The and further verification with additional fishing vessel metadata.
original 2012–2016 AIS longline fishing effort and FEI (a, b) was compared with
classes of fishing vessels and six classes of non-fishing vessels with refine models to estimate this information, as was the case for most of
95% accuracy, as stated in our paper1. It is inevitable, therefore, that for the vessels that we analysed. For countries that have not adopted this
some of the more than 70,000 AIS-monitored fishing vessels analysed, practice, including Australia, models provide necessary estimates in
the gear was misclassified. Fortunately, a growing number of nations lieu of official information.
now maintain publicly accessible, online vessel registries to promote Since the publication of our paper1 there have been further improve-
transparency and science within the fishing sector. For example, the ments, including the recent data of AIS longline fishing effort for 2018
European Union (EU) releases identifying information (including vessel with updated gear assignments based on convolutional neural networks
name, identification numbers and fishing gear) for all fishing vessels and data for more vessels. Mapping the new data (Fig. 1) shows that,
registered to any EU country4. This eliminates the need to develop and indeed, the fishing effort by 12 vessels in Australia’s Northwest Shelf
Nature | Vol 595 | 8 July 2021 | E21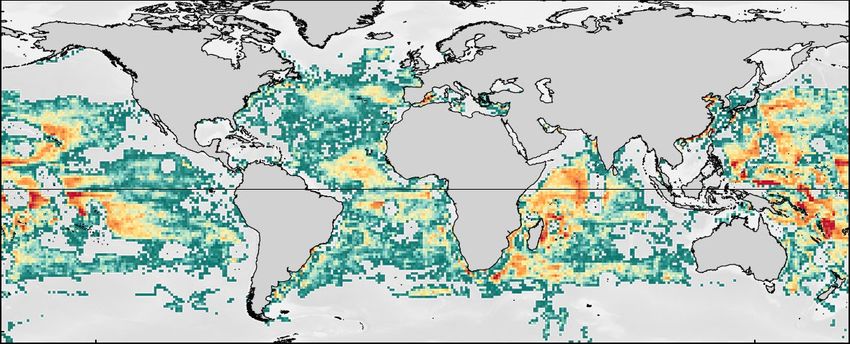
Matters arising
a 100 b c
75
50 100 100 100 100 100 100 100 100 100 100 100 100 100 100 100
CCA
25
PGL
CLE
100
34 34
75 60
74 76 84
100 100 100 100 100 92 92 92 92
50
Randomization (%)
66 66
CCA
25
PGL
40
IOX
26 24 16
100
17 17 17
75 50 50 51 60
75 41 41 41 45 49
84 84 84 84 92
50
33 33 32
GCU
25 32
LNA
42 42 42 42 42
IOX
16 16 16 16 17 17 17 25
100 15 15 15 16
25
42
75 57 58 65 65 42 42 35 35 41 41
66 43 34 25
50 16
19 18
GCU
CCA
25 51 51 50 50 50 50 50 50
CFA
42 42
24 24 24 24 23
1 5 25 50 75 1 5 25 50 75 1 5 25 50 75
Random deletion (%) Random deletion (%) Random deletion (%)
d 100
16
e
33 33 26 33 33 33 27 26
75
80
50 56 66 56
50 50 50 50 49 55
GCU
GCU
25
17 17 18 18 18 17 17 18 18 18
100
36 36
75 47
61 61 61 61 61 61
62
50 35
Randomization (%)
53
45
CCA
CCA
25 31 31 34 39 38 31 31
29
100
17
75
50 84 84 84 91 84 84 89
87 88 82
25
IOX
IOX
100
23 23 26 31 32 23 23 25 32 32
75
50 52 52 51 52 52 53
55 59 55 55
25
PGL
PGL
25 25 23 25 25 22
1 5 25 50 75 1 5 25 50 75
Random deletion (%) Random deletion (%)
Fig. 2 | Example effects of random deletions of fishing effort data on shark (Carcharhinus leucas); GCU, tiger shark (Galeocerdo cuvier); IOX, shortfin
exposure risk patterns. a–e, The percentage of randomized deletions from mako shark (Isurus oxyrinchus); LNA, porbeagle shark (Lamna nasus); PGL, blue
100 repeats that resulted in a species exposure risk estimate occurring within shark (Prionace glauca). Overall, only 6 out of 36 species–region combinations
the high (red), moderate (yellow) or low (green) risk category at each level of (16.7%) showed significant differences in the proportion of 100 randomizations
deletion (1%, 5%, 25%, 50% or 75%) of fishing effort grid cells per sub-region. per combination that each resulted in exposure risk falling within higher,
a, North Atlantic. b, Eastern Pacific Ocean. c, Southwest Indian Ocean. moderate and lower risk categories when comparing 1% and 75% of random
d, Northwest Oceania. e, Eastern Oceania. The map that shows the locations deletions of fishing effort data. Detailed summaries are provided in
of sub-regions is provided in Supplementary Fig. 1. CCA, white shark Supplementary Tables 1–7.
(Carcharodon carcharias); CFA, silky shark (Carcharhinus falciformis); CLE, bull
(NWS) is now removed, indicating that these few longline and purse fishing effort in that area based on the GFW 2012–2016 data product
seine vessels were not classified accurately in the GFW 2012–2016 data that we used. Therefore, an important question raised2 is whether the
product. However, the GFW 2018 product does not show the reclassifi- reclassification of the gear types of 47 vessels directly affects the cal-
cations proposed off the southern Great Barrier Reef (GBR); therefore, culations of fishing exposure and our conclusions. In our paper1, the
further verifications are needed to correct those. area (at the 1° × 1° grid cell scale) covered by AIS longline fishing effort
We agree that the space use hotspot for tiger shark (Galeocerdo in Western Australia is 0.4% of the global coverage and the southern
cuvier) in Australia’s NWS does not overlap with AIS-monitored longline GBR area represents only 0.06%. Within the Oceania region used in our
E22 | Nature | Vol 595 | 8 July 2021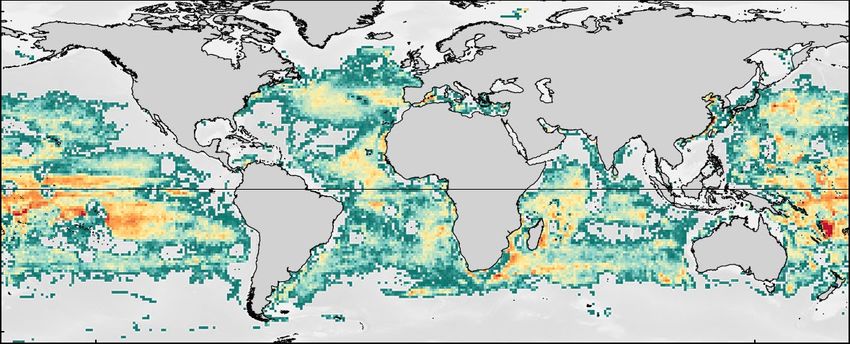
paper, Western Australia comprises 2.2% and GBR 0.35%. Therefore, the         the GFW dataset are useful, we disagree with Harry and Braccini2 about
areas comprising reclassifications provide a minor contribution to the        the levels of fishing threatening large sharks in Australia’s NWS where
spatial overlap and FEI values that we calculated not only globally but       we identified the space use hotspot for tiger sharks. They incorrectly
also within the Oceania region.                                               assert that longline fishing has not occurred for two decades in Aus-
   To check our results within the global context, we compared the spa-       tralia’s NWS2. Longline and gillnet fishing not only occurred historically
tial overlap of sharks and longline fishing effort in our paper1 with the     in the NWS and offshore to the boundary of Australia’s EEZ5, but also
new releases of GFW fishing effort data that have been made available         continues to occur there through illegal, unreported and unregulated
since the publication of our paper (Fig. 1 and Extended Data Table 1).        fishing6–8 by vessels that are not equipped with or that do not use AIS,
The new releases of GFW data take into account refinements in the             which we discussed in our paper1. Illegal, unreported and unregulated
algorithms used to classify vessel (gear) types and new knowledge from        fishers are known to target sharks—including tiger sharks9—for fins,
metadata on the gear of the vessels. We find that—globally—the GFW            an ongoing threat that has been a major problem in Australia’s NWS7,
longline fishing patterns remain almost identical (Fig. 1). Spatial overlap   which overlaps with the tiger shark hotspot8. Therefore, it cannot be dis-
and exposure patterns also remain very similar. For example, the mean         counted that the shark hotspot overlaps with non-AIS monitored fishing
monthly spatial overlap estimate for all oceans of 24% presented in           activity, especially as more than 0.5 million km2 of the NWS remains
our paper is within the range (19–29%) calculated using the new GFW           open to commercial shark fishing10. Furthermore, the 55-year-long
data (Extended Data Table 1). In the Exclusive Economic Zone (EEZ) of         shark control program along 1,760 km of coastal northeastern Australia
Australia, the number of FEI grid cells actually increased from 151 to 155    shows a long-term decline in the abundance of tiger sharks11,12; this is
between the original GFW data (2012–2016) and the updated 2012–2018           a region with movement and genetic connectivity with tiger sharks of
data, whereas in the EEZ of western Australia the number decreased            the NWS13. In our view, Harry and Braccini2 overlook existing threats to
from 50 to 37 grid cells between datasets. For Oceania (including Aus-        tiger sharks and other shark species from fishing in the NWS.
tralian shelf waters), the spatial overlap of 24% in our paper is within         As a consequence, we disagree with the opinion that existing
the 17–25% range estimated with newer GFW data. We also find that the         science-based management has been undermined by our results or
spatial overlap–FEI plots remain largely unchanged across the four GFW        conclusions. Rather, in our paper1 we highlighted specifically the need
datasets (Extended Data Fig. 1). Therefore, the NWS vessel reclassifica-      to incorporate tracking and other spatial data into scientific assess-
tions are minor and affect a single hotspot for tiger sharks.                 ments. However, this should not be misinterpreted as spatial data rep-
   To address the potential issue raised by Harry and Braccini2 that          resenting a regional management tool to replace assessments that rely
longline vessel reclassifications occur more broadly and may alter            on other types of data, such as time-series catch data. Indeed, a review14
results in substantial ways, we randomly deleted 1% of grid cells that        cited in our paper identifies examples in which marine animal tracking
contained longline fishing effort per ocean region to simulate reclas-        and space use data informed policy, and it is evident that these data
sification of longline vessels to other gears and this randomization          were never used in isolation from existing management regimes or
was repeated 100 times. This is more extreme than simply removing a           complementary scientific assessments. Our paper1 emphasizes the
few individual vessels because each replicate removes 1% of grid cells,       need for a holistic approach to shark management that should also
each comprising summed fishing effort from single or multiple ves-            incorporate dynamic, spatial data.
sels. Extended Data Table 2 shows that of the 30 species–region pairs
available for analysis, we found that only 7% of species–region pairs
changed from highest (red) to moderate (yellow) fishing exposure risk,        Reporting summary
whereas 3% changed from moderate to highest risk after the simulated          Further information on experimental design is available in the Nature
‘reclassification’. We repeated this for 5% random deletions. Even at         Research Reporting Summary linked to this paper.
this much higher level of longline gear reclassification, we obtained
the same results (Extended Data Table 3).
   To examine what level of localized reclassification may lead to a          Data availability
breakdown of the fishing exposure risk patterns that we found, we             Data used to prepare the maps (shark relative spatial density,
randomly deleted 1%, 5%, 25%, 50% and 75% of fishing effort grid cells        longline-fishing effort and shark–longline-fishing overlap and FEI)
within five sub-regions (Supplementary Fig. 1) and recalculated spatial       are available on GitHub (https://github.com/GlobalSharkMovement/
overlap and FEI for four key species per sub-region (Fig. 2 and Supple-       GlobalSpatialRisk).
mentary Methods). Results reveal no change in patterns of overlap and
FEI for the four key species for the random deletion of up to 75% of data
for regions in which shark spatial densities and fishing effort were both     Code availability
high and spatially extensive (for example, the North Atlantic (Fig. 2a)).     Code used to prepare the maps (shark relative spatial density,
Patterns change marginally above deletion of 25% of data for some             longline-fishing effort and shark–longline-fishing overlap and FEI)
species in other sub-regions in which fewer vessels and sharks were           is available on GitHub (https://github.com/GlobalSharkMovement/
tracked (Fig. 2b, d). Seasonal patterns in exposure risk also remained        GlobalSpatialRisk).
largely unchanged albeit with larger differences at higher levels of
fishing effort deletions (Supplementary Fig. 2). Levels of inaccuracy
                                                                              1.   Queiroz, N. et al. Global spatial risk assessment of sharks under the footprint of fisheries.
as high as we simulated in these tests are not evident in worldwide                Nature 572, 461–466 (2019).
GFW vessel classifications3. Clearly, our results are not as sensitive to     2.   Harry, A., Braccini, M. Caution over the use of ecological big data for conservation. Nature
minor changes in sub-region vessel reclassifications as suggested by               https://doi.org/10.1038/s41586-021-03463-w (2021).
                                                                              3.   Kroodsma, D. A. et al. Tracking the global footprint of fisheries. Science 359, 904–908
Harry and Braccini2.                                                               (2018).
   Harry and Braccini2 emphasize that regional results should not be          4.   European Commission. European Union Fleet Register. version 1.0.8.8 https://webgate.
overlooked within a global-scale study. We agree, which is why we pro-             ec.europa.eu/fleet-europa/index_en (accessed 10 April 2020).
                                                                              5.   Stevens, J. D. Management of shark fisheries in Northern Australia. FAO Fisheries
vided region-specific results for individual species that were discussed           Technical Paper No. 378/2 http://www.fao.org/3/x2097e/X2097E20.htm#ch16 (FAO,
in detail in our paper1 (see supplementary results and discussion 2.6 of           1999).
                                                                              6.   Griffiths, S., Edgar, S., Wang, Y.-G. & Salini, J. Calculating recent foreign fishing vessel
ref. 1), in which each regional analysis was informed by regional experts
                                                                                   numbers using established estimators based on Coastwatch surveillance and
among the authorship, including for Western Australia. Although con-               apprehension data. Project Number 2007/836 (Australian Fisheries Management
tinued refinements to fishing gears ascribed to AIS-monitored vessels in           Authority 2008).

                                                                                                                            Nature | Vol 595 | 8 July 2021 | E23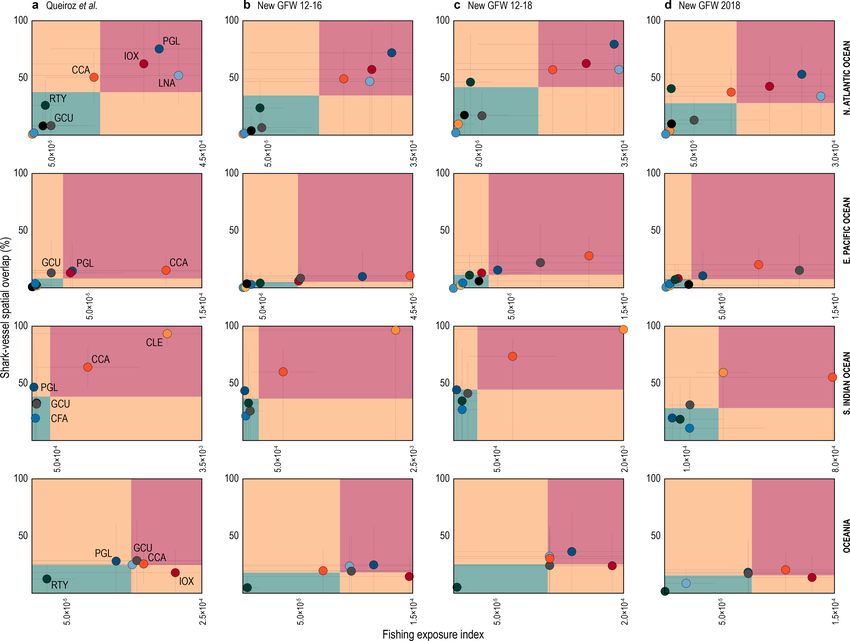
Matters arising
7. Field, I. C., Meekan, M. G., Buckworth, R. C. & Bradshaw, C. J. A. Protein mining the world’s Research and Conservation Program, Cape Eleuthera Institute, Eleuthera, Bahamas.
oceans: Australasia as an example of illegal expansion-and-displacement fishing. Fish 30
University of Exeter, Exeter, UK. 31South Atlantic Environmental Research Institute, Stanley,
Fish. 10, 323–328 (2009). Falkland Islands. 32Department of Biological Sciences, The Guy Harvey Research Institute,
8. Australian Fisheries Management Authority. Indonesian illegal fisher apprehended off Nova Southeastern University, Dania Beach, FL, USA. 33School of Natural Resources,
Darwin convicted. https://www.afma.gov.au/news-media/media-releases/
University of Missouri, Columbia, MO, USA. 34Life and Environmental Sciences, University of
indonesian-illegal-fisher-apprehended-darwin-convicted (Australian Border Force and
Iceland, Reykjavik, Iceland. 35School of Marine Science and Policy, University of Delaware,
Australian Fisheries Management Authority, 1 November 2019).
9. Marshall, L. The Fin Blue Line: quantifying Fishing Mortality using Shark Fin Morphology. Lewes, DE, USA. 36Massachusetts Division of Marine Fisheries, New Bedford, MA, USA.
PhD Thesis, Univ. of Tasmania (2011).
37
Marine Research Facility, Jeddah, Saudi Arabia. 38PSL, Labex CORAIL, CRIOBE USR3278
10. Braccini, M., Molony, B. & Blay, N. Patterns in abundance and size of sharks in EPHE-CNRS-UPVD, Papetoai, French Polynesia. 39Agence de Recherche pour la Biodiversité
northwestern Australia: cause for optimism. ICES J. Mar. Sci. 77, 72–82 (2020). à la Réunion (ARBRE), Réunion, Marseille, France. 40Institut de Recherche pour le
11. Roff, G., Brown, C. J., Priest, M. A. & Mumby, P. J. Decline of coastal apex shark populations Développement, UMR 228 ESPACE-DEV, Réunion, Marseille, France. 41Save Our Seas
over the past half century. Commun. Biol. 1, 223 (2018). Foundation–D’Arros Research Centre (SOSF-DRC), Geneva, Switzerland. 42South African
12. Ferreira, L. C. & Simpfendorfer, C. Galeocerdo cuvier. e.T39378A2913541 (The IUCN Red
Institute for Aquatic Biodiversity (SAIAB), Grahamstown, South Africa. 43Department of
List of Threatened Species, 2019).
Fisheries Evaluation, Fisheries Research Division, Instituto de Fomento Pesquero (IFOP),
13. Pirog, A. et al. Genetic population structure and demography of an apex predator, the
tiger shark Galeocerdo cuvier. Ecol. Evol. 9, 5551–5571 (2019). Valparaíso, Chile. 44School of Biological, Earth and Environmental Sciences, University
14. Hays, G. C. et al. Translating marine animal tracking data into conservation policy and College Cork, Cork, Ireland. 45MaREI Centre, Environmental Research Institute, University
management. Trends Ecol. Evol. 34, 459–473 (2019). College Cork, Cork, Ireland. 46College of Science and Engineering, Flinders University,
Adelaide, South Australia, Australia. 47Department of Conservation, Auckland, New Zealand.
48
South African Institute for Aquatic Biodiversity, Geological Sciences, UKZN, Durban,
Acknowledgements Funding support was provided by the Natural Environment Research
South Africa. 49Direccion Parque Nacional Galapagos, Puerto Ayora, Galapagos, Ecuador.
Council (NERC) (NE/R00997/X/1), European Research Council (ERC-AdG-2019 883583 OCEAN
DEOXYFISH) (D.W.S.), Australian Research Council (ARC DP210103091) (A.M.M.S. and D.W.S.),
50
Australian Institute of Marine Science, Indian Ocean Marine Research Centre (UWA),
Fundação para a Ciência e a Tecnologia CEECIND/02857/2018 (N.Q.), PTDC/BIA-COM/28855/2017 Crawley Western Australia, Crawley, Australia. 51Department of Fish and Wildlife
(M.V.) and a 2020 Pew Fellowship in Marine Conservation (A.M.M.S.). This research is part of the Conservation, Virginia Tech, Blacksburg, VA, USA. 52OCEARCH, Park City, Utah, USA.
Global Shark Movement Project (http://globalsharkmovement.org/). 53
Bedford Institute of Oceanography, Dartmouth, Nova Scotia, Canada. 54National Institute
of Water and Atmospheric Research, Wellington, New Zealand. 55Beneath the Waves,
Author contributions N.Q. and D.W.S. planned the data analysis. N.Q. led the data analysis with Herndon, VA, USA. 56Rosenstiel School of Marine and Atmospheric Science, University of
contributions from M.V. and D.W.S. N.E.H. contributed analysis tools. D.W.S. led the manuscript Miami, Miami, FL, USA. 57Oceans Research Institute, Mossel Bay, South Africa. 58Department
writing with contributions from N.Q., N.E.H. and all authors. Seven of the original authors were
of Ichthyology and Fisheries Science, Rhodes University, Grahamstown, South Africa.
not included in the Reply authorship; two authors retired from science and the remaining five, 59
SARDI Aquatic Sciences, Adelaide, South Australia, Australia. 60Zoological Society of
although supportive of our Reply, declined to join the authorship due to potential conflicts of
interest with the authors of the Comment and/or their institutions. London, London, UK. 61Galapagos Whale Shark Project, Puerto Ayora, Galapagos, Ecuador.
62
Griffith Centre for Coastal Management, Griffith University School of Engineering, Griffith
Competing interests The authors declare no competing interests. University, Gold Coast, Queensland, Australia. 63Saving the Blue, Cooper City, FL, USA.
64
Smithsonian Tropical Research Institute, Panama City, Panama. 65Leonard and Jayne
Additional information Abess Center for Ecosystem Science and Policy, University of Miami, Coral Gables, FL, USA.
Supplementary information The online version contains supplementary material available at 66
Galapagos Science Center, San Cristobal, Galapagos, Ecuador. 67Universidad San
https://doi.org/10.1038/s41586-021-03464-9. Francisco de Quito, Quito, Ecuador. 68Blue Water Marine Research, Tutukaka, New Zealand.
Correspondence and requests for materials should be addressed to D.W.S. 69
University of QueenslandBrisbane, Queensland, Australia. 70Microwave Telemetry,
Reprints and permissions information is available at http://www.nature.com/reprints.
Columbia, MD, USA. 71Pelagios-Kakunja, La Paz, Mexico. 72Mote Marine Laboratory, Center
Publisher’s note Springer Nature remains neutral with regard to jurisdictional claims in
published maps and institutional affiliations. for Shark Research, Sarasota, FL, USA. 73Biological Sciences, University of Windsor,
Windsor, Ontario, Canada. 74Cape Research and Diver Development, Simon’s Town, South
© The Author(s), under exclusive licence to Springer Nature Limited 2021 Africa. 75Institute of Zoology, Zoological Society of London, London, UK. 76Centre for
Sustainable Aquatic Ecosystems, Harry Butler Institute, Murdoch University, Perth, Western
Australia, Australia. 77Dyer Island Conservation Trust, Western Cape, South Africa. 78Blue
1
Centro de Investigação em Biodiversidade e Recursos Genéticos/Research Network in Wilderness Research Unit, Scottburgh, South Africa. 79University of California Davis, Davis,
Biodiversity and Evolutionary Biology, Campus Agrário de Vairão, Universidade do Porto, CA, USA. 80Cape Research Centre, South African National Parks, Steenberg, South Africa.
Vairão, Portugal. 2Marine Biological Association of the United Kingdom, Plymouth, UK.
81
Shark Spotters, Fish Hoek, South Africa. 82Institute for Communities and Wildlife in Africa,
3
Departamento de Biologia, Faculdade de Ciências da Universidade do Porto, Porto, Department of Biological Sciences, University of Cape Town, Rondebosch, South Africa.
Portugal. 4UWA Oceans Institute, Indian Ocean Marine Research Centre, University of
83
Western Cape Department of Agriculture, Veterinary Services, Elsenburg, South Africa.
Western Australia, Crawley, Western Australia, Australia. 5School of Biological Sciences,
84
Departamento de Biologia Marinha, Universidade Federal Fluminense (UFF), Niterói, Brazil.
University of Western Australia, Crawley, Western Australia, Australia. 6Spanish Institute of
85
Department of Zoology, University of Cambridge, Cambridge, UK. 86Atlantic White Shark
Oceanography, Santa Cruz de Tenerife, Spain. 7Abercrombie and Fish, Port Jefferson Conservancy, Chatham, MA, USA. 87Fisheries and Aquaculture Centre, Institute for Marine
Station, NY, USA. 8Marine Biology and Aquaculture Unit, College of Science and and Antarctic Studies, University of Tasmania, Hobart, Tasmania, Australia. 88Pontificia
Engineering, James Cook University, Cairns, Queensland, Australia. 9Institute of Natural and Universidad Católica del Ecuador Sede Manabi, Portoviejo, Ecuador. 89Marine Megafauna
Mathematical Sciences, Massey University, Palmerston North, New Zealand. 10Universidade Foundation, Truckee, CA, USA. 90Conservation and Fisheries Department, Ascension Island
Federal Rural de Pernambuco (UFRPE), Departamento de Pesca e Aquicultura, Recife, Brazil. Government, Georgetown, Ascension Island, UK. 91Marine Conservation Society Seychelles,
11
MARE, Marine and Environmental Sciences Centre, Instituto Politécnico de Leiria, Peniche, Victoria, Seychelles. 92CORDIO, East Africa, Mombasa, Kenya. 93Upwell, Monterey, CA, USA.
Portugal. 12MARE, Laboratório Marítimo da Guia, Faculdade de Ciências da Universidade de
94
Department of Zoology and Institute for Coastal and Marine Research, Nelson Mandela
Lisboa, Cascais, Portugal. 13Institute of Marine Research (IMAR), Departamento de University, Port Elizabeth, South Africa. 95National Institute of Polar Research, Tachikawa,
Oceanografia e Pescas, Universidade dos Açores, Horta, Portugal. 14Okeanos - Tokyo, Japan. 96SOKENDAI (The Graduate University for Advanced Studies), Tachikawa,
Departamento de Oceanografia e Pescas, Universidade dos Açores, Horta, Portugal. Tokyo, Japan. 97Centre for Ecology and Conservation, University of Exeter, Penryn, UK.
15
Department of Environmental Affairs, Oceans and Coasts Research, Cape Town, South
98
Department of Biological Sciences, University of Rhode Island, Kingston, RI, USA.
Africa. 16Large Marine Vertebrates Research Institute Philippines, Jagna, Philippines. 17Fins
99
Department of Oceanography and Environment, Fisheries Research Division, Instituto de
Attached Marine Research and Conservation, Colorado Springs, CO, USA. 18Programa Fomento Pesquero (IFOP), Valparaíso, Chile. 100Department of Biological Sciences,
Restauración de Tortugas Marinas PRETOMA, San José, Costa Rica. 19MigraMar, Olema, CA, Macquarie University, Sydney, New South Wales, Australia. 101School of Life and
USA. 20Institut de Recherche pour le Développement, UMR MARBEC (IRD, Ifremer, Univ. Environmental Sciences, Deakin University, Geelong, Victoria, Australia. 102AZTI - BRTA,
Montpellier, CNRS), Sète, France. 21Biology Department, University of Massachusetts Pasaia, Spain. 103IKERBASQUE, Basque Foundation for Science, Bilbao, Spain. 104Instituto de
Dartmouth, Dartmouth, MA, USA. 22Red Sea Research Center, Division of Biological and Fisica Interdisciplinar y Sistemas Complejos, Consejo Superior de Investigaciones
Environmental Science and Engineering, King Abdullah University of Science and Cientificas, University of the Balearic Islands, Palma de Mallorca, Spain. 105Wildlife
Technology, Thuwal, Saudi Arabia. 23Fundación Malpelo y Otros Ecosistemas Marinos, Conservation Research Unit, Department of Zoology, University of Oxford, Tubney, UK.
Bogota, Colombia. 24Hopkins Marine Station of Stanford University, Pacific Grove, CA, USA.
106
Ocean and Earth Science, National Oceanography Centre Southampton, University of
25
Department of Biological Sciences, Florida International University, North Miami, FL, USA. Southampton, Southampton, UK. 107Centre for Biological Sciences, University of
26
Instituto de Ciências do Mar, Universidade Federal do Ceará, Fortaleza, Brazil. 27School of Southampton, Southampton, UK. 108Present address: Hatfield Marine Science Center,
Fishery and Aquatic Sciences, University of Washington, Seattle, WA, USA. 28Biology Oregon State University, Newport, OR, USA. 109Present address: The University of the
Department, Woods Hole Oceanographic Institution, Woods Hole, MA, USA. 29Shark Sunshine Coast, Sippy Downs, Queensland, Australia. ✉e-mail: dws@mba.ac.uk
E24 | Nature | Vol 595 | 8 July 2021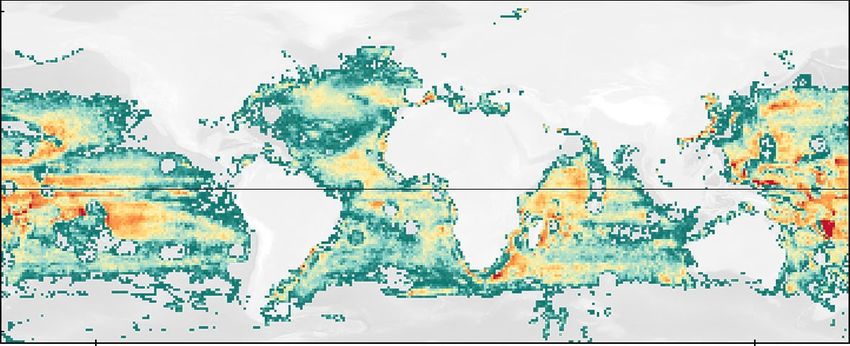
Extended Data Fig. 1 | Comparing shark exposure risk between AIS longline         The plots show minor effects of any changes on estimates of shark exposure
fishing effort datasets. a–d, Estimated exposure risk of sharks to capture by     risk from AIS longline fishing effort and confirm the global results and
GFW AIS longline fishing effort across ocean regions for Queiroz et al.1 (a)      conclusions of our paper. a, Data from Queiroz et al.1. b, Data from GWF
compared with three improved data releases since the paper was published (b–d).   2012–2016. c, Data from GWF 2012–2018. d, Data from GWF 2018.

                                                                                                                      Nature | Vol 595 | 8 July 2021 | E25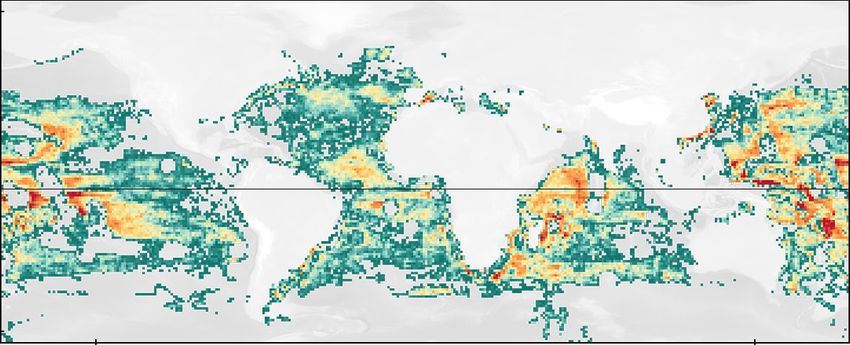
Matters arising
Extended Data Table 1 | Mean monthly spatial overlap estimates (%) of pelagic shark space use and AIS longline fishing effort
for different AIS datasets

E26 | Nature | Vol 595 | 8 July 2021
Extended Data Table 2 | Effect of 1% random deletion of fishing effort grid cells within each region on risk exposure estimates

The results show minor effects of substantial removal of longline fishing effort. Before/after denotes before/after deletion. Red denotes the highest risk exposure category, green indicates the
least risk. The ‘after’ colour represents the category with the highest percentage of occurrence after 100 randomizations. No change in colour between before/after indicates no change in
spatial overlap and exposure risk of species from AIS longline fishing effort. White indicates that no tracking data are available to undertake analysis. There are no changes from high to low, or
vice versa.

                                                                                                                                                  Nature | Vol 595 | 8 July 2021 | E27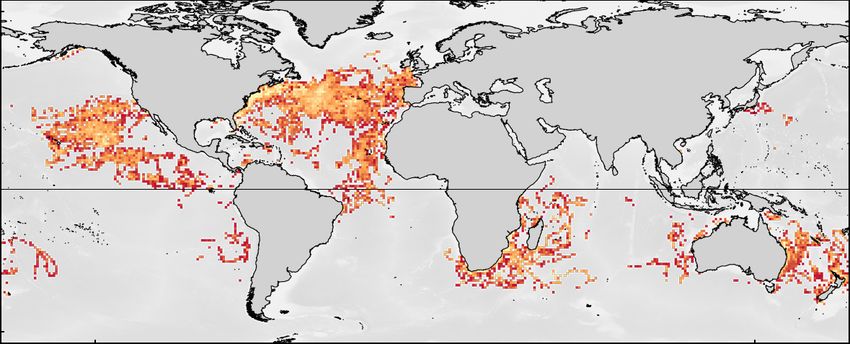
Matters arising
Extended Data Table 3 | Effect of 5% random deletion of fishing effort grid cells within each region on risk exposure
estimates

The results show minor effects of substantial removal of longline fishing effort. Before/after denotes before/after deletion. Red denotes the highest risk exposure category, green indicates the
least risk. The ‘after’ colour represents the category with the highest percentage of occurrence after 100 randomizations. No change in colour between before/after indicates no change in
spatial overlap and exposure risk of species from AIS longline fishing effort. White indicates that no tracking data are available to undertake analysis. There are no changes from high to low, or
vice versa.

E28 | Nature | Vol 595 | 8 July 2021
Matters arising

Caution over the use of ecological big data
for conservation

https://doi.org/10.1038/s41586-021-03463-w                      Alastair V. Harry1,2 ✉ & J. Matias Braccini1

Received: 6 November 2019
                                                                arising from N. Queiroz et al. Nature https://doi.org/10.1038/s41586-019-1444-4 (2019)
Accepted: 16 March 2021

Published online: 7 July 2021

    Check for updates

Highly collaborative and data-intensive ecology studies are at the fore-                        size of large sharks in the region6. Historically, the waters adjacent
front of innovative solutions to global issues in conservation and natural                      to the NWS shelf were indeed important fishing grounds for foreign
resource management1,2. In their spatial risk assessment of industrial-                         drifting longline vessels before their exclusion from Australian waters
ized fishing, Queiroz et al.3 use big data and collaborative science to                         in 19977, and for Australian vessels in the subsequent years8. Contem-
outline a global conservation blueprint for pelagic sharks. In Austral-                         porary longlining by a domestic tuna and billfish fishery still occurs,
ian waters, their analysis incorrectly identified global risk ‘hotspots’                        although these vessels were absent from the AIS data used by Queiroz
in areas that are not subject to fishing and where spatial closures and                         et al.3. Since 2005, the intensity of this fishery has decreased and its
other management measures are already in place to protect sharks.                               footprint shifted to the southwest9.
We highlight the potential for large-scale global analyses to misdirect                            The approach of Queiroz et al.3 fared better at the scale of the entire
conservation efforts if not aligned with regional needs and priorities.                         Australian Exclusive Economic Zone and offshore territories (10.2 mil-
   Although ecologists have enthusiastically adopted collaborative,                             lion km2), where the tuna and billfish longline fleet operating off east-
data-driven approaches in recent years, limited attention has been                              ern Australia was correctly classified (Fig. 1). However, 51% of drifting
given to the challenges in this emergent field, including the potential                         longline data were still incorrect (Table 1) and, notably, several demersal
for these often highly impactful studies to confound management and                             trawlers were also misclassified as being part of the longline fleet. Data
conservation actions4. We applaud the collaborative effort by Quei-                             from these vessels led to the incorrect identification of another pelagic
roz et al.3 in assimilating satellite tagging data on 1,800 large pelagic                       longline risk hotspot within the Great Barrier Reef Marine Park (Fig. 1),
and neritic sharks generated by 153 authors. However, we also caution                           where this fishing method is not permitted. In the case of both the
against the use of data-intensive methods for guiding policy at the                             NWS and Great Barrier Reef, the fishing exposure hotspots identified
global scale without proper acknowledgement of their risks, complexi-                           were due to fewer than five vessels being misclassified, highlighting a
ties and limitations.                                                                           presumably unexpected level of sensitivity in the analysis.
   In their paper, Queiroz et al.3 identify Australia’s North West Shelf                           As illustrated here, although patterns identified in global analy-
(NWS) as a global fishing exposure hotspot for sharks on the basis                              ses may be broadly informative, they can also be incorrect or misin-
of spatial overlap with purported drifting longline and purse seine                             formative at regional levels where there is the scope for misallocating
fishing vessel movements, despite no such fishing having occurred                               resources for conservation and management. Framed alternatively,
during the past two decades in this area. When we downscaled the
approach of Queiroz et al.3, we found errors in the data used to evalu-
ate fishing exposure in these waters that were derived using a machine                          Table 1 | Summary of machine-learning classified fishing
learning approach applied to vessel automatic identification system                             effort data
(AIS) location data5.
                                                                                                                                     Western Australia            Australia and offshore
   In Western Australian state waters—an area larger than the Bering
                                                                                                                                                                       territories
Sea—99.8% of longline and 100% of purse seine AIS data were incorrectly
                                                                                                Total area (million km2)                      2.27                           10.2
classified by the machine learning algorithm (Table 1 and Fig. 1). Incor-
rect classifications included movement data from other types of com-                            Gear type                          Longline      Purse seine      Longline      Purse seine
mercial fishing vessels as well as non-fishing vessels. For example, 95%                        Total classified vessels               11              3              76              15
of the data for purse seines in Western Australia waters were attributed                        Incorrectly classified                  9              3             24               11
to the movements of the research vessel of our agency (which, inci-                             vessels
dentally, does not undertake purse seine or drifting longline surveys).                         Fishing hours                        41,074          2,650        190,355           7,511
   The area of the NWS identified as highest risk falls within a spatial                        Incorrect fishing hours (%)         99.82%           100%            51%            82%
closure of 0.8 million km2 in which directed shark fishing has been
                                                                                                The machine-learning classified fishing effort data used by Queiroz et al.3 to evaluate the
prohibited since 20056. Although an area to the northeast remains                               risks to sharks from fishing in Western Australian and Australian maritime jurisdictions. The
open to shark fishing, none has occurred since 20096 and a network of                           table shows the total number of vessels classified as using longlines or purse seine, and their
State and Commonwealth marine reserves has since been implemented                               respective fishing hours, along with the number of vessels and percentage of fishing hours
over much of that area. Fishery-independent surveys carried out over                            found to be incorrect. Australia and offshore territories includes all offshore and sub-Antarctic
                                                                                                territories and the Australian Antarctic Territory.
a 17-year period confirm stable or increasing relative abundance and

Fisheries & Agriculture Resource Management, Department of Primary Industries and Regional Development Western Australia, Hillarys, Western Australia, Australia. 2Centre for Sustainable
1

Aquatic Ecosystems, Harry Butler Institute, Murdoch University, Murdoch, Western Australia, Australia. ✉e-mail: alastair.harry@gmail.com

                                                                                                                                              Nature | Vol 595 | 8 July 2021 | E17
Matters arising
a b
10° S 10° S
NWS NWS
20° S Southern 20° S Southern
GBR GBR
30° S 30° S
40° S Fishing hours 40° S
1
10
100
1,000
50° S 50° S
110° E 120° E 130° E 140° E 150° E 160° E 110° E 120° E 130° E 140° E 150° E 160° E
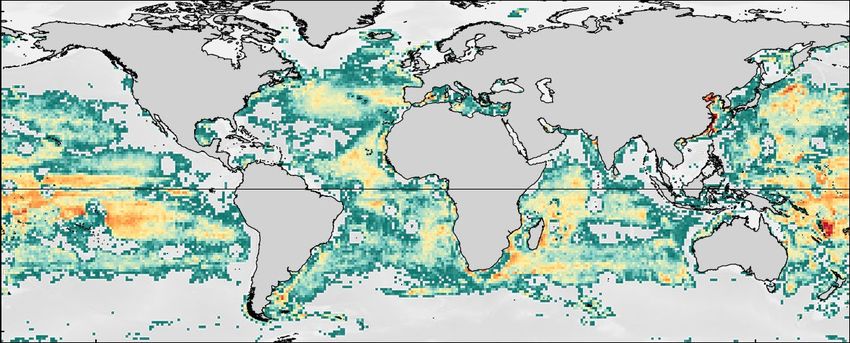
Fig. 1 | Machine-learning-classified fishing effort data (0.1° × 0.1° grid cells) longline fishing and shark density. Grey shading shows the waters under
used to evaluate the risk to sharks from pelagic longline and purse seine Australian jurisdiction. The green line denotes the boundary of the Great
fishing in waters under Australian jurisdiction. a, Data used in the original Barrier Reef Marine Park. The blue line denotes the Western Australian
analysis by Queiroz et al. 3. b, Data that were correctly attributed to longline and maritime jurisdiction. Dark grey shading within Western Australian waters
purse seine fishing vessels. The NWS and the southern Great Barrier Reef (GBR) denotes the NWS. This figure was created with the statistical software R
were identified as globally important ‘hotspots’ based on the spatial overlap of v.4.0.215. Scale bars, 800 km.
what constitutes an acceptable level of accuracy at the global level working at the regional level. A balanced and critical view of highly
may be unacceptable at the regional or local level. The sheer volume collaborative and data-intensive approaches is essential if the oppor-
of data alone cannot overcome issues of potential bias and, in some tunities they provide are to be fully realized.
cases, can magnify them10,11.
These challenges point to a greater role for authors of global stud-
ies in harmonizing their research outcomes with regional needs and Reporting summary
priorities. Strategies for aligning research that makes use of the large Further information on research design is available in the Nature
number of contributing authors could involve consultation with natu- Research Reporting Summary linked to this paper.
ral resource managers or the use of regional focus groups to identify
errors and inconsistencies. In this case, examination of the substantial
body of publicly available, annually published status reports for the Data availability
relevant Australian fisheries, or engagement with Australian fisheries The results of the manual vessel review are available on GitHub (https://
scientists, would have revealed the errors. github.com/alharry/sharkMA).
Big-data research driven by multi-author collaboration has reshaped
the speed and scale at which science is conducted and delivered, with 1. Cheruvelil, K. S. & Soranno, P. A. Data-intensive ecological research is catalyzed by open
impact and reach often far exceeding traditional studies. The respon- science and team science. Bioscience 68, 813–822 (2018).
sibility lies with practitioners to ensure that these methods are used 2. Kelling, S. et al. Data-intensive science: a new paradigm for biodiversity studies.
Bioscience 59, 613–620 (2009).
appropriately given their potential to influence decision-making. 3. Queiroz, N. et al. Global spatial risk assessment of sharks under the footprint of fisheries.
In Western Australia, the findings of Queiroz et al.3 risk undermining Nature 572, 461–466 (2019).
confidence in the science-based management controls that are already 4. Clarke, R. Big data, big risks. Inf. Syst. J. 26, 77–90 (2016).
5. Kroodsma, D. A. et al. Tracking the global footprint of fisheries. Science 359, 904–908
implemented to protect the mature biomass of long-lived dusky shark (2018).
(Carcharhinus obscurus) and sandbar shark (C. plumbeus) stocks in the 6. Braccini, M., Molony, B. & Blay, N. Patterns in abundance and size of sharks in
region12. Off the southern Great Barrier Reef, the incorrect identification northwestern Australia: cause for optimism. ICES J. Mar. Sci. 77, 72–82 (2020).
7. Larcombe, J., Caton, A., Wiliams, D. M. & Speare, P. Western Tuna and Billfish Fisheries
of a global longlining hotspot has the potential to undermine regional Research (Bureau of Resource Sciences, Canberra 1997).
advice for the conservation of tiger sharks (Galeocerdo cuvier) and white 8. Larcombe, J. & Begg, G. Fishery Status Reports 2007. Status of Fish Stocks Managed by
sharks (Carcharadon carcharias), which have seen major population the Australian Government (Bureau of Rural Sciences, Canberra 2007).
9. Hobsbawn, P. I., Patterson, H. M. & Blake, S. A. P. Australian National Report to the
declines over recent decades13. Scientific Committee of the Indian Ocean Tuna Commission (ABARES, Canberra 2020).
The demand for solutions to global-scale environmental prob- 10. Kaplan, R. M., Chambers, D. A. & Glasgow, R. E. Big data and large sample size: a
lems has necessitated changes to the prevailing culture of individual, cautionary note on the potential for bias. Clin. Transl. Sci. 7, 342–346 (2014).
11. Bayraktarov, E. et al. Do big unstructured biodiversity data mean more knowledge? Front.
investigator-driven ecology14. Queiroz et al.3 provide a powerful dem- Ecol. Evol. 6, 239 (2019).
onstration of what can be achieved when ecologists work collectively by 12. Braccini, M., Blay, N., Hesp, A. & Molony, B. Resource Assessment Report Temperate
leveraging their data and expertise to approach these problems in new Demersal Elasmobranch Resource of Western Australia. Fisheries Research Report No.
294 (Department of Primary Industries and Regional Development, Perth, 2018).
ways. An ongoing challenge of this and similar studies is how to provide 13. Roff, G., Brown, C. J., Priest, M. A. & Mumby, P. J. Decline of coastal apex shark populations
globally relevant advice without superseding that of practitioners over the past half century. Commun. Biol. 1, 223 (2018).
E18 | Nature | Vol 595 | 8 July 2021You can also read