Face Off: Polarized Public Opinions on Personal Face Mask Usage during the COVID-19 Pandemic - arXiv.org
←
→
Page content transcription
If your browser does not render page correctly, please read the page content below
Face Off: Polarized Public Opinions on Personal
                                          Face Mask Usage during the COVID-19 Pandemic
                                                                                        Neil Yeung, Jonathan Lai, Jiebo Luo
                                                                              Department of Computer Science, University of Rochester
                                                                              {nyeung, jlai11}@u.rochester.edu, jluo@cs.rochester.edu

                                            Abstract—In spite of a growing body of scientific evidence         homemade face covering; these masks have been shown to be
                                         on the effectiveness of individual face mask usage for reducing       effective at preventing transmission [1], but not at preventing
                                         transmission rates [1], individual face mask usage has become a
arXiv:2011.00336v2 [cs.CY] 14 Nov 2020

                                                                                                               a mask wearer from infection. These masks are not NIOSH-
                                         highly polarized topic within the United States. A series of policy
                                         shifts by various governmental bodies have been speculated to         Approved and are not sufficient for healthcare workers who
                                         have contributed to the polarization of face masks. A typical         are in close contact with patients on a daily basis. During
                                         method to investigate the effects of these policy shifts is to        February, the Center for Disease Control and Prevention’s
                                         use surveys. However, survey-based approaches have multiple           (CDC) official policy towards face masks was not to wear
                                         limitations: biased responses, limited sample size, badly crafted     face masks for personal use. The CDC was concerned that
                                         questions may skew responses and inhibit insight, and responses
                                         may prove quickly irrelevant as opinions change in response to        recommending face mask usage as a policy would encourage
                                         a dynamic topic. We propose a novel approach to 1) accurately         hoarding behavior by non-healthcare workers and prevent
                                         gauge public sentiment towards face masks in the United States        healthcare workers from getting enough N-95 masks. These
                                         during COVID-19 using a multi-modal demographic inference             concerns were motivated by concerns of hoarding behavior1 .
                                         framework with topic modeling and 2) determine whether face              On February 29, the Surgeon General tweeted:
                                         mask policy shifts contributed to polarization towards face masks
                                         using offline change point analysis on Twitter data. First, we
                                         infer several key demographics of individual Twitter users such             “Seriously people- STOP BUYING MASKS! They
                                         as their age, gender, and whether they are a college student                are NOT effective in preventing general public from
                                         using a multi-modal demographic prediction framework and
                                         analyze the average sentiment for each respective demographic.              catching #Coronavirus, but if healthcare providers
                                         Next, we conduct topic analysis using latent Dirichlet allocation           can’t get them to care for sick patients, it puts them
                                         (LDA). Finally, we conduct offline change point discovery on our            and our communities at risk!”
                                         sentiment time series data using the Pruned Exact Linear Time
                                         (PELT) search algorithm. Experimental results on a large corpus
                                         of Twitter data reveal multiple insights regarding demographic           However, on April 03, the CDC reversed its earlier stance
                                         sentiment towards face masks that agree with existing surveys.        towards personal face mask usage, citing studies that showed
                                         Furthermore, we find two key policy-shift events contributed to       the high amount of asymptomatic carriers of COVID-19 [23].
                                         statistically significant changes in sentiment for both Republicans   The rationale behind the policy change was that although there
                                         and Democrats.
                                            Index Terms—COVID-19, Twitter, Demographic Analysis, Sen-          is no conclusive evidence that wearing a non-NIOSH-approved
                                         timent Analysis, Offline Change Point Detection                       face mask prevents one from getting sick, asymptomatic
                                                                                                               carriers who wore non-N-95 face masks prevent others from
                                                                I. I NTRODUCTION                               getting sick. Within the news media, shifts in governmental
                                            On March 11, 2020, the COVID-19 disease was offi-                  policy such as the one on April 3, along with inconsistent face
                                         cially declared a pandemic by the World Health Organization           mask policies by governmental officials, have been blamed
                                         (WHO). As of August 19, the disease has infected over 22              for face masks becoming a political statement and an in-
                                         million people worldwide with over 770,000 deaths. Individual         creasingly controversial topic [22]. Given potential confusion
                                         face mask usage has been demonstrated to reduce transmission          about the effectiveness of masks as well as shifts in public
                                         rates. However, within the United States, individual face mask        policy towards face mask by governmental bodies such as
                                         usage has become a polarized topic. Face masks can be                 the CDC, it becomes important to measure and understand
                                         differentiated into two categories. The first category are N-         both public perception of the public towards face masks and
                                         95 masks, which fit the National Institute for Occupational           how public perception is affected as a result of policy shifts.
                                         Safety and Health (NIOSH) certification for filtering at least 95     To this end, our study utilizes demographic inference and
                                         percent of airborne particles [2]. Only N-95 masks have been          sentiment analysis to track public perception of face masks.
                                         shown to effectively reduce both infection and transmission           We also introduce change point analysis on the sentiment time
                                         rates; thus, they are the only masks that healthcare workers can      series as an effective method of testing whether events cause
                                         use to minimize the chance of contracting COVID-19 when               statistically significant shifts in sentiment.
                                         interacting with patients within close quarters. Other types            1 Hoarding behaviour was observed on other essential supplies, such as hand
                                         of masks include surgical grade masks, reusable masks, and            sanitizer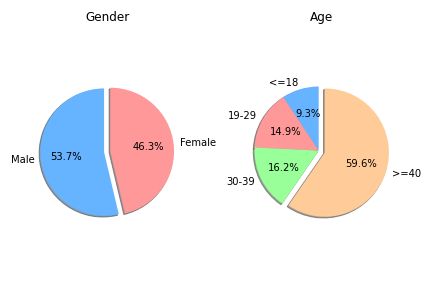
In summary, our contributions in this study are as follows:       point search algorithm that detects changes in variance, an
  • We employed state-of-the-art, multi-modal demographic           arguably more precise and efficient method [11]; we iterate
     inference techniques to characterize Twitter users over a      through multiple time series filtered through demographics
     wide amount of demographics of interest;                       (which is more specific than a hashtag constraint); and we use
  • We performed topic modeling and analysis on a novel             VADER [6] for sentiment analysis which is valence-aware and
     and relevant subtopic of COVID-19—face mask usage;             specifically tuned for social media data, rather than a generic
     and                                                            sentiment analyzer.
  • We applied iterative offline sentiment time series detec-
     tion on Twitter data with demographic filters to confirm
     the findings from existing surveys and uncover new
     insights in public opinion on this polarizing national
     issue.
                     II. R ELATED W ORK
   Twitter has been verified as a valuable source of data for
analyzing and predicting various large-scale societal events
such as elections [19]. During other pandemics such as the
2009 H1N1 pandemic [9] and the 2014 Ebola outbreak [10],
Twitter has been used to monitor public sentiment towards the
pandemics. Sentiment analysis and topic modeling research
has been done on various aspects of COVID-19 such as
investigating college students’ sentiment towards the pandemic
[15] and analyzing the use of controversial terms such as
“Chinese Virus” [14].
   The majority of literature on face mask usage during
COVID-19 has been on assessing face mask effectiveness
and modeling effects of universal face mask usage [1], rather
than measuring public perception towards face masks. Notably,
there has not been any work specifically analyzing public
perception towards face mask usage during COVID-19. Face
mask usage is of particular interest considering recent news
coverage surrounding politicization of mask usage and face
mask mandates by corporations and state legislatures. Further-            Fig. 1. Overview of the demographic inference framework.
more, demographic inference of users is important in light of
sparse demographic reporting for those infected by COVID-19
                                                                                   III. D EMOGRAPHIC A NALYSIS
and disparities found in infection and fatality rates along race,
age, generational, racial, and economic lines [17]. We built        A. Pre-processing
upon previous research in social media demographic inference           We sampled tweets from a Covid-19 Twitter chatter dataset
that analyzes users’ location, gender, race, and occupation         for scientific use [4]. The dataset contains COVID-19 tweets
using publicly available data [7, 13]. Previous works on Twitter    that start from January 11, 2020 and, at the time of writing,
demographic inference differ from our approach in two ways:         continues to be gathered. We restricted our analysis of the
they either focus on a slim set of demographics (three or           data up to August 10, 2020. Each tweet is cleaned of URLs,
less) or only take a single aspect of a tweet object as input       hashtags, emojis, and on Twitter. A version of the tweet con-
(only text, for example) [16]. In contrast, the recent advances     taining emojis and hashtags is kept to feed into our sentiment
in machine learning makes it possible to utilize a multi-           analyzer. Every tweet is also tokenized, where each string is
modal approach to demographic inference along a wide set            broken down individual words useful for sentiment analysis. A
of demographics.                                                    regex search for tweets that contain the terms in a dictionary
   Change point detection is an effective method to discover        of mask-related terms (e.g. “face mask” and “mask”) along
statistically significant shifts in time series data. Existing      with a set of mask-related hashtags (e.g #facemask) is applied
work on exploring sentiment time series graphs resulting            to the data set and the tweet language is restricted to English.
from social media data has been sparse. Ref. [5] uses online        We recover the full JSON Twitter objects using hydration.
sentiment change detection to detect sentiment changes on           Deleted tweets could not be recovered and are thus thrown
Twitter streams of a specific hashtag and offline change            out. Additionally, twitter accounts that were found to have
detection is used to try to rediscover the shifts. Our approach     a high chance of being an organizational entity rather than
differs in a few ways: we use an exact offline change point         a person from the M3 model were also thrown out. After
search algorithm rather than an approximate online change           pre-processing, a total of 1.2 million tweets are gathered that
mention mask-related terms spanning from January 11, 2020 shown that college students react more negatively to COVID-
to August 10, 2020. 19 than the general population [15]. In the early days of the
outbreak, it was reported that students continued to travel to
B. Valence-Aware Sentiment Analysis popular spring break locations. We followed the methodology
The Valence Aware Dictionary and Sentiment Reasoner employed in [15] to build a college student classifier. We gath-
(VADER) model is used for processing text and predicting ered a gold standard balanced set of training data composed
valence scores and sentiment [6]. The model utilizes a long of 250 college students and 250 of non-college students. Two
short-term memory (LSTM) architecture and is trained on a different raters hand labeled the entries. A score was assigned
gold standard of tweets created by 20 raters. The VADER to each Twitter user if the raters agreed on the score.
model is chosen because it adjusts its rule-based compound Ref. [8] finds that users reveal their identifying attributes in
score according to emojis and other common social media the possessive form. We build upon a list of attributes that
features that other sentiment models do not take account of. identifies a user as a college student from [15] (e.g. “my
VADER outputs a number a normalized value from [−1, 1]. textbook” and “my professor”) and their point wise mutual
Thus, we consider a positive VADER score of as having information (PMI) to obtain a custom list of distinguishable
positive sentiment (such as .04), a negative VADER score as attributes. We downloaded the full timelines of 100,000 users;
having negative sentiment (such as −.04), and a score of 0 as due to Twitter rate limits, we are unable to download more
having neutral sentiment. When we refer to the VADER score than this number of timelines. We ran a 80/20 train-test split
of each demographic, we are referring to the average VADER on our training data and converted the collection of timelines
score of that demographic. into a matrix of TF-ID features using a TF-ID vectorizer. We
then extract relevant terms of the timelines for the training data
C. Age, Gender, and College Student Classification and ran the relevant terms through a random forest classifier
Age and gender are two demographics of interest. In par- using our training labels to determine and predict class labels
ticular, Covid-19 has been shown to have a higher mortality for whether the user is a college student or not using the list
rate amongst the older population and COVID-19 death data of identifying attributes. Users that displayed a high frequency
reveals that men suffer a higher fatality rate from COVID-19 of terms such as “professor” and “textbook” had their labels
[17]. We extract age and gender using the M3 model, a multi- manually overridden to be college students.
modal deep learning system for inferring the demographics of
users from four sources of information from Twitter profiles:
user’s name (first and last name in natural language), screen
name (Twitter username), biography (short self-descriptive
text), and profile image [7]. During the process of retrieving
the profile images, we discard entries that contain a faulty
profile image link, invalid picture format, deleted profiles, or
users that do not output a prediction for any other reason. In
the end, we are left with 1.09 million tweets which are able
to have their age and gender predicted.
Fig. 3. Age and Gender Distributions of College Students
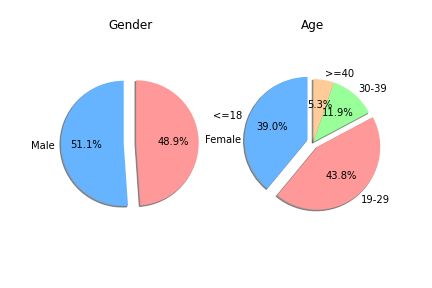
A large majority of our data appears to be drawn from the
Male, over 40 category when we look at all users. Previous
Twitter demographic research [8] have found that Twitter users
skew young. However, a majority of our data finds Twitter
users in the 40 and over age demographic (Fig. 2). One
potential conclusion that can be drawn from this is that the
40 and over demographic disproportionately tweet about face
masks as they are over represented. The gender distribution
Fig. 2. Age and Gender Distributions of All Users of the college students appears to coincide with the known
fact that females attend college at a higher rate than males as
College students are a demographic uniquely impacted by the female college population is larger in the college student
COVID-19. Previous work on analyzing college students has data set than the entire data set. The ≤18 and 19-29 categoriesFig. 4. Average Sentiment Score across each Demographic Fig. 5. Geographic Area and Census Region Distribution.
make up 82.8% of the college student data. This implies that
the college student classifier is reasonably accurate, as most
college students fall within this age range.
Two key observations can be made on this data: females
were found to have a higher average sentiment than males
and college students have a different outlook on face masks
than the general population. The fact that females have higher
sentiment than males agrees with current surveys showing
men are less likely to wear masks [21]. College males had
positive sentiment towards face mask in comparison to males
in the overall data set. College females had higher sentiment
than females in the overall data set. The college students
in the ≤18 and 19-29 categories had higher sentiment than
the counterpart in the complete data set. The college 30-
39 and ≥ 40 categories had opposite sentiments from their Fig. 6. Median Household Income Breakdown
counterparts. We are not sure why this is. One factor that might
have skewed the sentiment data for these two categories is the
fact that the two categories should be underrepresented in the and non-metro counties by level of urbanization. A county is
college population. Any inference that a user is both a college assigned a number from 1 to 3 if it is considered a metro
student and is over 30 is, according to probability, likely a area and a number from 4 to 9 if it considered a non-metro
result of an error from either classifier. area. We investigate the sentiment of each state through the
four regions identified in the United States Census Bureau:
D. Location and Average Household Income Northeast, Midwest, South, and West. From this point forward,
Approximately, 8.2% (89,380) of the gathered twitter data we refer to each region informally as East Coast, Midwest,
which was able to have the user’s age and gender inferred had South, and West Coast respectively.
a non-empty location. The location were checked against a list Within our dataset, there are more metropolitan users than
of cities within the United States. Only locations matching rural, more coastal users than the South and the Midwest,
a city were kept. The median household income of the zip and more above average income users. This coincides with
code associated with the city is retrieved and associated with previous research on these specific demographic categories
each data point. We grouped household income based on which implies that our methodology is reasonably accurate.
the zip code’s median household income’s relationship to Rural counties had more negative sentiment while urban
the real median household income within the entire United counties had a higher positive sentiment. A possible explana-
States (above, equal, below), which is 63,179 as of 2018 tion may be that face mask usage is more of a concern in
according to the U.S. Census Bureau. Each county is classified metro environments due to higher population density in these
according to the 2013 Rural-Urban Continuum Codes (RUCC) areas. We also note that Twitter users are more represented in
classification scheme [12]. The RUCC classification scheme metropolitan and coastal regions in general. The Midwest and
assigns each county in the county a number from 1-9. The South also have negative sentiment in contrast to the coastal
schema differentiates metro areas based off population size regions which have positive sentiment. This could potentiallyFig. 7. Average sentiment by geographic area and census region distribution. Fig. 9. Ethnic profile distribution.
Fig. 8. Average sentiment by Zip Code median household income. Fig. 10. Sentiment by ethnic profile.
be due, again, to the population density difference, among for a Greater European, West European, British name. The
other reasons (see Fig. 7 for comparisons). Above average ethnic prediction methodology yields 12 separate racial pro-
income users and average users had positive sentiment, in files corresponding with the Wikipedia training data. We group
contrast to below average income users. One explanation for the 12 different racial profiles into 5 major groups: European
this observed trend is that living in a zipcode with a higher (Germanic, Britain, East European), Hispanic (which includes
median household income is correlated with living in a coastal, Spanish origin names), African (as well as Muslim), East
metropolitan region, as these regions tend to have a higher Asian and Indian.
cost of living. Another explanation could be the fact the low- Notably, there appear to be less users with a name of
income households are more adversely affected by COVID-19. European descent than expected based off existing census data.
The most significant finding from the racial analysis is that the
E. Ethnicity
only ethnic profile to show negative sentiment is the European
We attempt to infer the ethnic profiles of each Twitter user ethnic profile. This coincides with the ample media reports on
in the 1.09 million users whose age and gender are previously the stronger resistance to face masks among this ethnic group
inferred. First, we extract the first and last name utilizing a [20, 21]. Also, East Asian and Indian profiles have higher
name parser; any middle names or titles are disregarded. We sentiment than African and Hispanic ethnic profiles.
also craft a set of rules to remove any names that are not
legitimate names (e.g. having a long sentence as a name). F. Political Affiliation
Then, the first and last names into an LSTM model trained on Ref. [19] finds that 92% of Twitter users who follow a
US census data from a Wikipedia database of names and their political candidate, only follow candidates of a single party.
associated race [13]. Ultimately, we are able to infer 900,000 The methodology is not able to be emulated exactly, due to the
legitimate names. For example, an entry with the first name Twitter rate limits, so a modified methodology is utilized. First,
John and the last name, “Smith,” would output a prediction the tweets are filtered for keywords drawn from a politicalTABLE I
L ATENT D IRICHLET A NALYSIS T OPICS D ESCRIPTION AND E XAMPLE
T WEETS
Topic Description Example Tweet
No requirements appear to be included
for masks or any other additional
Topic 1: Mask at
safety and prevention. When the majority
School and Work
of teachers and support staff are
home sick thatll be a short school year.
About time Governor DeSantis mandates
the wearing of masks in public.
Topic 2: Governmental Lives before politics Governor,
Mask Policy and for people who refuse to wear masks,
idiosyncrasies have no place in a pandemic.
I applaud the Florida lawyer for his efforts.
Topic 3: Wear a dang mask if you want to
Post-Pandemic Events see Big Tex again.
“From a medical standpoint it would be
extremely rare to have a condition where
Fig. 11. Sentiment and distribution across political affiliation. Topic 4: Public Health you truly could not wear a mask,”
Concerns said Dr. Clay Callison, a pulmonary
disease doctor and and UT Medical
keyword dictionary (which includes the names of presidential Center’s Chief Medical Information Officer.
candidates, among others). This increases the likelihood that
the user is politically active (e.g. follows a Democrat politician
or Republican politician). Next, the “following” list of each
The first topic talk about masks at school and work. Two
user that passes the initial filter is downloaded. The timeline is
subtopics are highlighted: concern for a lack of safety precau-
checked against a list of the verified senators and presidential
tions in school and places of work work and observations about
candidate Twitter account ids. Per the 92% one party heuristic
mask usage at school and work. One interesting reoccurring
from [19], it is assumed that if a user follows a candidate of
concern within the first subtopic is that places of work and
one party, they only follow candidates of that party, and the
school are reopening prematurely, which is expressed within
respective party affiliation is attached to the user. This allows
the example tweet in Table I. Many tweets express doubt
for retrieval of a higher volume of users with assigned political
towards proposed efforts to reopen safely. Tweets within this
affiliation given Twitter rate limits. Ultimately, 241,199 users
subtopic may claim that “teachers and students will die”
are able to be assigned a political affiliation.
when schools reopen. The second subtopic of tweets contains
The fact that there are more Democrats within the collected
observations about the rates of mask usage at school and work.
data is unsurprising, given that existing Twitter demographic
The observations almost always center on a lack of face mask
research shows that most Twitter users are identify as liberal
usage at school and work. For example, a few tweets talk
[16]. It is notable that Republicans have sentiment that is
about seeing crowded schools in a state where no students are
more negative than the Democrats’ sentiment is positive. This
wearing masks.
finding also agrees with current surveys [21].
The second topic talks about governmental mask mandates
IV. T OPIC A NALYSIS and policies. Many of the tweets talk about state officials
Latent Dirichlet Allocation (LDA) is utilized to discover such as the state governor or other elected public officials.
universal topics within the chatter dataset. Only noun, verb, Notably, a large portion of the tweets talk about Trump’s
adjective, and adverb lemmas are kept in each token to extract usage of masks. There are many tweets that comment on
the most relevant information. The bigrams and trigrams are the tweet Trump created on July 20, 2020 about wearing a
computed. The NLTK stop words package is supplemented mask. The tweets either claim that Trump is being hypocritical
with a custom dictionary of virus-related words (i.e. infection, or thanking Trump for being patriotic (per the language of
covid19) to ensure only novel topics. The LDA model with Trump’s tweet). Some tweets express a conspiracy that Trump
the highest combination of coherence score and subjective is wearing a mask because he is being “forced to” by some
interpretability is chosen. Four topics are chosen to analyze entity. When discussing political officials other than Trump,
and table I shows the rough topic groupings with an example tweets range from congratulating state officials for their
representative tweet. policies towards face masks or complaining about the state
officials’ policy. The topic also includes discussion about mask
A. Analysis mandates at stores such as Walmart, Walgreens, and Kroger.
Each topic is interpreted to have an overall theme. Subtopics There is also many mentions of the CDC and WHO. For
are identified by reading through representative example example, one tweet claims that the CDC is guilty of “criminal
tweets and then listing subtopics that reoccur often. Four topics negligence” regarding “lies about mask”. This verifies our
are identified: Masks at School and Work, Governmental Mask earlier hypothesis that Twitter users may have been confused
Policy, Post-Pandemic Events, and Public Health Concerns. about policy changes.Fig. 12. Word count and importance of topic keywords.
The third topic talks about post-pandemic events. The tweets made masks. These tweets detail masks being made out of
talk about what people plan to do when the pandemic is over miscellaneous materials such as cloth.
or what events that they missed due to the pandemic. Some
V. E XPERIMENT
of the tweets are formulated as a plea to wear masks so
that people can go to certain events that they are not able We are interested in studying the shifts in public policy
to during quarantine. For example, a tweet may ask people by governmental entities as these shifts have been speculated
to wear masks “if they ever want to see a concert again”. to have contributed to the polarization surrounding individual
When examining tweets early in the pandemic, from around mask usage. We assume that a shift in policy enacts a shift in
late March to early May, there are tweets talking about how the sentiments of tweets about masks. Specifically, we are in-
the pandemic would be over soon. For example, a tweet may terested to discover if any public policy shift has a statistically
talk about how a year from now, everyone would look back significant effect on the sentiment time series. Since we have
and say, “remember when we had to wear masks”. access to the full sentiment time series, our experiment can
be formulated as an offline change point detection problem.
The fourth topic talks about general public health concerns. Broadly, our methodology is the following: we iteratively
Under the umbrella of general public health concerns, there is run an offline change point detection algorithm to detect any
a recurrent line of discussion on the effectiveness of masks. statistically significant shifts in average sentiment for each of
Tweets may cite research on masks or claim that masks are the sentiment time series filtered by each demographic. Then,
not effective at all. Tweets that claim that masks are not we look within the news for a governmental shift event ±3
effective cite multiple reasons. A few cite religious protection; days around the detected change point to account for reactions
for example, one tweet says that there is “no need to wear a to news streaming in for a few days and associate the news
mask” and that one can “JUST PRAY”. A few tweets mention event with the change point.
N-95 masks. The tweets that mention N-95 masks appear to
display understanding of the difference between N-95 masks A. Problem Formulation
and other masks. For example, a tweet that talks about N-95 Modifying notation from [11], we formulate our problem.
masks may mention an N-95 mask’s ability to protect one “to Let y = {yt }Nt=1 be a sentiment time series and let any
the microns”. A non-trivial amount of tweets are about self- sentiment time series be denoted as T ⊂ N . We create asentiment time series for each demographic D as follows: set how a person’s perception will change towards a mask policy
each yt as the mean of all sentiments s of the users u ∈ D in change, even though political affiliation is correlated with
that demographic are included in the calculation. some of the other demographics inferred in this study (such
A change point is a time τ in a finite time series T such that as a rural location). This finding builds upon existing survey
there is a statistically significant change in variance σ between data that show Democrats are more likely to wear masks than
y1:t and yt+1:T . There are K such points where K ≥ 0. We Republicans [21].
utilize the Pruned Exact Linear Time (PELT) algorithm which
assumes we have unknown K, have access to the full time C. Limitations
series T , runs in O(N ), and looks for the best time series The limitation of this approach is an inability to treat for
segmentation T that solves exactly for confounders. Any detected change point may have resulted
from another news event that is not the CDC shift or Trump’s
tweet about wearing a mask. However, given extensive news
min V (T ) + β(T ) (1) media coverage on these two events, there is a high likelihood
T
that any statistically significant sentiment shift detected in
where β > 0 is a smoothing parameter and V (T ) is a
those date ranges is a result of the major events.
criterion which we seek to minimize2 .
We run PELT on every demographic sentiment time series
as well as the sentiment time series of the complete data.
We only find one proper segmentation: within time series is
filtered by political affiliation; the results are displayed in Fig.
13 and 14). PELT finds two change points: at 66 and 145 days
after January 27, 2020. This roughly this corresponds to April
04, 2020 and July 20, 2020. A change in the color of the
background of the graph (alternating blue and red) denotes a
detected change point.
B. Discussion
When looking at the news events relevant to masks that
might have caused the sentiment change, two policy shift
events could potentially be correlated with the change: the
shift in policy by the CDC on April 03 (1 day before April Fig. 13. Republican sentiment time series change point discovery with Pelt
04) and Trump’s tweet on July 20, 2020 about wearing a mask. search.
The specific tweet that President Trump sent from his account
said:
“We are United in our effort to defeat the Invisible
China Virus, and many people say that it is Patri-
otic to wear a face mask when you can’t socially
distance. There is nobody more Patriotic than me,
your favorite President!”
During the previous topic analysis, these two events were
cited by many tweets. Only the time series filtered by political
affiliation yielded results with PELT search. From January 27
to April 03, both Republicans and Democrats had positive
average sentiment. However, after April 03, Republican aver-
age sentiment dropped to negative sentiment while Democrat Fig. 14. Democrat sentiment time series change point discovery with Pelt
average sentiment became positive. After Trump tweets about search.
wearing a mask on July 20, 2020, there was a shift up in
Republican average sentiment. However, Republican average VI. C ONCLUSION AND F UTURE W ORK
sentiment stayed negative. Democrats, in contrast, had a down-
shift of average sentiment, but stayed positive in sentiment Consistent public policies are essential for managing public
score. This finding is interesting, as it may imply that political health. To this end, we introduced multi-modal demographic
affiliation is the only consistent demographic in predicting inference combined with valence-aware sentiment analysis
topic analysis. We also conduct an experiment utilizing offline
2 For more detail on PELT, please read [11] change point detection for sentiment analysis.Our demographic inference finds some illuminating in- [6] C.J. Hutto and E. Gilbert, “VADER: A Parsimonious Rule-based Model
sights: 1) males had negative average sentiment while females for Sentiment Analysis of Social Media Text,” in Eighth International
Conference on Weblogs and Social Media, Ann Arbor, MI, June 2014.
had positive sentiment towards face masks, 2) the same age [7] Z. Wang et al., “Demographic Inference and Representative Population
and gender of college students, when compared to the broader Estimates from Multilingual Social Media Data,” in Proceedings of the
population, had different perception towards face masks, 3) 2019 World Wide Web Conference, May 2019.
[8] B. Shane, and B. Van Durme, “Using conceptual class attributes to
people with European ethnic profiles had negative average sen- characterize social media users,” in Proceedings of the 51st Annual
timent while every other ethnic profile had positive sentiment. Meeting of the Association for Computational Linguistics, Aug. 2013.
Finally, our experiment using PELT search for Twitter [9] C. Chew and G. Eysenbach, “Pandemics in the age of Twitter: content
analysis of Tweets during the 2009 H1N1 outbreak,” PloS one, Nov.
sentiment analysis shows that the April 03, 2020 CDC policy 2010. [Online]. Available: doi:10.1371/journal.pone.0014118.
shift event, and Trump tweeting about wearing a mask on July [10] EHJ Kim et al., “Topic-based content and sentiment analysis of Ebola
20, 2020, when considering the time series filtered by political virus on Twitter and in the news,” in Journal of Information Science,
Vol 42, Issue 6, 2016.
affiliation demographic, were statistically significant sentiment [11] C. Truong, L. Oudre, and N. Vayatis, “Selective Review of Offline
change points. We also find that Republicans appeared to Change Point Detection Methods,” in Signal Processing, 167:107299,
decrease their average VADER score in reaction to the CDC 2020.
[12] J. Cromartie, “Rural-Urban Continuum Codes”. United States
policy shift, while increasing their average VADER score in Department of Agriculture Economic Research Service, 2013.
reaction to Trump’s tweet. Democrats, on the other hand, had [Online]. Available: https://www.ers.usda.gov/data-products/rural-urban-
their average VADER score increase in reaction to the CDC continuum-codes/documentation [Accessed May 1, 2020].
[13] G. Sood and S. Laohaprapanon, “Predicting Race and Ethnicity From
policy shift and decrease in reaction to Trump’s tweet. the Sequence of Characters in a Name”, May 2019, arXiv:1805.02109.
Potential future work could include the use of a filtering [14] L. Chen, H. Lyu, T. Yang, Y. Wang and J Luo, “In the eyes of
algorithm to reliably catch fake twitter accounts. This would the beholder: Sentiment and topic analyses on social media use of
neutral and controversial terms for covid-19,”April 2020, arXiv preprint
decrease the amount of bots and fake twitter accounts within arXiv:2004.10225.
the data set and increase the number of authentic users in our [15] V. Duong, P. Pham, T. Yang, Y. Wang, and J. Luo,“The Ivory Tower Lost:
data set. We acknowledge that some demographics may prove How College Students Respond Differently than the General Public to
the COVID-19 Pandemic,” April 2020, arXiv preprint arXiv:2004.09968.
difficult to predict. As one example, many Asian Americans [16] A. Mislove et al, “Understanding the Demographics of Twitter Users”,
have European names that they prefer to use when online. in Proceedings of the Fifth international AAAI Conference on Weblogs
Future modifications to address this deficiency may involve and Social Media, 2011.
[17] J.B. Dowd et al., “Demographic science aids in understanding the
utilizing a multi-modal approach to predict ethnicity, similar spread and fatality rates of COVID-19”, in Proceedings of the National
to how age and gender is predicted. Academy of Sciences, vol. 117, no. 18, pp. 9696-9698, 2020. Available:
Social media data mining and sentiment analysis have the 10.1073/pnas.2004911117. [Accessed 16 August 2020].
[18] H. Achrekar, A. Gandhe, R. Lazarus, S. Yu and B. Liu, “Predicting
potential to be important tools in measuring public response to Flu Trends using Twitter data,” in 2011 IEEE Conference on Computer
abrupt policy changes during pandemics. More governments Communications Workshops (INFOCOM WKSHPS), Shanghai, 2011,
and health organizations can leverage social media data mining pp. 702-707, doi: 10.1109/INFCOMW.2011.5928903.
[19] Y. Wang, X. Zhang, and J. Luo, “When Follow is Just One Click
technology to improve policy outcomes. Away: Understanding Twitter Follow Behavior in the 2016 Presidential
Election”, arXiv, abs/1702.00048, 2017.
VII. ACKNOWLEDGMENT [20] Katz, J., Sanger-Katz, M. and Quealy, K., “A Detailed Map Of Who Is
We thank Viet Dong for providing the student classification Wearing Masks In The U.S.,” The New York Times [Online] Available:
https://www.nytimes.com/interactive/2020/07/17/upshot/coronavirus-
algorithm. face-mask-map.html [Accessed 15 September 2020].
[21] M. Brenan, “Americans’ Face Mask Usage Varies Greatly by
R EFERENCES Demographics,” Jul. 13, 2020, Gallup. [Online]. Available:
[1] D.K. Chu et al., “Physical distancing, face masks, and eye protection https://www.nytimes.com/interactive/2020/07/17/upshot/coronavirus-
to prevent person-to-person transmission of SARS-CoV-2 and COVID- face-mask-map.html [Accessed 15 September 2020].
19: a systematic review and meta-analysis,” The Lancet, vol. 395, issue [22] R. Rojas, “Masks Become a Flash Point in the Virus Culture
10242, pp.1973-198, Jun. 2020. Wars,” The New York Times, 3 May 2020. [Online]. Available:
[2] Centers for Disease Control and Prevention. “NIOSH-Approved N95 www.nytimes.com/2020/05/03/us/coronavirus-masks-protests.html.
Particulate Filtering Facepiece Respirators”, CDC. [Online]. Available: [23] A. Karni and M. Astor, “As Leaders Urge Face Masks, Their Be-
https://www.cdc.gov/niosh/npptl/topics/respirators/disp part/n95list1.html. havior Muffles the Message”, The New York Times, 2020. [Online].
[Accessed: May 5, 2020]. Available: https://www.nytimes.com/2020/04/22/us/politics/coronavirus-
[3] J.D. Smith et al., “Effectiveness of N95 respirators versus masks.html. [Accessed: 15- Aug- 2020].
surgical masks in protecting health care workers from acute
respiratory infection: a systematic review and meta-analysis.” vol.
188, no. 8, pp. 567-574, May 2020. [Online]. Available: NBCI,
https://www.ncbi.nlm.nih.gov/pmc/articles/PMC4868605/. [Accessed:
Aug 10, 2020].
[4] J. M Banda et al., A large-scale COVID-19 Twitter chatter dataset
for open scientific research - an international collaboration. [Dataset],
Zenodo. Available: http://doi.org/10.5281/zenodo.3831406. [Accessed:
August 2, 2020].
[5] S. K. Tasoulis, A. G. Vrahatis, S. V. Georgakopoulos and V. P.
Plagianakos, “Real Time Sentiment Change Detection of Twitter Data
Streams,” in 2018 Innovations in Intelligent Systems and Applications
(INISTA). Available: IEEE Xplore, http://www.ieee.org. [Accessed: Aug.
10. 2020].You can also read