WSAA DAMS - Water Services Association of Australia
←
→
Page content transcription
If your browser does not render page correctly, please read the page content below
WSAA DAMS
     INFORMATION PACK ONE
CONTENTS > 02 Summary points
         >   02   Dams in Australia
         >   06   Dams and flood mitigation
         >   07   Dams and drinking water quality
         >   08   Cost of dams
         >   08   Industry response to climate uncertainty
         >   12   Conclusion
         >   13   References
WSAA VISION FOR URBAN WATER SERVICES

                            CUSTOMER DRIVEN, ENRICHING LIFE

                            The Water Services Association of Australia publishes this series of information packs
                            on behalf of the Australian urban water industry to present the current situation on
                            key issues of relevance to the industry.

                            The urban water industry is striving to achieve four outcomes by the year 2030.
                            By working together with a common goal WSAA members intend to be:

                                    >   The most efficient trusted and valued service providers
                            		          in Australia

                                    >   A compelling voice in national policy making

                                    >   A valued partner in urban and land use planning
                            		          to enrich communities

                            As well as taking a strong role in the:

                                    >   Stewardship of the urban water cycle

                            The urban water industry is committed to ensuring customers and communities have
                            the water they need to live their lives. To achieve this we support a diversified portfolio
                            of water sources accepting that some water sources have multiple roles.                       :01

ABOUT WATER SERVICES ASSOCIATION OF AUSTRALIA (WSAA)
WSAA is the industry body that supports the Australian urban water industry. Its members and associate
members provide water and sewage services to approximately 16 million Australians and many of Australia’s
largest industrial and commercial enterprises. WSAA is always willing to innovate and seek new and smarter
ways of doing things and prides itself on making decisions that are based on sound knowledge
and research.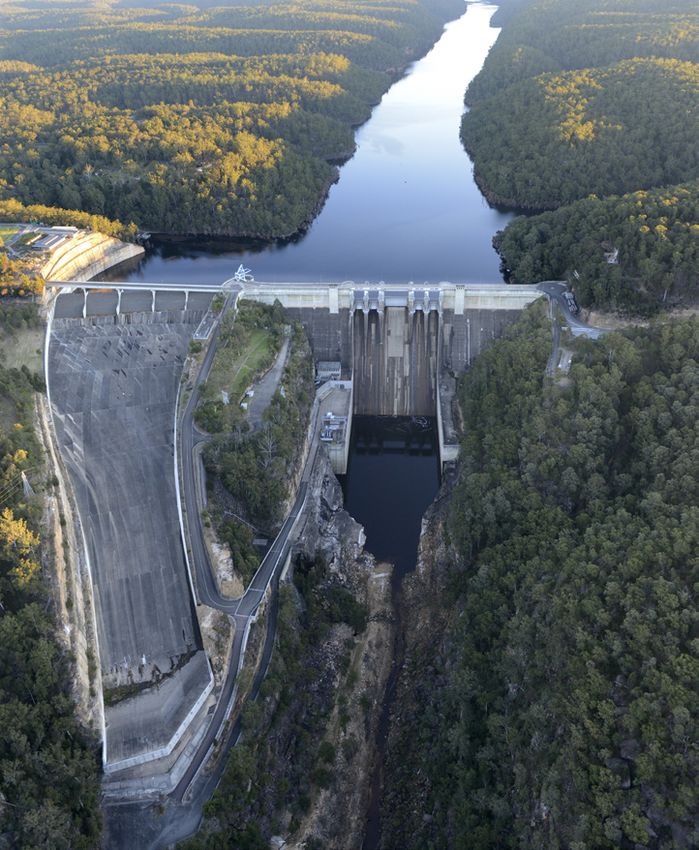
SUMMARY POINTS

      > Over the long term, dams can provide the
        cheapest source of bulk water for the urban
        environment, and dam water is easier to treat
        than other sources, such as seawater desalination.
        However, their construction can involve
        significant costs, and environmental impacts.

      > The changing climate is affecting the role of
        dams in public water supply. Long-term forecasts
        are for less rain in southern Australia which
        challenges water quality and quantity
:02     management in existing dams.

      > Most dams are built for water supply but a
        small number like Brisbane’s Wivenhoe Dam
        are built both for water storage and flood
        mitigation. Recent record floods resulted in
        high damage bills, so good dam management              DAMS IN AUSTRALIA
        that protects life and property, is a high priority.   Surface water dams have long dominated Australia’s
      > Dams are part of a wider ecosystem and are             urban water system. The first two – Yan Yean
        integral to communities use for recreation,            outside Melbourne and Lake Parramatta, Sydney
        tourism and agriculture. Collaboration,                – were completed in 1857. Dam building continued
        particularly with land use planners, is needed         steadily, accelerating after WW II. Today, there are
        to ensure better decision-making that protects         500 large (more than 15m high) dams. The Sydney
        drinking water quality and quantity.                   Catchment Authority has 20 supply dams and weirs
                                                               that hold more water per head of population than
      > Dams are assets that need to be on the balance
                                                               any other city in the world. Other metropolitan
        sheet. The ecosystem services provided by
                                                               areas such as Melbourne and South East Queensland
        dams for public water supply can top over a
                                                               (SEQ) store dam water providing for up to seven
        billion dollars, as is estimated to be the case
                                                               years of secure supply based on historical inflows.
        for Melbourne’s closed catchments.
                                                               Dams smooth out seasonal, annual and multi-year
      > Dams do not just store surface water, in parts of      drought variations in inflow, to distribute water
        Australia dams store water from various sources        supply according to daily demands. The capacity
        such as seawater desalination and groundwater.         of dams to sustain supply is dictated by local site
                                                               conditions and stream flow conditions that are
      > Australia is still building dams for public water
                                                               affected by climate and weather. This leads to the
        supply, such as the recent enlargement of
                                                               characterisation of dams as a ‘climate-dependent
        Cotter Dam in ACT. Utilities are quantifying
                                                               water source’.
        all costs and benefits, testing climate and
        demand-related scenarios, and exploring all            Dams generally provide the cheapest source of bulk
        options with communities and government early          water for the urban environment. Dams are typically
        in the planning to ensure the most optimal
        solution for water supply.
Fig. 1 TOTAL ANNUAL CATCHMENT INFLOW TO SCA’S HAWKESBURY – NEPEAN DAMS AND RAINFALL AT YERRANDERIE
10,000 0
9,000 500
8,000 1,000
789mm 958mm 763mm
7,000 1,500
6,000 2,000
Rainfall (mm/year)
5,000 2,500
Inflow (GL)
4,000 3,000
3,000 3,500
2,153 GL
2,000 4,000
951 GL
673 GL
1,000 4,500
0 5,000
2004
2009
1964
1909
1994
1944
1949
1999
1984
1969
1989
1954
1934
1929
1939
1959
1924
1979
1974
1914
1919
563055 Yerranderie (Warragamba catchment) Total annual inflow to Warragamba, Wingecarribee, Nepean, Avon, Cordeaux and Cataract Dams
Average for specified periods (1909-48, 1949-90, 1991-2012) 7 year moving average (rainfall) 7 year moving average (inflow)
:03
Note: Graph does not include inflows to Woronora Dam and Shoalhaven transfers
gravity-fed and are easier to treat than other sources, Climate risk – not enough rain
such as seawater desalination. For a long time The water supply risk includes early projections of
dams have met demand for water. Occasional up to 10% less rainfall across southern Australia by
imbalances have been managed by temporary 2030 and 20% by 2050. They also include more extreme
water restrictions. However, the role of dams in events including drought, floods and bushfires
public water supply and flood mitigation has (CSIRO & BOM 2007, 2011). This is crucial for public
been brought under the ‘political’ microscope water supply in Australia’s most populous areas.
by the long term drying trend in the south of
The south west of Australia has experienced a step
Western Australia, by the Millennium Drought
change in its rainfall and stream flow patterns
(1997-2009), and by the record floods on the
(Figure 2). The long-term drying trend evident from
east coast/southeast of Australia (2010/11).
the mid-1970s currently places this area and the city
In rural and regional Australia dams have played a of Perth in a position where it is unlikely that any
big part in building rural and regional prosperity. new dams will ever be built.
Many towns around Australia are dependent on
In Victoria during the Millennium Drought, stream
dams for their water supplies.
flow reductions into dams were four times greater
The building and management of dams has reflected than the decline in rainfall (CSIRO 2010). This occurred
how regularly Australia suffers from droughts and not only because of a general decline in annual
floods. However, this is now being challenged by rainfall, but because reductions in autumn changes
changing climate conditions and some of the meant catchments were drier at the start of winter,
surrounding uncertainties, particularly the severity resulting in less efficient winter runoff from
and timing of extreme weather events. catchment areas.
Fig. 2 YEARLY STREAMFLOW FOR MAJOR SURFACE WATER SOURCES – IWSS
1,000
900
800
700
Total Annual Inflow to Perth Dams (GL)
600
500
400
:04 300
200
100
0
1911
1914
1917
1920
1923
1926
1929
1932
1935
1938
1941
1944
1947
1950
1953
1956
1959
1962
1965
1968
1971
1974
1977
1980
1983
1986
1989
1992
1995
1998
2001
2004
2007
2010
Note: A year is taken as May to April Annual Total 1911 to 1974 av (338 GL) 1975 to 2000 av (173 GL) 2001 to 2012 av (78 GL)
This highlights the complex relationship between not that heavy rainfall events will become more
climate, weather, rainfall and stream flow into dams. frequent as the temperature increases. The tendency
The Millennium Drought reduced national GDP by for increase in intensity may be stronger for the
almost 1% and the net welfare costs of mandatory larger, rarer events (current 1-in-20 year events)
restrictions (invoked during the drought) amounted (Rafter and Abbs, 2009) particularly at the sub-daily
to several hundred million dollars per jurisdiction timescale’ (Westra et al., 2013).
per year (PC 2011).
Average inflows into Australia’s major dams
For further details, refer to WSAA’s paper ‘Climate Despite record rainfall on the east coast since the
Change Adaptation in the Australian Urban Water Millennium Drought broke, the Climate Commission
Industry’ (WSAA 2012). states that only about one-third of the rainfall debt
was paid back with the 2010 and 2011 floods.
Climate risk – too much rain
(Steffen, Hughes & Karoly, 2013).
The proportion of total rainfall from heavy falls will
increase in the 21st century over many areas of the Table 1 includes information on total dam capacity
globe (IPCC, 2012). A 1-in-20 year maximum daily in Australia’s major cities and the average inflows
rainfall event is likely to become a 1-in-5 to 1-in-15 into those dams over time. It includes the reduction
year event by the end of the 21st century in many in inflows experienced during the Millennium
regions (IPCC, 2012). According to the Climate Drought on the east coast, and the long-term
Commission ‘across Australia, it is more likely than drying trend in the southwest of Australia (Perth).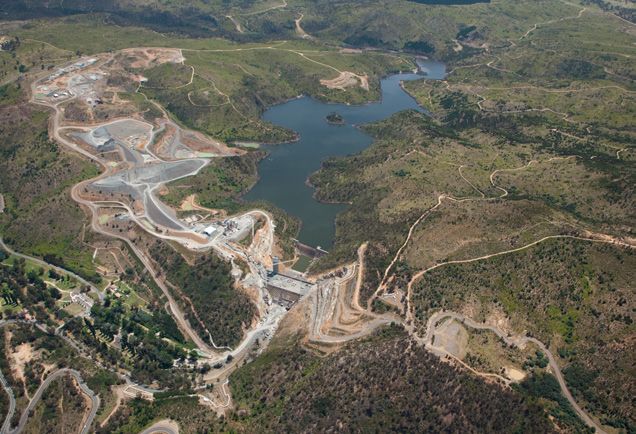
Table. 1 DAM CAPACITY AND AVERAGE INFLOWS

Location                   Total dam capacity (GL)                      Average inflows/yr (GL)
                                                                                                           :05
 Adelaide                  197 (Mount Lofty Ranges dams)                Mount Lofty Ranges dams
                                                                        1892-1990 (177)
                                                                        1997-2007 (113)

                           South Australians also rely heavily on the   River Murray
                           River Murray for public water supply         1891-2007 (11,100)
                                                                        1996-2007 (5,700)

 Brisbane                  2,220 (12 dams including Wivenhoe)           Wivenhoe Dam
                           Wivenhoe Dam – 1150                          1984-2001 (572)
                                                                        2001-2009 (100)

 Melbourne                 1,294 (Upper Yarra, Thomson, Maroondah       Upper Yarra, Thomson, Maroondah
                           and O’Shannassy dams)                        and O’Shannassy dams
                                                                        Pre-1996 (615)
                                                                        1997-2009 (376)

 Sydney                    2,581 (20 dams including Warragamba          Warragamba and Upper Nepean dams
                           and Upper Nepean)                            1909-1948 (951)
                                                                        1948-1990 (2153)
                                                                        1991-2012 (673)

 Perth                     581 (11 dams)                                1911-1974 (338)
                                                                        1975-2000 (177)
                                                                        2001-2005 (93)
                                                                        2006-2012 (66)

 Canberra                  205 (4 dams)                                 Pre-1996 (202)
                                                                        1997-2009 (95)
DAMS AND FLOOD MITIGATION                                     In making this decision the Minister for Water seeks
                                                                    advice in November each year from the Bureau
      Dams provide attenuation on flood flows even
                                                                    of Meteorology and the Department of Energy
      when at capacity because of the large surface area,
                                                                    and Water Supply. Previous and current seasonal
      the ability to store water, and the constrained rate
                                                                    outlooks, current dams levels, water security, and
      of outflow through spillways or other release.
                                                                    dam operations are considered, to determine the
      At the end of 2010 Queensland had experienced its             extent to which lowering the dams is likely to
      second wettest year on record experiencing double             mitigate the impacts of a potential flood.
:06
      the mean rainfall. In Victoria the rainfall was 30%
                                                                    Warragamba Dam – Sydney
      higher than average (Steffen, Hughes & Karoly, 2013).
                                                                    Built following a record drought in the 1930s, it is
      The wet season and summer rainfall in 2010/11 for
                                                                    one of the largest domestic water supply dams in
      both these states resulted in significant flooding.
                                                                    the world. Originally the dam had one spillway
      However, because of the flood mitigation effects              controlled by gates.
      of Wivenhoe Dam, the flood peak in Brisbane in 2011
                                                                    When new flood estimation methodologies
      (4.46m) was fortunately not as high as the record
                                                                    indicated that the dam could experience floods
      1974 peak (5.45m).
                                                                    much greater than originally anticipated, the dam
      Nevertheless the impact flooded 14,000 properties,            wall was raised five metres and strengthened by
      with 1,970 people evacuated (Steffen, Hughes & Karoly,        post tension anchors. The second stage, completed
      2013). The Queensland floods also left a damage bill          in 2002, involved building an auxilliary spillway for
      of $2b to local government infrastructure and another         management of floodwaters during rare or extreme
      $4b to public infrastructure, as well as $2.4b in insurance   conditions (1:750 year events and greater).
      payouts to date (Insurance Council of Australia 2013).
                                                                    The operation of the main spillway gates in 2012
      Wivenhoe Dam – Brisbane                                       (in response to high rainfall – but not a major flood
      This was built on the Brisbane River in 1984 to               event) sparked significant interest, as the dam had
      supply water, and provide for flood mitigation.               not spilt for 14 years. In response to the recent spill
      It is able to hold back 1,450 GL above its normal             from Warragamba Dam and the experience in
      capacity, as a flood mitigation measure. Again, it            Brisbane, the NSW Government has commenced
      contributed to reducing the impact of the 2011                a detailed review of the flood management
      floods on Brisbane.                                           arrangements for the Hawkesbury-Nepean Valley.
                                                                    Options include raising the Warragamba Dam wall
      Despite this, the Queensland Government
                                                                    to provide some flood mitigation. A flood of the
      announced a Commission of Inquiry into the
                                                                    rarity of the 2011 Brisbane floods would leave a
      management of Wivenhoe during those floods.
                                                                    significant damage bill. The review will also consider
      The final report recommended that dam operators
                                                                    whether the use of alternative operating procedures
      should temporarily reduce the Wivenhoe Dam level
                                                                    at Warragamba Dam might assist in mitigating flood
      to 75 per cent of its normal capacity if the Bureau
                                                                    impacts downstream. The Government expects to
      of Meteorology makes another strong warning
                                                                    receive findings of the review by the end of 2013.
      about an extremely heavy wet season.
CASE STUDY ONE – THE GREATER SYDNEY SURFACE WATER STORAGE SYSTEM STORAGE SYSTEM

                                  This system supplies Sydney, the Blue Mountains, the Illawarra, the Southern Highlands, the
                                  Shoalhaven and Goulburn (supplementary supply), and has a total capacity of about 2582 GL.
                                  Despite the average stream flows since 1991 being at their lowest ever, the severe drought
                                  years since 1991 have not been as bad in Sydney as those severe drought years during WWII
                                  (Figure 1). The following principles guide the design and management of the system.

                                  > Water supply storages (dams) act as buffers against highly variable surface water
                                    supplies fed from rainwater. In other words, Sydney’s dams have the capacity to
                                    hold 5.4 years of water supply to take us through prolonged drought periods.

                                  > The Sydney Catchment Authority’s water supply system eliminates the likelihood of
                                    running out of water, and minimises the frequency and duration of water restrictions.

                                  > Evidence shows that there are reasonable inflows to Sydney’s dams even during
                                    extended drought periods. For example, during the depths of the last drought
                                    (2001-2007), the inflows reduced to 372 GL in 2004. This was still around 70% of
                                    Sydney’s demand in that year.

                                  > To protect the water supply from running dry in drought periods, production
                                    from the seawater desalination plant occurs when dam levels reach 70%, and
                                    at 50% water restrictions are invoked. The reductions in demand achieved by
                                    these initiatives and smaller scale alternative water supplies like recycled water,
                                    combined with the catchment inflows that occur even during drought, ensure
                                    a secure and reliable water supply.

                                                                                                                                :07

DAMS AND DRINKING WATER QUALITY                          catchment and working towards more sustainable land
                                                         use is the key. In most jurisdictions, this occurs through:
In addition to storing water, dams provide detention
times that improve water quality in a number of          > 		 land use planning and vegetation clearing controls
important respects. This includes natural processes
                                                         > 		 devising and using assessment tools for new
where pathogens die off, and particulate matter
                                                              developments (eg the neutral or beneficial
settles out. Dams also attenuate fluctuations in
                                                              effect test)
water quality, which reduces water quality risks.
                                                         > 		 catchment management activities such as
Dam storage can also introduce water quality risks
                                                              tree planting, stream rehabilitation and soil
associated with cyanobacterial (blue green algae)
                                                              conservation
blooms and the release of iron and manganese
from sediments. Manipulating water in the dam and        > community education activities.
undertaking catchment management activities to
                                                         Closed catchments
reduce nutrient runoff can reduce this risk. Dams are
                                                         Closed catchments such as those for most of
either part of open catchments or closed catchments.
                                                         Melbourne’s supplies do not allow public access.
Open catchments                                          The native forest filters rainwater that flows across
Open catchments such as those in SEQ are areas           the land and into rivers and creeks that supply
where land use is mixed. While used to harvest           the reservoir. As a result, the quality of the water is
water these catchments also include other valuable       very high and requires minimal treatment. Closed
activities such as farming and recreation. Water         catchments provide the highest level of protection
from storages in an open catchment undergoes             to drinking water supplies. Melbourne Water for
treatment through sophisticated filtration and           example estimates the water quality benefits of
disinfection systems, given the higher levels of         ecosystem services provided by closed catchments is:
sedimentation and pollutants. Good land
                                                         > Capital $1.1b
management is the first, and best, way to improve
the quality of water stored and released from dams.      > Operating $110m plus fixed costs, or around
In open catchments, improving the biodiversity of the      $60m/yr
CASE STUDY TWO – BARWON WATER REGIONAL WATER CORPORATION

                        Barwon Water, Australia’s largest regional water corporation delivers services to 285,000 residents. This can
                        rise to 510,000 residents over the holiday periods. Most of these people receive water from one of 12 major
                        dams. Barwon Water’s recent Water Supply Demand Strategy (2012-2062) identifies that, with the permanent
                        water savings plan combined with the occasional use of temporary water restrictions, the dams supplying
                        the coastal townships of Aireys Inlet, Apollo Bay and Lorne (all popular holiday destinations) will deliver
                        water security for the next 50 years. This is provided the new storage for Apollo Bay is completed in 2014.

                 COST OF DAMS                                              INDUSTRY RESPONSE TO CLIMATE UNCERTAINTY
:08
                 Over the years, dams have provided a relatively           Engaging with customers and communities
                 cheap supply of water. Approximately $0.30 - $0.90/kL     Dams are major regional infrastructure. This means
                 for raw water through to treated dam water; delivered     that existing and potential dams attract many
                 via a gravity fed system.                                 stakeholders, often with competing interests.
                                                                           Balancing these interests across the environmental,
                 The relative difference in costs between dams and
                                                                           social, economic and cultural values attributed to
                 seawater desalination ($1.50 - $5/kL) is magnified
                                                                           dams, is complex. The industry is also aware of the
                 because most large dams were built, and partially
                                                                           need to engage with regional planners and a broad
                 paid for, many years ago. Current water users have
                                                                           network of stakeholders. The work completed by
                 been receiving cheap water from the old infrastructure
                                                                           ACTEW in the lead up to a decision to enlarge Cotter
                 paid for by older generations, but are now paying
                                                                           Dam illustrates this (see case study 4).
                 for the current ‘spike’ in new infrastructure costs.
                 These costs to some extent will equalise over time.       Adaptive planning
                                                                           Adaptive planning is the industry’s way of managing
                 However, for new dams there can be significant
                                                                           risk associated with variables that influence demand
                 costs. Environmental and social impacts associated
                                                                           for water. A number of utilities have created
                 with their construction add to the financial cost. As
                                                                           approaches incorporating:
                 this will vary depending on the location and other
                 factors it is difficult to provide an estimate of these   > the identification of flexible portfolios of water
                 financial costs to compare to the financial cost of         supply and water efficiency options. These may
                 constructing a seawater desalination plant.                 be at the site scale (eg household rainwater
                                                                             tanks), the local scale (eg third pipe recycled
                 The cost to build a large dam or a seawater
                                                                             water schemes), and at the city/regional scale
                 desalination plant in today’s dollars is significant.
                                                                             (eg large scale seawater desalination plants)
                 An informed decision must include a good
                 understanding of the factors affecting future             > scenario planning, combined with risk assessment
                 demand, like population growth. It must take
                                                                           > development of severe drought contingency plans.
                 into account changing development patterns,
                 appliance efficiency and customer behaviour.              For further details please refer to WSAA’s paper on
                 It must combine these with climate scenario               ‘Urban Water Security’ (2013).
                 modelling, and environmental flow requirements.
CASE STUDY THREE – THE NEUTRAL OR BENEFICIAL EFFECT TEST (SYDNEY CATCHMENT AUTHORITY)
In Sydney’s drinking water catchments, councils cannot approve development
applications unless they are satisfied that the development would have
a neutral or beneficial effect on water quality. Where the councils are
not satisfied, they are required to refer the application to the SCA
seeking concurrence. This requirement is set out in the legal document
‘Drinking Water Catchments Regional Environmental Plan No. 1’. The
outcomes from the SCA’s assessment become conditions of concurrence
that are included in council conditions of development consent. The REP
is also responsible for:
> developing rectification action plans
> setting water quality objectives in line with the NSW Government’s
priorities for water quality protection
> introducing strategic land and water capability assessments which
identify appropriate types and intensity of land use that will not
adversely affect water quality.
Using dams to store desalinated or from dams in South East Queensland is roughly
:09
recycled water equal to that supplied through the distribution
Dams can also play a role as storages for climate system, 300GL according to the Urban Water
independent sources of water like seawater Security Research Alliance (Yao X et al. 2010). By
desalination and recycled water. Dams in Perth contrast, Sydney’s evaporation rate is approximately
are regularly used to balance storage for sources 100 GL/yr (or 20% of volume supplied), by virtue of the
ranging from surface and groundwater to deep storages and low surface area to volume ratios.
desalination, before distribution to customers in
Developing new technologies to reduce
periods of greater demand. In some other cities
evaporation is important. Food grade polymer
dams may also be used to store desalinated water
modules that float on a dam have been trialed in
when the plants are operating. In Melbourne,
the northwest of Victoria with great success – 88%
Cardinia Reservoir will be used to store water from
reduction in evaporation, with positive effects on
the Wonthaggi seawater desalination plant. Australia
water quality with lower temperatures maintained
does not currently replenish its dams with highly
(GWMWater 2011).
treated sewage. Other parts of the world do. In
Singapore approximately 11 million litres of recycled Valuing ecosystem services
water is added every day to a reservoir, then further As stated earlier catchment ecosystems provide
treated as part of Singapore’s normal drinking water important ‘natural’ infrastructure for water quality
treatment system. This source meets 30 per cent of and supply, and protection against water-related
the nation’s water needs. hazards. A multiple barrier approach recognises
this. Valuing ecosystem services can help WSAA
Developing technologies to decrease
members deliver on their goals, but a key shift
evaporation from dams
needs to occur beyond just the ‘valuation’.
The dams that are more vulnerable to climate
Catchment ecosystem values need to be integrated
change will be the larger shallower ones in areas
into utility and regulatory decision-making processes.
where high evaporation rates are most likely to
increase. Even now, annual loss of water from This means counting catchments as corporate
storages through evaporation can exceed 40 per assets. It means factoring the value of ecosystem
cent of water stored over a year (Prime et al. 2012). services into the investment appraisals and
The volume of water lost through evaporation cost-benefit analysis applied to water investments.CASE STUDY FOUR – ENLARGEMENT OF COTTER DAM – CANBERRA (ACTEW)
The proposal to enlarge the Cotter Dam is part of a suite of initiatives to secure the ACT’s
water supply. These initiatives were chosen after four years of investigations including the
ACT Government’s ‘Think water, act water – a strategy for sustainable water resources
management’, and ACTEW’s Future Water Options project.
Enlarging the Cotter Dam has expanded its capacity from 4GL to 78GL. This inundated 231ha
of land, most of it a former pine forest destroyed by fires. A further 38ha was cleared for
construction and ancillary works. The Cotter Dam project proved to be the most appropriate
option because it:
> provides the greatest net economic benefit to the community – several hundred million
dollars. The dam delivers amounts of water similar to those projected for the large Tennent
Dam option, but with less risk, in a quicker timeframe, and at half the capital cost (only $363m)
> has low environmental impacts
> makes use of existing infrastructure (pump station at Lower Cotter and the Mount Stromlo WTP)
> draws water from a more reliable catchment than the Tennent or Googong catchments
> catches much of the overflow from storm events that the current dams in the Cotter system
:10 cannot store.
The dam enlargement is the biggest project of its type in Canberra for 35 years. About 2,800
people have worked on the dam, some from as far as England. The Cotter Recreation Precinct
includes the popular picnic and recreation areas of Cotter Avenue, Cotter Campground, Cotter
Bend, Casuarina Sands and the immediately surrounding forest areas. The Canberra community
places a high value on the recreation opportunities within the Cotter Precinct. The project has
included upgrading recreational facilities and providing new recreation experiences. One, the
new Cotter Dam Discovery Trail, educates the community about Canberra’s water history, and
has provided unique viewing and educational opportunities of the construction of the dam.
To demonstrate the broad economic values allow rivers to function normally. Water may also
attributed to natural assets, Melbourne Water be protected from abstraction – where water is
recently attempted to quantify the other benefits removed from a river for irrigation or some other
associated with Cardinia Reservoir (a catchment area purpose (ACT Govt). Every state in Australia has laws
and man-made receiving body for water from Silvan and/or guidelines governing abstraction rates from
Dam and the Wonthaggi seawater desalination rivers as well as the amount of water needed in
plant), as well as the adjoining recreation area, and reserve to protect the natural flow of our rivers.
the Cardinia Creek. In total the value of those natural
assets is estimated to be about $173m. For example in the ACT, environmental flow
volumes required by regulation change in response
Protecting rivers – the role of to whether or not the ACT is under water restrictions
environmental flows due to drought. In 2012 a total of 374GL or
Rivers, streams and wetlands need certain amounts environmental flows came from the dams on the
of water at certain times to support healthy aquatic Cotter and Queanbeyan rivers, and from the Lower
ecosystems. In rivers with dams, or those used for Molonglo water treatment plant in the ACT. Due to
irrigation or disposal of treated sewage, this good rainfall in these catchments in 2012 all of the
normal flow is changed. To compensate, water dams overspilled and released more water that the
may be released from dams at certain times to regulated environmental releases.CASE STUDY FIVE – ECOSYSTEM VALUATION IN THE BLUE LAKE CATCHMENT, MOUNT GAMBIER SOUTH AUSTRALIA
SA Water is responsible for the quality and availability of reticulated water distributed to its customers. One of
the key water sources in South Australia’s south east is Blue Lake, primarily fed by groundwater (an unconfined
aquifer). As well as providing most of the domestic, commercial and industrial water for the City of Mount Gambier,
the area is an important recreational destination, attracting around 400,000 visitors a year. The catchment for the
groundwater aquifers that feed Blue Lake (the “Capture Zone”) covers an area of 28,610 hectares, and is comprised
of a mosaic of grazing land (around 60% of the catchment), urban settlements, plantation forestry and irrigated farms.
Several government agencies cooperate in the management of the Blue Lake Catchment to preserve its
various water and ecosystem services. Overall, common goals include:
> Maintaining or improving water quality (drinking water provision; touristic attraction due to vibrant blue lake
water colour in summer)
> Avoiding / mitigating further lake level decline
:11
Natural ecosystems in the Blue Lake Catchment can deliver important water quality and supply services
according to a broad evaluation of the Blue Lake Catchment completed in 2009 (SA Water and University of
South Australia 2009). Four catchment management options were assessed against the identified ecosystem
services covering water quality and quantity as well as other values linked to the human wellbeing and
economic processes in the region. The results of the valuation exercise indicated potential order-of-magnitude
estimates of economic gains achievable by the tested management options.
Catchment ecosystem management options
Drainage well Water-sensitive urban Natural and Rainwater harvesting
management design and mini-wetlands constructed wetlands
Water service Reduced risk of water More efficient Water replenishment Water capture
values supply contamination stormwater capture and purification and use
and re-use
Other ecosystem Recreation, amenity Recreation, amenity,
service values and aesthetic aesthetic, biodiversity,
carbon store, fuel and
other products from
reed crop
Net Present $5 million $1 million $10 million $20 million
Value(approx)CASE STUDY SIX – PROVIDING ENVIRONMENTAL FLOWS TO AREAS DOWNSTREAM OF SYDNEY’S DAMS
The Sydney Catchment Authority had been releasing environmental flows from its dams since
1999 to supplement low flows in the rivers downstream of its dams. The SCA spent $80m
between 2006 and 2011 to rectify the adverse downstream environmental impacts of its
dams. Over this period it installed new environmental flow release works at five dams and
10 weirs. It also installed fishways at one dam and 11 weirs. New environmental flows which
mimic the full variability of river flows commenced from the SCA‘s dams on the Nepean River
in 2011 and on the Shoalhaven and Woronora rivers in 2009. These flows required substantial
retrofitting of release infrastructure to make the full range of environmental flow releases.
In 2011-12, 440GL of water was released from the SCA’s dams as environmental flows,
compared to 418GL provided to supply. The SCA has installed new fishways at dams and weirs
to overcome the significant barriers that dams present to the movement and migration of
fish. Extensive monitoring and evaluation programs are in place to assess the effectiveness
of these works and releases.
:12
CONCLUSION locations, dams will be the appropriate solution to
meet future water supply needs. Australia has not
Building dams may over the long term provide
stopped building dams for public water supply as
low cost supplies. Initial construction costs,
this paper shows through the example of the recent
however, are high. Dams can have significant
enlargement of Cotter Dam. However, the long-term
local environmental impacts, including changes
drying trend in southwestern Australia (evident from
to flow regimes in rivers, reduced downstream
the mid-1970s) currently places this area and the city
environmental flows and submergence of land,
of Perth in a position where it is unlikely that any
as well as dislocation of communities. Other
new dams will ever be built to meet Perth’s public
options such as seawater desalination, recycled
water supply needs.
water, rainwater and stormwater harvesting
may secure water needs. Building new dams is one option for managing
Australia’s future water needs. Against a backdrop
To manage climate, population growth, economic
of changing climate conditions and growing
and technological uncertainties, it is critical to
populations, increasing focus on Integrated Water
identify, assess and regularly review various
Cycle Management and a portfolio approach to
portfolios of supply augmentation and demand
managing water supply and demand, means that
management options for a system. However,
dams will continue to play a principal role in
every urban water system is unique. Good, robust
meeting water needs.
collaborative planning between the industry,
regulators and communities is also required. In someREFERENCES
Barwon Water (2012), ‘Water supply demand Prime E, Leung A, Tran D, Gill H, Soloman D, Qiao G,
strategy 2012-2062’, Barwon Water. & Dagley I, (2012), ‘New technology to reduce
evaporation from large water storages’, Waterlines
Bureau of Meteorology (2011), ‘Special climate
Report, National Water Commission, vol. 80.
statement 24’, National Climate Centre, Bureau
of Meteorology. Productivity Commission 2011, Australlia’s Urban
Water Sector, Report No.55, Final Inquiry Report,
CSIRO and Bureau of Meteorology (2007), ‘Climate
Canberra.
change in Australia: technical report 2007’, CSIRO.
Rafter T & Abbs D (2009), ‘Calculation of Australian
CSIRO (2010), ‘Climate variability and change in
extreme rainfall within GCM simulations using Extreme
south-eastern Australia: A synthesis of findings
Value Analysis’, CAWCR Research Letters, 3:44-49.
from Phase 1 of the South Eastern Australian
Climate Initiative (SEACI)’, CSIRO. SA Water & University of South Australia (2009),
‘Briefing paper: investing in catchments as water
GWMWater (2011), ‘GWMWater Sustainability
infrastructure: the case of Blue Lake, Mount
Report 2010/11’.
Gambier’, this paper was produced as part of
Insurance Council of Australia (2013), ‘Historical the “Catchments as Assets” Project.
Data Statistics’, Insurance Council of Australia
Steffen W, Hughes L & Karoly D (2013), ‘The critical
Limited, . Westra, S., Evans, J.P., Mehrotra, R., and Sharma,
A. (2013), ‘A conditional disaggregation algorithm
IPCC (2012), ‘Managing the risks of extreme
for generating fine time-scale rainfall data in a
events and disasters to advance climate
warmer climate’, Journal of Hydrology, 479: 86-99.
change adaptation: a special report of the
Intergovernmental Panel on Climate Change’, Field WSAA (2012), ‘Climate change adaptation in the
C B, Barros V, Stocker T F, Qin D, Dokken D J, Ebi K L, Australian urban water industry’, Water Services
Mastrandrea M D, Mach, K J, Plattner G K, Allen S K, Association of Australia.
Tignor M, & Midgley P M (eds), Cambridge University
WSAA (2013), ‘Urban water security’, Water Services
Press, Cambridge, UK and New York, USA.
Association of Australia.
Melbourne Water (2008), Evaluating Melbourne
Yao X, Zhang H, Lemckert C, Brook A & Schouten
Water’s natural assets: preliminary investigation
P 2010, ‘Evaporation reduction by suspended
into the development of an evaluation methods,
and floating covers: overview, modelling and
Melbourne Water.
efficiency’, Urban Water Security Research Alliance
Technical Report No. 28.
PHOTOGRAPHY ACKNOWLEDGEMENTS
Sydney Water South East Water
Gippsland Water Sydney Catchment Authority
Queensland Urban Utilities Water Corporation
Barwon Water Unity Water
Coliban Water Seqwater
SA Water Western WaterMelbourne Office Sydney Office
Level 8 Suite 802 Suite 1 Level 30
401 Docklands Drive 9 Castlereagh Street
Docklands VIC 3008 Sydney NSW 2001
Telephone 03 8605 7666 GPO Box 915
Facsimile 03 8605 7612 Sydney NSW 2001
Telephone 02 9221 5966
Facsimile 02 9221 5977
Check website for new Sydney
office details after November 2013
info@wsaa.asn.au
www.wsaa.asn.au
Copyright This document is copyright. No part of this document may be
reproduced or transmitted apart from that permitted under the Copyright
Act 1968, without the express, written permission of the Water Services
Association of Australia Ltd.
Disclaimer The Water Services Association of Australia Ltd and individual
contributors are not responsible for the results of any actions taken on the
basis of information contained in this publication. WSAA and individual
contributors disclaim all and any liability to any person in respect of anything,
and the consequences of anything, done or omitted to be done by a person
in reliance upon the whole or part of this publication.
Water Services Association of Australia Ltd 2013 ALL RIGHTS RESERVEDYou can also read