Using Digital Technology to Protect Health in Prolonged Poor Air Quality Episodes: A Case Study of the AirRater App during the Australian 2019-20 ...
←
→
Page content transcription
If your browser does not render page correctly, please read the page content below
fire

Article
Using Digital Technology to Protect Health in
Prolonged Poor Air Quality Episodes: A Case Study of
the AirRater App during the Australian 2019–20 Fires
Sharon L. Campbell 1,2 , Penelope J. Jones 1 , Grant J. Williamson 3 , Amanda J. Wheeler 1,4 ,
Christopher Lucani 3 , David M. J. S. Bowman 3 and Fay H. Johnston 1,2, *
 1    Menzies Institute for Medical Research, University of Tasmania, 17 Liverpool St, Hobart,
      Tasmania 7000, Australia; sharon.campbell@utas.edu.au (S.L.C.); Penelope.jones@utas.edu.au (P.J.J.);
      amanda.wheeler@utas.edu.au (A.J.W.)
 2    Public Health Services, Department of Health (Tasmania), 25 Argyle St, Hobart, Tasmania 7000, Australia
 3    School of Natural Sciences, University of Tasmania, Sandy Bay Campus, Churchill Ave, Hobart,
      Tasmania 7001, Australia; grant.williamson@utas.edu.au (G.J.W.); christopher.lucani@utas.edu.au (C.L.);
      david.bowman@utas.edu.au (D.M.J.S.B.)
 4    Mary MacKillop Institute for Health Research, Australian Catholic University, 215 Spring St,
      Melbourne, Victoria 3000, Australia
 *    Correspondence: fay.johnston@utas.edu.au

 Received: 3 July 2020; Accepted: 2 August 2020; Published: 4 August 2020

 Abstract: In the southern hemisphere summer of 2019–20, Australia experienced its most severe
 bushfire season on record. Smoke from fires affected 80% of the population, with large and prolonged
 exceedances of the Australian National Air Quality Standard for fine particulate matter (PM2.5 )
 recorded in all major population centers. We examined if AirRater, a free smartphone app that reports
 air quality and tracks user symptoms in near real-time, assisted those populations to reduce their
 smoke exposure and protect their health. We distributed an online survey to over 13,000 AirRater
 users to assess how they used this information during the 2019–20 bushfire season, and why it
 was helpful to aid decision-making in reducing personal smoke exposure. We received responses
 from 1732 users (13.3%). Respondents reported the app was highly useful, supporting informed
 decision-making regarding daily activities during the smoke-affected period. Commonly reported
 activities supported by information provided through the app were staying inside (76%), rescheduling
 or planning outdoor activities (64%), changing locations to less affected areas (29%) and informing
 decisions on medication use (15%). Innovative and easy-to-use smartphone apps such as AirRater,
 that provide individual-level and location-specific data, can enable users to reduce their exposure to
 environmental hazards and therefore protect their health.

 Keywords: smoke; particulate matter; smartphone app; digital technology

1. Introduction
     Globally, landscape fires cause major environmental, economic, social and health impacts,
both through the direct effects of fire and from consequential negative impacts on air quality [1,2].
Climate projections indicate a substantially greater fire risk in the future, with a warming climate
driving conditions that precipitate landscape fires. These include more severe and prolonged droughts
resulting in increased fuel loads and increased efficiency of ignition sources, such as dry lightning [3,4].
As a result, future fires are likely to be more frequent, larger, longer and more often, with prolonged
and severe episodes of poor air quality more likely in many regions [5,6].

Fire 2020, 3, 40; doi:10.3390/fire3030040                                             www.mdpi.com/journal/fire
Fire 2020, 3, 40 2 of 12
These conditions have major implications for human health, as landscape fire smoke has a
well-established association with poor health outcomes—Johnston et al. estimated 339,000 deaths
annually are attributable to landscape fire smoke exposure worldwide [2]. Although landscape fire
smoke is complex in character and contains many chemicals harmful to health, the major component
affecting health is particulate matter less than 2.5 microns in diameter, or PM2.5 [2]. Effects on health are
especially pronounced for specific population groups, such as the elderly, the young, and for those with
existing medical conditions, including cardiovascular and respiratory conditions [7–12]. For example,
a study of landscape fire events in the state of Washington (USA) from 2006–2017 found a 35% increase
in the odds of same-day respiratory mortality for those aged 45–64 years when exposed to smoke from
landscape fires [13]. Additionally, research from the 2010 fires in Moscow showed excess deaths of
almost 11,000 during this period when compared to other periods without wildfires, and mostly from
older age groups and for those with existing cardiovascular and respiratory conditions [14]. There is
also some evidence for health impacts on pregnant women and their developing fetus [15,16].
Considering the interconnections between bushfire activity, climate change and health, there is an
urgent and increasing global need to develop and adopt public health communication tools, both at
the individual and the government/agency level, to assist vulnerable people to reduce their smoke
exposure and to manage their health during landscape fire events. The use of digital technology is one
possible adaptation solution, with smartphone apps playing a key and growing role in information
dissemination and communication during disasters [17].
In recent times, a plethora of digital services have become available allowing consumers to track
air quality. These include websites, and more commonly smartphone apps, that display air quality data
from around the world (for example, IQAir, AirMatters, BreezoMeter and PurpleAir) or for specific
locations (for example, SmokeSense in the United States and CanberraAir in Canberra, Australia).
These technologies gather data from a mix of regulatory government air quality monitoring networks
and/or low-cost air quality monitors, although difficulties ensuring the reliability and applicability of
low-cost air quality monitors remain [18]. Smartphone apps specifically have the potential to support
health during prolonged or extreme poor air quality events by providing vulnerable individuals with
easily accessible information to inform health-protecting behaviors (for example, staying indoors to
reduce exposure or taking preventative medications).
However, despite this proliferation, to date there has been a paucity of research on the efficacy
of smartphone apps to help individuals reduce their smoke exposure and manage their health
during extreme or prolonged smoke events, including analyzing factors that might be important in
determining usability.
1.1. AirRater App
AirRater is a free smartphone app developed by the University of Tasmania, launched in Tasmania
in October 2015 (see www.airrater.org). The app was designed to assist people vulnerable to poor air
quality to better manage their health. The app provides users with easily understood, near real-time
air quality information, including PM2.5 and temperature (gathered from official government sources)
and pollen (gathered from local pollen monitors where available). Users can enter their respiratory
symptoms (such as sneeze, wheeze or cough) into the app, which also records their location. Over time,
AirRater helps the user determine potential environmental triggers of their symptoms, and can send a
notification when these are recorded at high levels in the user’s current location, enabling the user to
take actions to protect their health. AirRater’s functionality, and capacity to identify local drivers of
respiratory disease are explained in detail elsewhere [19,20].
1.2. Research Aim
Using a case study approach, this study aims to investigate if digital technology (such as the
AirRater smartphone app, which provides user-friendly, real-time and location-specific air quality
information) is useful in helping individuals to reduce their smoke exposure and therefore protect theirFire 2020,
Fire 2020, 3,
3, 40
x FOR PEER REVIEW 33 of
of 12
12
information) is useful in helping individuals to reduce their smoke exposure and therefore protect
health during a period of prolonged poor air quality (as experienced in the Australian 2019–20 summer
their health during a period of prolonged poor air quality (as experienced in the Australian 2019–20
season). We specifically investigate: if AirRater was successful in reaching individuals vulnerable
summer season). We specifically investigate: if AirRater was successful in reaching individuals
to poor health outcomes during prolonged exposure to smoke; the types of impacts experienced by
vulnerable to poor health outcomes during prolonged exposure to smoke; the types of impacts
respondents; if information obtained through AirRater caused health protective behavior change and
experienced by respondents; if information obtained through AirRater caused health protective
the features of AirRater that most enabled ease of use.
behavior change and the features of AirRater that most enabled ease of use.
2. Materials and Methods
2. Materials and Methods
2.1. Study Setting
2.1. Study Setting
While fires are a common and well-established feature of the Australian forest landscape [21],
While fires
the complex are a common
of megafires whichand well-established
occurred feature of
across Australia’s the Australian
eastern forestSeptember
seaboard from landscape 2019
[21],
the complex of megafires which occurred across Australia’s eastern seaboard from September
to February 2020 was exceptional in terms of geographic scale, duration, severity and the size of the 2019
to February affected
population 2020 was[22].
exceptional in terms
Several other of geographic
large-scale scale,
fires also duration,
occurred severity
during thisand the size
period, of the
including
population
on Kangaroo affected
Island [22]. Several
in South other large-scale
Australia, fires also
and numerous firesoccurred during this
through Western period,(see
Australia including
Figureon1).
Kangaroo Island in South Australia, and numerous fires2 through Western Australia
Combined, these events burned approximately 97,000 km [23] and caused significant smoke exposure (see Figure 1).
Combined,
for the most these
densely events burned
populated approximately
regions of Australia,97,000
with largekm2exceedances
[23] and caused significantNational
of the Australian smoke
exposure for the most densely populated regions of Australia, with large exceedances
Air Quality Standard for particulate air pollution [24] occurring from days to months and affecting of 80%
the
Australian National Air Quality
of the Australian population [25]. Standard for particulate air pollution [24] occurring from days to
months and affecting 80% of the Australian population [25].
Figure 1.
Figure Fire boundaries
1. Fire boundaries for
for the
the Australian
Australian 2019
2019–20 fire season,
–20 fire season, within
within areas
areas classified
classified as
as temperate
temperate
forests and woodlands [26,27].
forests and woodlands [26,27].
Early research using statistical modelling estimates that smoke from this event was responsible
Early research using statistical modelling estimates that smoke from this event was responsible
for over 400 excess deaths, over 2000 hospitalizations for respiratory conditions and over 1000
for over 400 excess deaths, over 2000 hospitalizations for respiratory conditions and over 1000
hospitalizations for cardiovascular conditions [28]. This is compared to 35 deaths directly attributed to
hospitalizations for cardiovascular conditions [28]. This is compared to 35 deaths directly attributed
the bushfires [29].
to the bushfires [29].
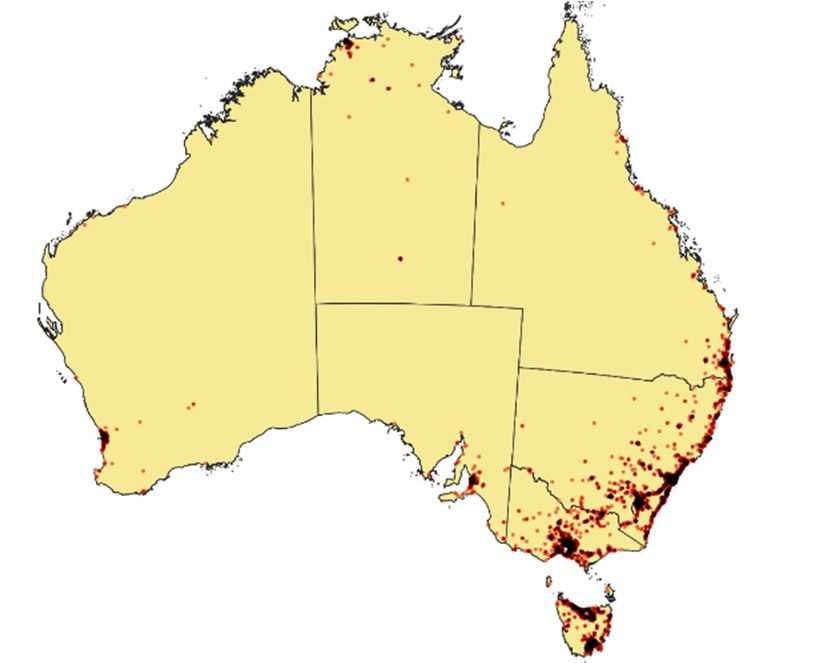
During the 2019–20 bushfire season, downloads of AirRater increased over five-fold from
During the 2019–20 bushfire season, downloads of AirRater increased over five-fold from pre-
pre-season levels (see Figure 2a), with substantial user downloads occurring outside the three
season levels (see Figure 2a), with substantial user downloads occurring outside the three
jurisdictions where AirRater is currently funded to operate (Tasmania, the Australian Capital Territory
jurisdictions where AirRater is currently funded to operate (Tasmania, the Australian Capital
and the Northern Territory) (see Figure 2b). This reflected the growing number and locations of people
Territory and the Northern Territory) (see Figure 2b). This reflected the growing number and
affected by fires and smoke throughout the season, especially in densely populated regions around
locations of people affected by fires and smoke throughout the season, especially in densely
Brisbane, Sydney and Melbourne.
populated regions around Brisbane, Sydney and Melbourne.Fire 2020, 3, 40 4 of 12
Fire 2020, 3, x FOR PEER REVIEW 4 of 12
(a) (b)
Figure
Figure 2. 2.
(a)(a) Number
Number of of AirRater
AirRater downloads
downloads from
from March
March 2019
2019 to to
FebFeb 2020.
2020. (b)(b)
MapMapof of Australia
Australia
showing
showing AirRater
AirRater downloads
downloads (as(as
of of 6 March
6 March 2020).
2020). The
The darker
darker areas
areas indicate
indicate a greater
a greater concentration
concentration
of of downloads.
downloads.
2.2. Study
2.2. Methodology
Study Methodology
During
During February
February 2020, anan
2020, online
onlinesurvey
survey request
requestwaswasemailed
emailed to to
13,162 AirRater
13,162 AirRater users
userswho had
who had
given
givenpermission
permission for for
follow-up
follow-upwhenwhen
registering for thefor
registering app,
theacross
app, six Australian
across jurisdictions
six Australian highly
jurisdictions
affected
highlyby the 2019–20
affected by the summer bushfire bushfire
2019–20 summer season: season:
New South NewWalesSouth(1849
Walesusers),
(1849 Queensland (204
users), Queensland
users),
(204 Victoria (1133 users),
users), Victoria (1133South Australia
users), (82 users),(82
South Australia West Australia
users), West(177 users) and
Australia (177the Australian
users) and the
Capital Territory
Australian (9717Territory
Capital users). Differences
(9717 users).in Differences
user numbers in across jurisdictions
user numbers acrossreflect the time reflect
jurisdictions the appthe
had been
time theavailable
app hadinbeen thatavailable
region, and the relative
in that region, populations of each
and the relative region that
populations ofwere
each smoke
region affected.
that were
The survey
smoke was open
affected. Thefor two weeks
survey and for
was open reached 13,021and
two weeks users, with a13,021
reached reminder sent
users, at day
with 10.
a reminder sent
Survey
at day 10. questions centered on three themes: the health of the respondent during the prolonged
smoke events
Surveyofquestions
summer 2019–20;
centeredhigh-efficiency
on three themes: particulate
the healthair of
(HEPA) room cleaner
the respondent purchase
during and use
the prolonged
and how the
smoke respondent
events of summer used the information
2019–20; provided
high-efficiency by AirRater.
particulate This paper
air (HEPA) focuses
room on two
cleaner of these
purchase and
themes: the health of respondents and AirRater use. A mix of qualitative and
use and how the respondent used the information provided by AirRater. This paper focuses on two quantitative questions
were used.themes:
of these A full the
list health
of survey questions and
of respondents andresponse
AirRateroptions
use. A mixcan ofbe qualitative
found in Supplementary
and quantitative
Materials
questions (S1). Survey
were responses
used. A full were downloaded
list of in CSV format.
survey questions R v3.5.3 [30]
and response was can
options usedbe to analyze
found in
quantitative data, while qualitative data were analyzed using thematic analysis.
Supplementary Materials (S1). Survey responses were downloaded in CSV format. R v3.5.3 [30] was
usedThetoUniversity of Tasmania
analyze quantitative Health
data, whileand Medical Human
qualitative data were Research
analyzed Ethics
usingCommittee approved
thematic analysis.
this research (reference number H0015006).
The University of Tasmania Health and Medical Human Research Ethics Committee approved
this research (reference number H0015006).
3. Results
3. Results
A total of 1732 survey responses were received, giving a response rate of 13.3%. The vast majority
(94.1%;An =total
1630)ofreplied to the survey
1732 survey questions
responses werefor themselves,
received, witha aresponse
giving minority rate
(4.3%; = 75) replying
ofn13.3%. The vast
onmajority
behalf of(94.1%;
someone they cared for (for example, a child). The remainder responded
n = 1630) replied to the survey questions for themselves, with a minority (4.3%;on behalf of an =
group, for example,
75) replying as anofeducator
on behalf someoneinthey
a day carefor
cared facility, as sportsa club
(for example, executive
child). or as a work
The remainder safetyon
responded
delegate for a work site, public amenity or at a public event.
behalf of a group, for example, as an educator in a day care facility, as sports club executive or as a
work safety delegate for a work site, public amenity or at a public event.
3.1. Health-Related Outcomes
3.1.The majority of Outcomes
Health-Related respondents (61.4%) identified one or more risk factors that could result in them
being more vulnerable to poor health as a result of prolonged smoke exposure. Most noteworthy was
The majority of respondents (61.4%) identified one or more risk factors that could result in them
having a pre-existing lung condition (35.9%), followed by being over 65 years (21.2%), noting that
being more vulnerable to poor health as a result of prolonged smoke exposure. Most noteworthy was
respondents could nominate more than one type of risk factor (see Figure 3).
having a pre-existing lung condition (35.9%), followed by being over 65 years (21.2%), noting that
respondents could nominate more than one type of risk factor (see Figure 3).Fire 2020, 3, 40 5 of 12
Fire 2020, 3, x FOR PEER REVIEW 5 of 12
Fire 2020, 3, x FOR PEER REVIEW 5 of 12
FigureFigure 3. Proportion
3. Proportion of respondents
of respondents reportinga arisk
reporting riskfactor
factor to
to smoke
smokeexposure.
exposure.
When Whenaskedasked
about
Figure about
3. symptoms
symptoms
Proportion related
related
of totosmoke
respondents smoke exposure,
exposure,
reporting the
the
a risk factor majority
to majority of respondents
of respondents
smoke exposure. (79.8%; n
(79.8%;
= 1382) reported that smoke from the bushfires had affected their health or the health of the person
n = 1382) reported that smoke from the bushfires had affected their health or the health of the person
they cared for, citing
When asymptoms
wide variety of symptoms. These included minor physical symptoms suchnas
they cared for, asked
citingabout
a wide variety related to smoke These
of symptoms. exposure, the majority
included minor of physical
respondents (79.8%;
symptoms such
irritated
= 1382) or drythat
reported throat
smoke (61.4%),
from irritated
the bushfiresor watery eyes (60.8%)
had affected and sneezing
their health (30.2%),
or the health of thethrough
personto
as irritated or
potentially
dry throat (61.4%), irritated or watery eyes (60.8%) and sneezing (30.2%), through to
they cared for,more
citingsevere
a wide physical
varietysymptoms
of symptoms. suchThese
as shortness
includedofminor
breath (37.7%)symptoms
physical and chest such
tightness
as
potentially more
(31.5%). severe or physical symptoms such as also
shortness of breath (37.7%) and withchest tightness
irritated orMental
dry throat mood-based symptoms
(61.4%), irritated were
or watery reported
eyes (60.8%) by sneezing
and respondents,(30.2%), almost
through half
to
(31.5%). Mental
potentially or
(46.6%) reporting mood-based
more severe feeling symptoms
anxious,
physical were
stressedsuch
symptoms also
or worried; reported
as shortness22.4% by respondents,
reporting
of breath feeling
(37.7%) with
andirritable, almost
angry orhalf
chest tightness
(46.6%) reporting
(31.5%). Mentalfeeling
short-tempered orand anxious,
21.3%
mood-based stressed
reporting feeling
symptoms orwere
worried;
depressed 22.4%
(see
also reported reporting
Figure noting feeling
by4,respondents, irritable,
respondents
with could angry
almost half or
report
more than
short-tempered
(46.6%) one 21.3%
and
reporting symptom).
feeling reporting
anxious, feeling
stresseddepressed
or worried; (see Figure
22.4% 4, noting
reporting respondents
feeling couldor
irritable, angry report
moreshort-tempered
than one symptom).and 21.3% reporting feeling depressed (see Figure 4, noting respondents could report
more than one symptom).
Figure 4. Symptoms reported as a result of smoke exposure.
Figure Symptoms
4. 4.
Figure Symptomsreported as aa result
reported as resultofofsmoke
smoke exposure.
exposure.Fire 2020, 3, 40 6 of 12
Fire 2020, 3, x FOR PEER REVIEW 6 of 12
Other symptoms reported (n = 143) included nose bleeds, nausea, flare-ups of asthma symptoms,
Other symptoms reported (n = 143) included nose bleeds, nausea, flare-ups of asthma symptoms,
chest pain, inability to sleep, tiredness and lethargy. Several respondents noted decreased mental
chest pain, inability to sleep, tiredness and lethargy. Several respondents noted decreased mental
health related to an inability to exercise safely, solastalgia, and stress related to previous bushfire
health related to an inability to exercise safely, solastalgia, and stress related to previous bushfire events.
events.
Approximately one third of respondents (32.6%) reported missing school or work as a result of
Approximately one third of respondents (32.6%) reported missing school or work as a result of
smoke and/or fires, with 7.2% reporting this occurred five times or more. For 6.5% of respondents,
smoke and/or fires, with 7.2% reporting this occurred five times or more. For 6.5% of respondents,
this was due to school or work being closed.
this was due to school or work being closed.
Approximately one third of respondents sought medical advice about their symptoms, with
Approximately one third of respondents sought medical advice about their symptoms, with
visiting a general practitioner (GP) (22.6%) and talking to a pharmacist (12%) the most prominent
visiting a general practitioner (GP) (22.6%) and talking to a pharmacist (12%) the most prominent
activities (see Figure 5, noting this reports only the types of medical advice when advice was sought).
activities (see Figure 5, noting this reports only the types of medical advice when advice was sought).
Several respondents sought online advice, searching information on minimizing smoke in the house;
Several respondents sought online advice, searching information on minimizing smoke in the house;
reading government advice and directives; using ‘Dr Google’ and researching international advice.
reading government advice and directives; using ‘Dr Google’ and researching international advice.
Some respondents left their place of residence to avoid smoke, for example, to an air-conditioned motel
Some respondents left their place of residence to avoid smoke, for example, to an air-conditioned
for an extended time, and other respondents reported seeking advice from complementary medicine
motel for an extended time, and other respondents reported seeking advice from complementary
practitioners. Two-thirds of respondents did not seek medical advice.
medicine practitioners. Two-thirds of respondents did not seek medical advice.
Figure 5. Types of medical advice sought for health conditions associated with smoke exposure.
Figure 5. Types of medical advice sought for health conditions associated with smoke exposure.
3.2. AirRater Use
3.2. AirRater Use
Almost 60% of respondents found AirRater ‘extremely useful’ or ‘very useful’ in helping to
Almost 60% ofassociated
manage symptoms respondents
withfound
smoke,AirRater ‘extremely
with a further 20.2%useful’
rating itoras‘very
‘quiteuseful’
useful’.inThe
helping to
features
manage symptoms
respondents associated
liked most aboutwith smoke,
AirRater with a further
included the map20.2% ratingair
showing it asquality
‘quite useful’. The features
information nearby
respondents liked most about AirRater included the map showing air quality information
(74.7%), the ability to save multiple locations (for example, both home and work) (43.7%) and automated nearby
(74.7%), the when
notifications abilitysmoke
to save multiple
levels locations
were elevated (for example,
(37.8%) both
(see Figure homerespondents
6, noting and work) could(43.7%) and
choose
automated notifications when smoke levels were elevated (37.8%) (see Figure 6, noting respondents
multiple features).
could choose multiple features).Fire 2020, 3, 40 7 of 12
Fire 2020, 3, x FOR PEER REVIEW 7 of 12
Fire 2020, 3, x FOR PEER REVIEW 7 of 12
Figure 6. Features of AirRater most liked by respondents.
Figure 6. Features of AirRater most liked by respondents.
Other AirRater features liked by respondents included having access to near real-time updates
Other AirRater
(1-h average updatesfeatures liked
Figure
as opposed toby respondents
6. Features
24-h
of AirRaterincluded
most liked having
rolling averages access toby
by respondents.
typically reported near real-timeagencies);
regulatory updates
(1-h average
the abilityOther updates
to easily as opposed
seefeatures
air quality to 24-h rolling averages typically reported by regulatory agencies);
AirRater likedinformation
by respondents in included
multiplehaving
locations
access and seeing
to near air quality
real-time updates trends.
the ability
Respondent to easily
statements see air quality information in multiple locations and seeing air quality trends.
(1-h average updatessupporting
as opposed to these
24-hpreferences
rolling averagescan typically
be foundreported
in Supplementary
by regulatoryMaterial
agencies);(S2).
Respondent
A statements supporting these preferences canthe
beapp,
found in Supplementary Material (S2).
thesmall percentage
ability to easily seeof respondents (4.3%)
air quality information did not like
in multiple citing
locations andtechnical reasons.
seeing air qualityRespondents
trends.
who A small
Respondent
liked some percentage
statements
features of ofthe
respondents
supporting
app also (4.3%) didcan
thesecommented
preferences not
on be like the
found
technical app, citing
in difficulties
Supplementary technical reasons.
Material (S2).
experienced at times.
Respondents A who
small liked
percentage some
of features
respondents of the
(4.3%) app
did also
not likecommented
the app, on
citing
Some respondents commented on the reliability of the air quality data in their region as a limitation of technical
technical difficulties
reasons.
experienced
Respondents
the app. at times.
whoSome likedrespondents
some features commented
of the app onalso
the reliability
commentedof on thetechnical
air quality data in their
difficulties
region as a limitation
experienced of
at times. the
Someapp.respondents commented on the reliability of the air quality data in their
When asked how information from AirRater was used, almost 95% of respondents reported
region asked
as a limitation of the app. from AirRater was used, almost 95% of respondents reported they
they When
changed onehow information
or more behaviors to reduce their smoke exposure. Over three-quarters (75.9%) of
changed When asked
onestayed
or more how information
behaviors to from
reduceAirRater
theirwas used,exposure.
smoke almost 95%Over of respondents reported
three-quarters they of
(75.9%)
respondents
changed one or
indoors,
more
and around
behaviors to
two-thirds
reduce their
(66.2%)exposure.
smoke
of respondents
Over
used AirRater
three-quarters
to determine
(75.9%) of to
respondents
whenrespondents
stayed
it was beststayed
indoors,
to close
and their
around two-thirds (66.2%) Justof respondents used (64.1%)
AirRater
indoors, and around two-thirds (66.2%) of respondents used AirRater to used
or open windows and doors. under two-thirds
determine
AirRater
when it wastobest
information
to close or open their
reschedule
their windowsactivities,
and doors. Justjust under two-thirds (64.1%)
determine when it was best to closeororplan
open their outdoor
windows and doors.while over one-fifth
Just under two-thirds (20.7%)
(64.1%)
used AirRater information to reschedule or plan their outdoor activities, while just over one-fifth
were used
moreAirRater
aware ofinformation
the link between air quality and their own health (see Figure 7, noting
to reschedule or plan their outdoor activities, while just over one-fifth respondents
(20.7%) were more aware of of
thethe
link
linkbetween
between air
air quality andtheir
theirownown health(see(see Figure 7, noting
could(20.7%)
choosewere more
multiple aware
options). quality and health Figure 7, noting
respondents could choose multiple
respondents could choose multiple options). options).
7. Behavior
FigureFigure changes
7. Behavior as aasresult
changes of of
a result local information
local information provided byAirRater.
provided by AirRater.
Figure 7. Behavior changes as a result of local information provided by AirRater.Fire 2020, 3, 40 8 of 12
Fire 2020, 3, x FOR PEER REVIEW 8 of 12
Other behavior
Other behavior changes
changes informed
informed by by the
the app
app aimed
aimed atat reducing
reducing smoke
smoke exposure
exposure included:
included:
deciding on
deciding onexercise
exerciseplans;
plans; deciding
deciding on on
workwork patterns;
patterns; deciding
deciding whenwhen to awear
to wear a faceand
face mask mask and
helping
helping to explain or inform others of the situation. Respondent statements
to explain or inform others of the situation. Respondent statements supporting these behavior changessupporting these
behavior
can changes
be found can be found in
in Supplementary Supplementary
Material (S2). Material (S2).
Over two-thirds
Over two-thirds(69.5%)
(69.5%) of of respondents
respondents alsoalso
soughtsought air quality
air quality information
information from alternate
from alternate sources.
sources. These included various state government air quality and health websites
These included various state government air quality and health websites (e.g., ACT Health, Victoria (e.g., ACT Health,
Victoria Environment Protection Authority and New South Wales Department
Environment Protection Authority and New South Wales Department of Planning, Industry and of Planning, Industry
and Environment),
Environment), otherand
other apps apps and websites
websites (e.g., AirVisual,
(e.g., AirVisual, CanberraAir,CanberraAir, AQICN, AirMatters)
AQICN, PurpleAir, PurpleAir,
AirMatters) and traditional news sources such as radio, TV and online. Checking
and traditional news sources such as radio, TV and online. Checking the visibility of nearby landmarks the visibility of
nearby
and landmarks
viewing and viewing
and smelling and smelling
the air were also usedthe air were also
in conjunction withused in conjunction
formal governmentwith formal
sources.
government sources.
When asked about the features of the app or website users found most useful, ease of use and
When asked
navigation about
(45.7%), easethe
of features of the app
understanding or website(43.6%)
information users found most useful,
and access to nearease of usedata
real-time and
navigation
(40.9%) were(45.7%),
cited asease of understanding
the top three features (see information (43.6%)respondents
Figure 8, noting and accesscould
to near real-time
choose data
more than
(40.9%) were cited as the top three features (see Figure 8, noting respondents could
one response). Trustworthiness of information (31.8%) and access to local information (30.8%) were choose more than
one response).
also important.Trustworthiness of information (31.8%) and access to local information (30.8%) were
also important.
Figure 8. Features of information source most liked by respondents.
Figure 8. Features of information source most liked by respondents.
4. Discussion and Conclusions
4. Discussion and Conclusions
Our study shows that prolonged and severe smoke events, such as those occurring in Australia
over Our study shows
the 2019–20 summer thatseason,
prolongedhaveand severe smoke
substantial events, such
and potentially as those
serious healthoccurring in Australia
and social impacts
over the 2019–20 summer season, have substantial and potentially serious
mainly for vulnerable individuals. Our results further demonstrate the AirRater smartphone health and social impacts
app
mainly for vulnerable individuals. Our results further demonstrate the AirRater
supported these individuals to make decisions to reduce their smoke exposure. This suggests that digital smartphone app
supported these individuals to make decisions to reduce their smoke exposure. This
technologies such as AirRater, that provide easily interpreted, reliable, real-time and location-specific suggests that
digital
air technologies
quality information,such areasuseful
AirRater, that provide
in helping easilyindividuals
vulnerable interpreted,
toreliable, real-time
make decisions and reducing
about location-
specific
their air quality
smoke exposureinformation,
and protectingare useful
their in helping
health vulnerable
during individuals
these types of events. to make decisions about
reducing their smoke exposure and protecting their health during these
Behaviors such as staying indoors, limiting exercise on days of poor air quality, types of events.
and reducing the
Behaviors
movement such
of air from asoutdoors
staying indoors, limiting
to indoors exercisedoors
(i.e., closing on days
andof poor air quality,
windows) and reducing
have previously been
the movement of air from outdoors to indoors (i.e., closing doors and windows)
identified by Laumbach et al. [31], as measures that successfully reduce smoke exposure. In addition,have previously been
identified by Laumbach et al. [31], as measures that successfully reduce smoke exposure.
health protection measures such as using preventive medications, visiting air-conditioned buildings and In addition,
health protection
wearing face masks,measures such as been
have similarly usingidentified
preventive by medications,
Vardoulakis etvisiting
al. [32],air-conditioned buildings
as behaviors supporting
and wearing face masks, have similarly been identified by Vardoulakis et al. [32], as behaviors
supporting reduced smoke exposure. These measures are strongly recommended by public healthFire 2020, 3, 40 9 of 12
reduced smoke exposure. These measures are strongly recommended by public health authorities
(for example, New South Wales Department of Health [33] and the Centre for Air Pollution, Energy
and Health Research [34]). Survey respondents report these types of behavior changes based on air
quality information supplied by AirRater, demonstrating that when individuals have access to relevant
and accurate information, they are able to act on the recommended advice to protect their health.
Furthermore, the most-liked features of air quality information sources highlighted by survey
respondents demonstrate that easy to understand, timely, localized and trusted information is critical to
decision-making. These information characteristics are strongly recommended by Vardoulakis et al. [32]
to manage health risks due to smoke exposure, and are highlighted as key features of smartphone
apps for asthma management [35].
Our key finding—that apps with features such as AirRater can reduce smoke exposure and support
health management during poor air quality events—is potentially generalizable across regions where
landscape fire smoke poses a potential health risk. For example, this has been demonstrated by the
Smoke Sense app in the United States [36]. However, these regions must have robust, supported and
widely distributed air quality monitoring networks and a reliable population-wide internet connection.
As we found in our study, there are limits to usability when lack of reliable air quality data leads to
unreliable information. A further caveat is that our findings likely reflect utility amongst a subset of
the population, as AirRater’s overall user base is more likely to be drawn from those with a concern
about air quality and health impacts. Furthermore, the AirRater user base (or the user base for any air
quality information app) is more likely to include those with adequate digital, health and language
literacy to facilitate downloading an app and understanding the information, and sufficient economic
and social means to act or change behaviors based on that information [19].
While our study specifically examined the use of AirRater during an extreme event, the findings
are broadly consistent with previous evaluations of the app that focused on app use during periods with
no major air quality exceedances, or in more predictable periods of poor air quality, such as increased
seasonal pollen loads, increased smoke as a result of planned burns, and urban air pollution caused
by winter wood heater use. These evaluations found that users had still applied app information to
support health-promoting decisions about their home environment, activities and medication use [19].
Our findings on the prevalence and nature of the health impacts experienced during the 2019–20
summer are also consistent with the FluTracking survey [37] and the Asthma Australia survey [38],
which investigated the extent to which respondents experienced health symptoms as a result of smoke
exposure over the course of summer 2019–20.
Strengths of our study include the timing of survey, which was distributed, responded to and
closed before COVID-19 became a widespread public health emergency in Australia. The responses
therefore reflect participant views in the few weeks between the bushfire and smoke crisis and the
COVID-19 pandemic, with subsequent surveys on the fire season unlikely to yield similar results.
Our study is limited by self-reporting bias and is likely to be completed by those with a strong interest
in health and air quality, and more likely to be completed by those with higher levels of literacy as
discussed earlier.
While accurate air quality information is clearly helpful for individual decision making, delivery
of this information via digital technology is heavily reliant on a reliable internet connection and a
level of literacy and numeracy that enables decision-making to be effective. Where this is not the case,
consistent public health advice, distributed through multiple networks that do not rely on reliable
internet connections and high levels of literacy, is paramount [39]. Solutions to these issues deserve
further attention by researchers and policymakers.
Our findings also highlight the ongoing role that access to reliable and accurate public health
information plays in a natural disaster. While Finch et al. [40] show that social media potentially has
several beneficial roles in these circumstances, the specific use of smartphone apps in natural disaster
and emergency response situations deserves greater research and policy consideration. For example,
further investigation is needed into the health economic benefits of providing timely and accurateFire 2020, 3, 40 10 of 12
air quality information and public health advice, which allows health protective behaviors to occur,
as opposed to an increased load on emergency services in response to smoke exposure.
In summary, digital technology such as the AirRater smartphone app appears to be highly useful
to inform individual decision-making aimed at protecting health during periods of prolonged and
severe poor air quality, such as those experienced in the 2019–20 Australian bushfires. With increasing
likelihood of these types of events globally due to a warming climate, the expansion of technologies
such as AirRater, coupled with investment in robust air quality monitoring networks, is likely to bring
greater benefits to vulnerable individuals in affected communities around the world.
Supplementary Materials: The following are available online at http://www.mdpi.com/2571-6255/3/3/40/s1,
S1: Survey questions and response options; S2: Respondent statements.
Author Contributions: Conceptualization, S.L.C., P.J.J., A.J.W. and F.H.J.; Data curation, S.L.C. and G.J.W.; Formal
analysis, S.L.C.; Funding acquisition, P.J.J., A.J.W. and F.H.J.; Investigation, S.L.C.; Methodology, S.L.C.; Project
administration, S.L.C.; Resources, G.J.W. and C.L.; Software, S.L.C., G.J.W. and C.L.; Supervision, F.H.J.; Validation,
S.L.C. and P.J.J.; Visualization, D.M.J.S.B. and F.H.J.; Writing—original draft, S.L.C.; Writing—review and editing,
S.L.C., P.J.J., G.J.W., A.J.W., C.L., D.M.J.S.B. and F.H.J. All authors have read and agreed to the published version of
the manuscript.
Funding: The first author is supported through the Australian Postgraduate Award and the Antarctic Climate
and Ecosystems Cooperative Research Centre (ACE CRC). AirRater is a free public health intervention financially
supported by the University of Tasmania and various state government agencies (Tasmanian Department of
Health, ACT Health and the Northern Territory Environmental Protection Authority). AirRater acquires health
data with the user’s explicit consent in accordance with human ethics approvals.
Acknowledgments: This work was supported by the Menzies Institute for Medical Research (University of
Tasmania) and the Antarctic Climate and Ecosystems Cooperative Research Centre. R packages used in the
analysis and presentation of results include ggplot2, dplyr, tidyverse and scales, with thanks to the authors of
these packages. Thank you to the many AirRater users who responded to the survey, and all users, staff and
volunteers who have provided valuable input throughout the life of the AirRater project. Our thoughts are with
the many Australians who lost their lives, homes and properties, and suffered poor health outcomes as a result of
this fire event.
Conflicts of Interest: The authors declare no conflict of interest. The funders had no role in the design of the
study; in the collection, analyses, or interpretation of data; in the writing of the manuscript, or in the decision to
publish the results.
References
1. Bowman, D.M.J.S.; Williamson, G.J.; Abatzoglou, J.T.; Kolden, C.A.; Cochrane, M.A.; Smith, A.M.S. Human
exposure and sensitivity to globally extreme wildfire events. Nat. Ecol. Evol. 2017, 1, 0058. [CrossRef]
[PubMed]
2. Johnston, F.H.; Henderson, S.B.; Chen, Y.; Randerson, J.T.; Marlier, M.; DeFries, R.S.; Kinney, P.;
Bowman, D.M.J.S.; Brauer, M. Estimated Global Mortality Attributable to Smoke from Landscape Fires.
Environ. Health Perspect. 2012, 120, 695–701. [CrossRef] [PubMed]
3. Dowdy, A.J.; Mills, G.A. Atmospheric States Associated with the Ignition of Lightning-Attributed Fires; The Centre
for Australian Weather and Climate Research: Melbourne, Victoria, Australia, 2009.
4. Nolan, R.H.; Boer, M.M.; Collins, L.; Resco de Dios, V.; Clarke, H.; Jenkins, M.; Kenny, B.; Bradstock, R.A.
Causes and consequences of eastern Australia’s 2019–20 season of mega-fires. Glob. Chang. Biol. 2020, 26,
1039–1041. [CrossRef] [PubMed]
5. Clarke, H.; Evans, J.P. Exploring the future change space for fire weather in southeast Australia.
Theor. Appl. Climatol. 2019, 136, 513–527. [CrossRef]
6. Intergovernmental Panel on Climate Change. Climate Change and Land: An IPCC Special Report on Climate
Change, Desertification, Land Degradation, Sustainable Land Management, Food Security, and Greenhouse
Gas Fluxes in Terrestrial Ecosystems. Available online: www.ipcc.ch/srccl/ (accessed on 23 May 2020).
7. Leibel, S.; Nguyen, M.; Brick, W.; Parker, J.; Ilango, S.; Aguilera, R.; Gershunov, A.; Benmarhnia, T. Increase
in Pediatric Respiratory Visits Associated with Santa Ana Wind–Driven Wildfire Smoke and PM2.5 Levels in
San Diego County. Ann. Am. Thorac. Soc. 2020, 17, 313–320. [CrossRef]Fire 2020, 3, 40 11 of 12
8. Morgan, G.; Sheppeard, V.; Khalaj, B.; Ayyar, A.; Lincoln, D.; Jalaludin, B.; Beard, J.; Corbett, S.; Lumley, T.
Effects of Bushfire Smoke on Daily Mortality and Hospital Admissions in Sydney, Australia. Epidemiology
2010, 21, 47–55. [CrossRef]
9. Borchers Arriagada, N.; Horsley, J.A.; Palmer, A.J.; Morgan, G.G.; Tham, R.; Johnston, F.H. Association
between fire smoke fine particulate matter and asthma-related outcomes: Systematic review and meta-analysis.
Environ. Res 2019, 179, 108777. [CrossRef]
10. Cascio, W.E. Wildland fire smoke and human health. Sci. Total Environ. 2018, 624, 586–595. [CrossRef]
11. Hystad, P.; Larkin, A.; Rangarajan, S.; AlHabib, K.F.; Avezum, Á.; Calik, K.B.T.; Chifamba, J.; Dans, A.;
Diaz, R.; du Plessis, J.L.; et al. Associations of outdoor fine particulate air pollution and cardiovascular
disease in 157 436 individuals from 21 high-income, middle-income, and low-income countries (PURE): A
prospective cohort study. Lancet Planet. Health 2020, 4, e235–e245. [CrossRef]
12. Pope, C.A.; Brook, R.D.; Burnett, R.T.; Dockery, D.W. How is cardiovascular disease mortality risk affected
by duration and intensity of fine particulate matter exposure? An integration of the epidemiologic evidence.
Air Qual. Atmos. Health 2011, 4, 5–14. [CrossRef]
13. Doubleday, A.; Schulte, J.; Sheppard, L.; Kadlec, M.; Dhammapala, R.; Fox, J.; Busch Isaksen, T.
Mortality associated with wildfire smoke exposure in Washington state, 2006–2017: A case-crossover
study. Environ. Health 2020, 19, 4. [CrossRef] [PubMed]
14. Shaposhnikov, D.; Revich, B.; Bellander, T.; Bedada, G.B.; Bottai, M.; Kharkova, T.; Kvasha, E.; Lezina, E.;
Lind, T.; Semutnikova, E.; et al. Mortality Related to Air Pollution with the Moscow Heat Wave and Wildfire
of 2010. Epidemiology 2014, 25, 359–364. [CrossRef] [PubMed]
15. Holstius, D.M.; Reid, C.E.; Jesdale, B.M.; Morello-Frosch, R. Birth weight following pregnancy during the
2003 Southern California wildfires. Environ. Health Perspect. 2012, 120, 1340–1345. [CrossRef] [PubMed]
16. Melody, S.M.; Ford, J.B.; Wills, K.; Venn, A.; Johnston, F.H. Maternal exposure to fine particulate matter
from a large coal mine fire is associated with gestational diabetes mellitus: A prospective cohort study.
Environ. Res. 2020, 183, 108956. [CrossRef] [PubMed]
17. Tan, M.L.; Prasanna, R.; Stock, K.; Hudson-Doyle, E.; Leonard, G.; Johnston, D. Mobile applications in crisis
informatics literature: A systematic review. Int. J. Disaster Risk Reduct. 2017, 24, 297–311. [CrossRef]
18. Karagulian, F.; Barbiere, M.; Kotsev, A.; Spinelle, L.; Gerboles, M.; Lagler, F.; Redon, N.; Crunaire, S.;
Borowiak, A. Review of the Performance of Low-Cost Sensors for Air Quality Monitoring. Atmosphere 2019,
10, 506. [CrossRef]
19. Johnston, F.H.; Wheeler, A.J.; Williamson, G.J.; Campbell, S.L.; Jones, P.J.; Koolhof, I.S.; Lucani, C.;
Cooling, N.B.; Bowman, D.M.J.S. Using smartphone technology to reduce health impacts from atmospheric
environmental hazards. Environ. Res. Lett. 2018, 13, 044019. [CrossRef]
20. Jones, P.J.; Koolhof, I.S.; Wheeler, A.J.; Williamson, G.J.; Lucani, C.; Campbell, S.L.; Bowman, D.M.J.S.;
Johnston, F.H. Can smartphone data identify the local environmental drivers of respiratory disease?
Environ. Res. 2020, 182, 109118. [CrossRef]
21. Bradstock, R.; Gill, A.M.; Williams, R. Flammable Australia. Fire Regimes, Biodiversity and Ecosystems in a
Changing World, 2nd ed.; CSIRO Publishing: Melbourne, Australia, 2012.
22. Boer, M.M.; Resco de Dios, V.; Bradstock, R.A. Unprecedented burn area of Australian mega forest fires.
Nat. Clim. Chang. 2020, 10, 171–172. [CrossRef]
23. Ward, M.; Tulloch, A.I.T.; Radford, J.Q.; Williams, B.A.; Reside, A.E.; Macdonald, S.L.; Mayfield, H.J.;
Maron, M.; Possingham, H.P.; Vine, S.J.; et al. Impact of 2019–2020 mega-fires on Australian fauna habitat.
Nat. Ecol. Evol. 2020. [CrossRef]
24. Australian Government. National Standards for Criteria Air Pollutants in Australia.
Available online: www.environment.gov.au/protection/publications/factsheet-national-standards-criteria-
air-pollutants-australia (accessed on 29 May 2020).
25. Johnston, F.H.; Borchers-Arriagada, N.; Morgan, G.G.; Jalaludin, B.; Palmer, A.J.; Williamson, G.J.;
Bowman, D.M.J.S. Unprecedented health costs of bushfire-related PM2.5 from the 2019-20 Australian
megafires. Nat. Sustain. in press.
26. Australian Government Department of Agriculture Water and the Environment. National Indicative Aggregated
Fire Extent Dataset v20200525; Commonwealth of Australia: Canberra, Australia, 2020.
27. United States Geological Survey. Global Land Cover Characterization; U.S. Department of the Interior:
Washington, DC, USA, 2020.Fire 2020, 3, 40 12 of 12
28. Borchers Arriagada, N.; Palmer, A.J.; Bowman, D.M.; Morgan, G.G.; Jalaludin, B.B.; Johnston, F.H.
Unprecedented smoke-related health burden associated with the 2019–20 bushfires in eastern Australia.
Med. J. Aust. 2020. [CrossRef] [PubMed]
29. Coates, L. Bushfire Deaths in Australia, 2010–2020. Available online: https://riskfrontiers.com/bushfire-
deaths-in-australia-2010-2020 (accessed on 24 May 2020).
30. R Core Team. R: A Language and Environment for Statistical Computing. Available online: https:
//www.R-project.org/ (accessed on 1 March 2020).
31. Laumbach, R.; Meng, Q.; Kipen, H. What can individuals do to reduce personal health risks from air
pollution? J. Thorac. Dis. 2015, 7, 96–107. [CrossRef] [PubMed]
32. Vardoulakis, S.; Jalaludin, B.B.; Morgan, G.G.; Hanigan, I.C.; Johnston, F.H. Bushfire smoke: Urgent need for
a national health protection strategy. Med. J. Aust. 2020, 212, 349–353.e1. [CrossRef] [PubMed]
33. NSW Health. Protect Yourself from Bushfire Smoke. Available online: www.health.nsw.gov.au/environment/
air/Pages/bushfire-protection.aspx (accessed on 13 June 2020).
34. Centre for Air Pollution Energy and Health Research. Bushfire Smoke: What are the Health Impacts and What can
We do to Minimise Exposure? Centre for Air Pollution Energy and Health Research: Sydney, Australia, 2019.
35. Kenner, A. Asthma on the move: How mobile apps remediate risk for disease management. Health Risk Soc.
2016, 17, 510–529. [CrossRef]
36. Rappold, A.G.; Hano, M.C.; Prince, S.; Wei, L.; Huang, S.M.; Baghdikian, C.; Stearns, B.; Gao, X.; Hoshiko, S.;
Cascio, W.E.; et al. Smoke Sense Initiative Leverages Citizen Science to Address the Growing Wildfire-Related
Public Health Problem. GeoHealth 2019, 3, 443–457. [CrossRef] [PubMed]
37. Howard, Z.; Carlson, S.; Baldwin, Z.; Johnston, F.; Durrheim, D.; Dalton, C. High community burden of
smoke-related symptoms in the Hunter and New England regions during the 2019–2020 Australian bushfires.
Public Health Res. Pract. 2020. [CrossRef]
38. Asthma Australia. Bushfire Smoke Impact Survey 2019-2020; Asthma Australia: Sydney, Australia, 2020.
39. Marfori, M.T.; Campbell, S.L.; Garvey, K.; McKeown, S.; Veitch, M.; Wheeler, A.J.; Borchers-Arriagada, N.;
Johnston, F.H. Public health messaging during extreme smoke events: Are we hitting the mark? Front. Public
Health under review.
40. Finch, K.C.; Snook, K.R.; Duke, C.H.; Fu, K.-W.; Tse, Z.T.H.; Adhikari, A.; Fung, I.C.-H. Public health
implications of social media use during natural disasters, environmental disasters, and other environmental
concerns. Nat. Hazards 2016, 83, 729–760. [CrossRef]
© 2020 by the authors. Licensee MDPI, Basel, Switzerland. This article is an open access
article distributed under the terms and conditions of the Creative Commons Attribution
(CC BY) license (http://creativecommons.org/licenses/by/4.0/).You can also read


