Understanding the effect of temperature and time on protein degree of hydrolysis and lipid oxidation during ensilaging of herring Clupea ...
←
→
Page content transcription
If your browser does not render page correctly, please read the page content below
www.nature.com/scientificreports

            OPEN           Understanding the effect of
                           temperature and time on protein
                           degree of hydrolysis and lipid
                           oxidation during ensilaging of
                           herring (Clupea harengus) filleting
                           co-products
                           Mursalin Sajib1 ✉, Eva Albers2, Markus Langeland3 & Ingrid Undeland1

                           The aims of this study were to investigate the effect of temperature, time and stirring on changes
                           in protein degree of hydrolysis (DH), free amino acids (FAA), lipid oxidation and total volatile basic
                           nitrogen (TVB-N) during ensilaging of herring (Clupea harengus) filleting co-products. Results showed
                           that temperature and time, and in some cases the interaction effect between these two factors,
                           significantly influenced all the studied responses. Increasing ensilaging temperature and time from
                           17 to 37 °C and 3 to 7 days, respectively, increased DH, FAA, and TVB-N content from 44.41 to
                           77.28%, 25.31 to 51.04 mg/g, and 4.73 to 26.25 mg/100 g, respectively. The lipid oxidation marker
                           2-thiobarbituric acid reactive substances (TBARS) did not increase with time at temperatures above
                           22 °C, while 2-pentylfuran increased up to 37 °C. Based on the process parameters and responses
                           investigated in this study, and considering energy requirements, it was suggested to perform ensilaging
                           at ambient temperatures (i.e. around 20 °C) with continuous stirring at 10 rpm for 1-3 days; the exact
                           length being determined by the desired DH.

                           Along with population growth and an increased awareness about the role of protein in a healthy diet, the demand
                           for seafood convenience products is steadily growing1–6. As a result, around 70% of all caught/farmed fish is today
                           processed before final sale, in turn generating around 20–80% co-products depending on the type of fish and level
                           of processing7. These co-products can be valorized to feed or potentially to food ingredients by ensilaging, which
                           according to the definition of green chemistry proposed by Anastas and Warner8, can be described as a “green”
                           process. Ensilaging has several advantages over e.g. fishmeal production such as lower energy and investment
                           requirements, and the flexibility to start the process even in smaller scales at small fish processing sites where fish-
                           meal production is not economically feasible9–11. Another important aspect is that an acid preserved ensilaging
                           product (i.e. silage) does not putrefy and is considered as almost sterile9. Ensilaging can thus be used to stabilize
                           sensitive fish co-products right after their generation.
                               The principle of ensilaging is quite simple; minced fish co-products are mixed with organic acids (e.g. formic
                           acid) to lower the pH to a value below 4.0, which preserves co-products against bacterial growth and at the same
                           time induces endogenous protease-mediated autolysis10. Several studies have reported positive outcomes in ani-
                           mals using silage in their diet12,13, e.g. improved growth performance, immunological status, health and welfare,
                           which is believed to be due to the short-chain peptide contents of silage. Further, the amino nitrogen is more
                           readily absorbed from short-chain peptides (2–6 amino acids) than from the corresponding protein or free amino

                           1
                            Food and Nutrition Science, Department of Biology and Biological Engineering, Chalmers University of Technology,
                           SE-41296, Gothenburg, Sweden. 2Industrial Biotechnology, Department of Biology and Biological Engineering,
                           Chalmers University of Technology, SE-41296, Gothenburg, Sweden. 3Department of Animal Nutrition and
                           Management, Swedish University of Agricultural Sciences, SE-75007, Uppsala, Sweden. ✉ e-mail: mursalin@
                           chalmers.se

Scientific Reports |   (2020) 10:9590 | https://doi.org/10.1038/s41598-020-66152-0                                                               1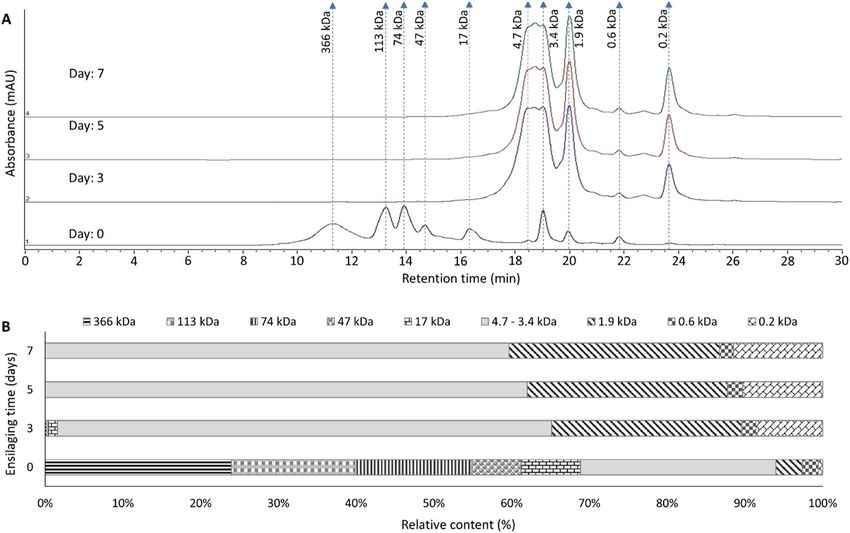
www.nature.com/scientificreports/                                                              www.nature.com/scientificreports

                           Figure 1. Herring filleting co-products and glass reactors used to produce silage.

                           acid (FAA) mixtures14–16; the latter being due to the higher osmotic pressure of FAA than peptides17,18. Excessive
                           FAA can also reduce the protein turnover since amino acids are used for energy metabolism instead of protein
                           synthesis19,20.
                                Besides proteins, fish silage also contains polyunsaturated fatty acids (PUFAs) which are highly susceptible
                           to oxidation21. An oxidized silage may result in e.g. a lower feed conversion ratio, loss of appetite, and reduced
                           carcass quality as noticed for fish and broilers9. Considering upgrading of silage to food, lipid oxidation is indeed
                           also a major factor reducing the sensorial quality. Similarly, high levels of total volatile basic nitrogen (TVB-N),
                           reflecting e.g. formation of volatile amines as trimethylamine nitrogen (TMA-N), can have negative consequences
                           both on the nutritional and sensorial value of silage; the former due to decrease in protein content22,23.
                                Despite these negative consequences of too high levels of FAA, lipid oxidation products and TVB-N16,24; very
                           little research has been done to date to optimize the ensilaging process to achieve a desired degree of protein
                           hydrolysis (DH) while keeping the unwanted formation of FAA, lipid oxidation and TVB-N to a minimum. The
                           few studies available on fish silage only comprise analyses of DH and the classic 2-thiobarbituric acid reactive
                           substances (TBARS) to monitor the extent of protein hydrolysis and lipid oxidation, respectively22,25,26; however,
                           no studies reported the tuning of the process to minimize negative side reactions. To succeed here, there is a need
                           to deepen current understanding of the ensilaging process and the multiple (bio)chemical reactions it comprises.
                                One-parameter-at-a-time is the most traditional approach to investigate the effect of process parameters on
                           desired responses. Although this approach is quite simplistic and easy to perform, it is time consuming and lacks
                           the functionality to explore the (potential) interaction effect between parameters. To solve this problem, response
                           surface methodology (RSM) is widely used both in industry and research, which helps to develop a functional
                           relationship between a response and studied parameters, and find the optimum operating conditions27. In RSM,
                           Box-Behnken design (BBD) is one of the most commonly used experimental designs which allows to investigate
                           both individual and interaction effect of process parameters in three-level factorial designs, while keeping the
                           number of experimental runs to a minimum28. To the best of our knowledge, no previous study has reported on
                           the application of BBD to optimize ensilaging of fish filleting co-products.
                                The main aims of this study were to: (a) investigate the effect of temperature, time and stirring on DH and
                           lipid oxidation during ensilaging of herring (Clupea harengus) co-products, and (b) find an optimum process
                           setting using BBD to achieve a maximum DH while keeping the formation of lipid oxidation, FAA and TVB-N
                           to a minimum. To get detailed information about the protein hydrolysis and lipid oxidation reactions, we applied
                           several different analyses to monitor each of them. The results of this study will guide the producers of fish silage
                           towards a better understanding of the (bio)chemical reactions taking place during the ensilaging process to pro-
                           duce high-quality “silage 2.0” suitable both for feed and for potential food applications.

                           Materials and Methods
                           Materials.      Herring filleting co-products from two different catching seasons were collected from Scandic
                           Pelagic Ellös AB (Ellös, Sweden). The catching seasons were; autumn 2017 (caught in Skagerrak 5807/1012 by the
                           ship Lövön GG778 on 20th August and filleted on 21st August 2017) and spring 2018 (caught in the west part of the
                           Baltic Sea on 25th March by the ships Pollex SM3 and Anna-Lena KÜH24 and filleted on 27th March 2018). The
                           filleting co-products – consisting of around 32% heads, 37% frames, 7% tails, 15% skins, and 9% guts and other
                           intestinal organs – were collected immediately after filleting, transported to the lab in a thermo-box with ice,
                           minced to 2 mm using a meat grinder (la Minerva, Italy), and stored in 500 g aliquots in zip-lock plastic bags at
                           −80 °C until further use. To minimize the influence of batch-to-batch variations on variations caused by our main
                           study parameters, co-products from the autumn 2017 were used for the one-parameter-at-a-time experiments
                           and co-products from spring 2018 in the BBD experiments.

                           One-parameter-at-a-time experiments. One-parameter-at-a-time experiments were first conducted to
                           evaluate the range of parameters for BBD. To investigate the effect of different processing parameters on DH and
                           lipid oxidation, the starting point was a basic ensilaging protocol comprising the addition of formic acid (85%
                           purity) to 500 g minced co-products in a ratio of 2.5% (v/w) in 500-ml glass reactors (Fig. 1). The reactors were
                           continuously stirred at 10 rpm using overhead stirrer and incubated in water baths at 22 °C, unless specified oth-
                           erwise. Also, effect of endogenous enzymes on DH was studied by inactivating such enzymes at 95 °C for 30 min
                           in a water bath, prior to the incubation at 22 °C. Effect of headspace oxygen removal on DH and lipid oxidation
                           was studied by flushing the headspace of the reactor with N2 for 60 secs. Ensilaged samples were collected at
                           different time points and stored in small aliquots at −80 °C until further analysis. A minced herring by-product
                           sample was taken before addition of formic acid (day-0 sample) and was considered as a control. The pH of the
                           day-0 sample was around 6.50, and the pH of ensilaged samples was within the range of 3.42–3.91 during the
                           studied period (Supplementary Information; Fig. 1).

Scientific Reports |   (2020) 10:9590 | https://doi.org/10.1038/s41598-020-66152-0                                                            2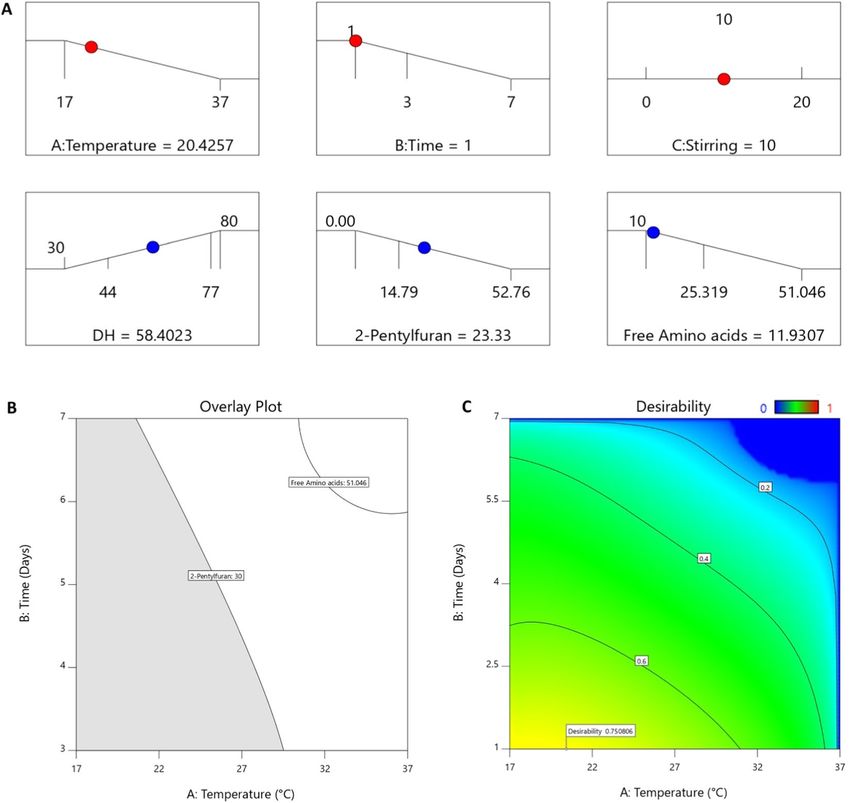
www.nature.com/scientificreports/                                                                           www.nature.com/scientificreports

                                   Process parameters              Responses
                                   Temp.     Time       Stirring   DH      FAA        TBARS        MDA    2-pentylfuran   TVB-N
                            Run    (°C)      (days)     (rpm)      (%)     (mg/g)     (µmole/Kg)   (µM)   (µg/g)          (mg/100 g)
                            1      17        7          10         54.85   39.64      107.20       4.40   23.17           5.46
                            2      37        3          10         70.04   37.85      90.80        2.75   33.02           9.50
                            3      27        5          10         66.42   45.93      125.47       4.40   32.15           9.58
                            4      37        7          10         77.28   51.04      100.73       2.24   52.76           26.25
                            5      27        5          10         66.11   46.79      105.53       5.48   31.07           9.55
                            6      17        5          0          44.41   32.70      64.56        2.94   15.35           5.75
                            7      17        3          10         45.19   25.31      50.49        2.70   14.79           4.73
                            8      37        5          0          70.67   47.62      54.12        1.50   40.17           20.69
                            9      27        7          20         76.62   48.96      123.23       4.01   43.68           10.90
                            10     27        3          0          64.39   35.03      63.24        2.44   27.81           8.06
                            11     27        7          0          72.81   47.19      59.45        1.76   40.30           13.64
                            12     27        5          10         66.13   45.81      158.89       3.71   32.33           9.69
                            13     27        5          10         65.09   46.35      113.45       5.54   32.25           9.58
                            14     37        5          20         71.96   49.73      94.47        2.45   44.11           11.97
                            15     17        5          20         49.44   32.44      89.42        3.59   18.85           5.53
                            16     27        3          20         65.79   33.37      95.27        3.86   31.39           8.07
                            17     27        5          10         66.48   43.77      169.68       3.60   31.56           9.58
                            18     27        5          10         65.34   44.81      122.67       4.06   31.60           9.55

                           Table 1. The experimental design used in the BBD and the responses obtained.

                            Parameters/
                            Responses                 Goal         Range Importance       Weight
                            Temperature (°C)          Minimize     17–37   +++++ (5)      1
                            Time (days)               Minimize     1–7     +++++ (5)      1
                            Stirring (rpm)            Equal to     10      +++ (3)        1
                            DH (%)                    Maximize     30–80   +++++ (5)      1
                            FAA (mg/g)                Minimize     10–51   ++++ (4)       1
                            2-Pentylfuran (µg/g)      Minimize     0–53    +++++ (5)      1

                           Table 2. Desirability settings for the parameters and the three selected responses.

                           Multi-response optimization using desirability function.                   A BBD with six center points was used
                           to investigate the interaction effects of temperature, time and stirring on the responses and to find the opti-
                           mized process settings to achieve a desired maximum DH while keeping unwanted reactions like lipid oxidation,
                           TVB-N and FAA formation to a minimum. Each process parameter was set on three levels each in the range
                           17–37 °C, 3–7 days, and 0–20 rpm, respectively. The selected range was based on the observed effect of the param-
                           eters on DH and lipid oxidation in the univariate trials, and their relevance for upscale production. Ensilaging
                           was performed as mentioned earlier, and samples were stored in small aliquots at −80 °C until further analysis.
                           Table 1 shows the experimental matrix of the BBD and data for the responses investigated in this study, i.e., DH,
                           FAA, TBARS, malondialdehyde (MDA), 2-pentylfuran, and TVB-N. Experimental design and statistical analysis
                           were performed using primarily Design Expert (version 11, Stat-Ease, Inc., USA), and in some cases MODDE Pro
                           (version 12.1, Sartorius Stedim Data Analytics AB, Sweden) software. Analysis of variance (ANOVA) was used to
                           estimate the statistical parameters, and significant differences were accepted at p < 0.05.
                               Simultaneous optimization of multiple responses was performed using the desirability function29,30; individual
                           response was converted into a single desirability function ranging from 0 to 1, where 0 and 1 refer to the least
                           and most desired output, respectively. A high value for DH, and a low value for FAA and the oxidation marker
                           2-pentylfuran were considered as the most desirable output in this sub-study. The differential weighting function
                           was kept at their default value of 1 for both selected parameters and responses, where a value higher or lower than
                           1 adds more or less importance, respectively, to that goal during calculation of the multiple desirability function28.
                           The settings for the desirability function are given in Table 2.

                           Analysis of proximate composition.             The moisture content was analyzed by a moisture balance (Precisa
                           HA 300). Total nitrogen content was determined using a nitrogen analyzer (LECO), and then the crude pro-
                           tein content in sample was calculated using a nitrogen to protein conversion factor of 5.5831. Crude lipid con-
                           tent was determined gravimetrically using the chloroform phase from a chloroform:methanol (2:1) extraction
                           according to Lee, et al.32. Ash content was determined by ashing at 575 °C according to NREL protocol (NREL/
                           TP-510-42622)33.

Scientific Reports |   (2020) 10:9590 | https://doi.org/10.1038/s41598-020-66152-0                                                             3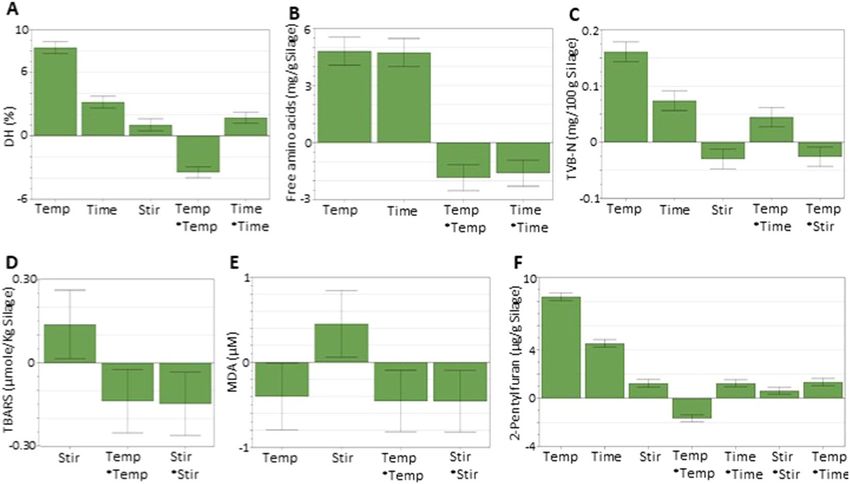
www.nature.com/scientificreports/                                                                   www.nature.com/scientificreports

                            Sampling time   Moisture (%)    Crude protein (%)   Crude lipid (%)   Ash (%)       Others (%)
                            Autumn 2017     66.70 ± 0.14*   12.29 ± 0.15*       17.85 ± 0.05*     2.81 ± 0.10   0.35
                            Spring 2018     77.03 ± 0.19*   14.95 ± 0.08*       4.55 ± 0.21*      2.69 ± 0.05   0.78

                           Table 3. Proximate composition of herring filleting co-products. Star sign represents significant (p < 0.05)
                           difference between the two seasons. Results are expressed as mean ± SEM (n = 3).

                           Determination of protein degree of hydrolysis (DH). DH was determined according to Nielsen, et al.34
                           with slight modifications in the sample preparation. Briefly, 0.5 ml silage sample was mixed with 3.75 ml
                           o-phthaldialdehyde (OPA) reagent, vortexed for 5 sec, followed by incubation for 2 min at room temperature.
                           Prior to incubation, silage samples were diluted with pure distilled water to keep the absorbance reading below
                           1.0, and the absorbance was measured at 340 nm using a spectrophotometer (Cary 60 UV–vis, Agilent technol-
                           ogies, 117 USA).

                           Analysis of 2-thiobarbituric acid reactive substances (TBARS). Silage sample was extracted as
                           mentioned above according to Lee, et al.32 and the methanol phase was used for TBARS analysis according to
                           Schmedes and Hølmer35, with modifications as described by Undeland, et al.36; the absorbance was measured at
                           532 nm using a spectrophotometer (Cary 60 UV–vis, Agilent technologies, 117 USA).

                           Determination of free amino acids (FAA). 0.9 g silage was weighed in a 1.5-ml Eppendorf tube, centri-
                           fuged at 12,000 × g for 10 min (4 °C), then 300 µL supernatant was mixed with an equal volume of TCA solution
                           (7.5% w/v) and kept on ice. The mixture was then vortexed and centrifuged (12,000 × g, 10 min). The supernatant
                           was diluted with 0.2 M acetic acid, and analyzed by LC/APCI-MS according to a method by Özcan and Şenyuva37
                           with slight modifications as described by Harrysson, et al.38.

                           Determination of malondialdehyde (MDA) content. MDA content was determined according to
                           Tullberg, et al.39, after 2,4-dinitrophenylhydrazine (DNPH) derivatization of samples followed by LC/APCI-MS
                           analysis.

                           Determination of 2-pentylfuran content. Volatile 2-pentylfuran was collected using headspace
                           solid-phase microextraction (HS-SPME) technique followed by GC-MS analysis according to a method adopted
                           after Iglesias and Medina40 with slight modifications as described by Sajib and Undeland21.

                           Determination of total volatile basic nitrogen (TVB-N) content.                    TVB-N was determined using
                           Conway diffusion cells according to Rawdkuen, et al.41 with slight modifications. Briefly, 2 g silage was mixed
                           with 8 ml of 4% trichloroacetic acid (TCA) solution, vortexed for 2 min, followed by centrifugation at 3,000 ×
                           g for 15 min; thereafter, 2 ml supernatant was transferred to the outer ring of the Conway cell. Then, 2 ml of 1%
                           (w/v) boric acid solution containing 0.165% (v/v) methyl red and 0.0825% (v/v) bromocresol green was added to
                           the inner ring of the Conway cell. Subsequently, 2 ml of saturated potassium carbonate solution was added to the
                           outer ring of the Conway cell, and it was covered with the lid, and incubated at 37 °C for 60 min. Upon comple-
                           tion, the inner ring solution was titrated using 0.02 N hydrochloric acid (HCl).

                           Analysis of molecular weight distribution of proteins and peptides. Molecular weight distribution
                           of samples was analyzed using HP-SEC according to Abdollahi, et al.42 with the modification that 5 g of silage was
                           diluted with 5 ml of mobile phase prior to centrifugation.

                           Statistical and multivariate analysis.          The results were expressed as mean (n = 3) ± standard error of
                           the mean (SEM). Statistical analysis was performed on R (https://www.r-project.org/). The obtained results were
                           subjected to either one-way or two-way ANOVA, and comparison among samples was performed with Tukey
                           Honest Significant Differences (HSD) test with p < 0.05 representing a significant difference. Multivariate analysis
                           was performed using SIMCA software (version 15, Umetrics, Sweden).

                           Results and Discussion
                           Proximate composition of herring filleting co-products.                   The composition of herring filleting
                           co-products from autumn and spring is shown in Table 3. The main difference was in the lipid and water contents,
                           which are normally inversely related to each other. The lower lipid content in spring than autumn is in line with
                           earlier reports on low lipid content prior to the spawning season43. The protein and ash content were however
                           more or less the same irrespective of the catching season.

                           Effect of processing parameters on DH and lipid oxidation. The increase in DH over time was mainly
                           due to autolysis since only a very small, but significant (p < 0.05), increase in DH was noticed after inactivation of
                           endogenous enzymes at 95 °C for 30 min (Fig. 2A). In addition, DH was clearly time dependent and increased up
                           to around 7 days where after the rate levelled off (Fig. 2B); similar observation was also reported by van’t Land, et
                           al.22. Further, a slightly but significantly (p < 0.05) higher DH was noticed when frozen and thawed co-products
                           were used as opposed to fresh ones, which could be due to the fact that cell membranes were disrupted due to ice
                           crystal formation facilitating a better contact between endogenous enzymes and the fish proteins. In Fig. 2C, DH
                           after 7 days of ensilaging is shown as a function of temperatures beyond that of our basic protocol (22 °C); the
                           maximum DH was found at 32 °C, which means that the endogenous proteolytic enzymes of herring co-products

Scientific Reports |   (2020) 10:9590 | https://doi.org/10.1038/s41598-020-66152-0                                                             4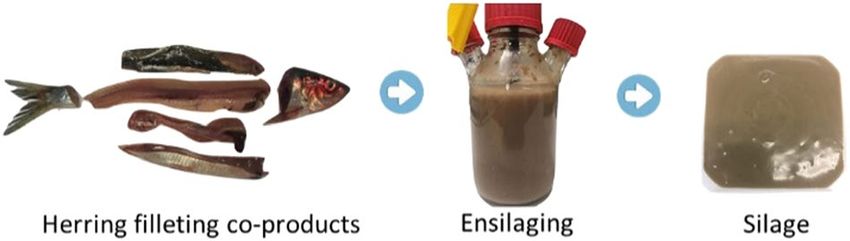
www.nature.com/scientificreports/                                                               www.nature.com/scientificreports

                           Figure 2. Effect of different parameters on protein degree of hydrolysis (DH). The basic protocol used, if not
                           varied as stated below, was addition of 85% formic acid at a 2.5% (v/w) level, ensilaging at 22 °C with stirring
                           at 10 rpm but without oxygen removal. The different panels show the effect of e.g. (A) inactivating enzymes
                           at 95 °C for 30 min vs autolysis, (B) time, (C) varying temperature, (D) stirring, (E) acid to fish co-product
                           ratio, (F) headspace oxygen removal with N2. Data points along the same line with different lower-case letter
                           are significantly (p < 0.05) different from each other; star (*) sign represents significance (p < 0.05) difference
                           between treatments at different time points. Results are expressed as mean ± SEM (n = 3).

                           were most active at around this temperature. A slight but significant (p < 0.05) increase in DH was noticed both
                           after 3 and 7 days when a continuous stirring was used, compared to when stirring only was done during the
                           30 first minutes and prior to sampling to ensure homogeneity (Fig. 2D). The difference was surprisingly small,
                           indicating an efficient diffusion of enzymes/substrates even without a continuous stirring. A slight but significant
                           (p < 0.05) increase in DH was noticed after 7 days of ensilaging when 4% (v/w) formic acid of 85% purity was
                           used (Fig. 2E), compared to a 2.5% (v/w) addition, which could be due to an increased contact between enzymes
                           and proteins due to lower viscosity. However, addition of a higher level of acid will increase the moisture content
                           of the final silage; hence, will increase drying cost if aiming at a dried silage product. Further, a 2.5% (v/w) addi-
                           tion of acid was sufficient to bring the initial ensilaging pH to around 3.50, the reported optimum pH for digestive
                           proteases from herring9,44, and this level also allows direct addition into a feed product without neutralization
                           of the silage45. In all subsequent ensilaging experiments, 2.5% (v/w) acid was therefore added. Figure 2F shows
                           the effect of removing oxygen from the ensilaging reactor’s headspace on DH. An incentive for doing so could
                           be to suppress lipid oxidation. The observed slightly lower DH progression without headspace oxygen removal
                           was somehow different than earlier findings46, where Dosoretz, et al.46 reported increased protease activity with
                           increased oxygenation.
                               Figure. 3 shows how the variation in process parameters affected TBARS as a marker of lipid oxidation.
                           TBARS increased steadily over time when ensilaging was performed at 22 °C (Fig. 3A). However, the rate levelled
                           off after 6 and 14 days, which could be explained by the fact that Hb/myoglobin (Mb) becomes limiting for the
                           peroxide breakdown47 and/or that carbonyls reacted further with e.g. proteins, peptides and amino acids, result-
                           ing in tertiary lipid oxidation products21,48. Similar to our findings, van’t Land, et al.22 also reported a decreasing

Scientific Reports |   (2020) 10:9590 | https://doi.org/10.1038/s41598-020-66152-0                                                               5
www.nature.com/scientificreports/ www.nature.com/scientificreports
Figure 3. Effect of different parameters on lipid oxidation (TBARS). The basic protocol used, if not varied as
stated below, was addition of 85% formic acid at a 2.5% (v/w) level, ensilaging at 22 °C with stirring at 10 rpm
but without oxygen removal. The different panels show the effect of (A) time, (B) temperature, (C) stirring, (D)
acid to fish co-product ratio, and (E) effect of headspace oxygen removal with N2. Data points along the same
line with different lower-case letter are significantly (p < 0.05) different from each other; star (*) sign represents
significance (p < 0.05) difference between treatments at different time points. Results are expressed as mean ±
SEM (n = 3).
trend of TBARS over time. The use of frozen and thawed co-products resulted in relatively higher level of TBARS,
compared to fresh co-products, which could possibly be due to disruption of cell wall structures enabling the
PUFAs more accessible to attack by pro-oxidants and free radicals. Further, TBARS decreased with increasing
temperature (Fig. 3B), possibly because the main carbonyl compound responding in TBARS test i.e. MDA did
not accumulate but rather reacted further when ensilaging was performed above ambient temperatures (i.e.
>22 °C)21,24. Stirring resulted in a significantly (p < 0.05) higher TBARS values, compared to stirring only at start
and prior to sampling (Fig. 3C); probably due to increased oxygen level in the system. A high acid to co-product
ratio resulted in a significant (p < 0.05) increase in TBARS after 7 days of ensilaging (Fig. 3D), which is most
probably due to enhanced mobility of reactants in the system due to the decreased viscosity and increased water
activity49, as well as to the fact that a lower pH further activated heme-proteins as pro-oxidants50. Figure 3E shows
that the removal of headspace oxygen resulted in significantly (p < 0.05) lower levels of TBARS, which was an
expected finding. Thus, limiting the oxygen supply to the system could be implemented if targeting a high-quality
silage. This procedure would however have to be weighed carefully against increased production costs and was
not implemented as a standard procedure in the current study.
Optimization of the ensilaging process. Considering the documented influence of process parameters
on both DH and lipid oxidation in the univariate trials, it was decided to perform an experimental design (i.e. a
BBD, see Table 1) in which temperature (17–37 °C), time (3–5 days), and stirring (0–20 rpm) were varied to find
out an optimum operational setting with respect to high DH but minimal lipid oxidation and FAA; also keeping
Scientific Reports | (2020) 10:9590 | https://doi.org/10.1038/s41598-020-66152-0 6www.nature.com/scientificreports/ www.nature.com/scientificreports
Figure 4. Coefficient plots showing the significant (p < 0.05) model terms (i.e. regression coefficients) from
evaluation of the BBD with error bars representing confidence intervals; the different panels show the model
terms for (A) DH, (B) FAA, (C) TVB-N, (D) TBARS, (E) MDA, and (F) 2-pentylfuran. Responses were scaled
and centered, and the size of coefficients represents the change in their respective responses when a factor varies
from medium to high level (see Table 1), while keeping other factors at their average values.
process scalability in mind. Based on the results of Fig. 3B, which is along with results of our recent study21, lipid
oxidation was here monitored by specific analyses of MDA and 2-pentylfuran, in addition to the TBARS test.
Based on the ANOVA analysis (see Supplementary Information; Tables 7–12), the regression models for all
six studied responses were significant (p < 0.05). Further, the lack-of-fit values were not significant (p > 0.05) for
studied responses, except for TVB-N, suggesting that the model fitted the data very well51. The fit of the models
was also evaluated by adjusted R2 values, which minimizes the possibilities of overfitting the models, where a
value close to 1.0 represents a good fit of the model52,53. The adjusted R2 values for the quadratic models of DH,
FAA, and 2-pentylfuran were 0.99, 0.96, and 0.99, respectively, suggesting a very good fit of the models. This also
resulted in a very high predicted R2 values, a measurement of the predictive quality of the model, of DH, FAA, and
2-pentylfuran (see Supplementary Information; Tables 1–6, and Fig. 5). The adjusted R2 values for the quadratic
models of TBARS, MDA, and TVB-N were in the range of 0.56–0.92, however, the predicted R2 values were quite
low (in the range of 0.10–0.43); therefore, only the responses DH, FAA, and 2-pentylfuran were considered for
multi-response optimization of the ensilaging process using the desirability function. Further, the normal plot of
residuals for all six studied responses was linear (see Supplementary Information; Fig. 6), suggesting that none of
the responses deviated from normality54,55.
The effects of temperature, time, and stirring on studied responses were evaluated through regression analy-
sis, and the resulting quadratic equations for responses are given in Eqs. 1–6, where A = temperature, B = time,
and C = stirring. A positive coefficient value indicates that an increase in that process parameter will result in an
increase in that response, and a negative coefficient will influence the result negatively. Figure 4 shows the model
terms which had significant (p < 0.05) effects on the responses and reveals that the most important model terms
in most cases, were temperature and time, and in some cases stirring. Also, interaction effects between two of the
three terms temperature, time, and stirring had significant (p < 0.05) effects on some of the responses e.g. TVB-N,
2-pentylfuran; however, the main effects were always higher than the interaction effects (see Supplementary
Information; Table 7–12).
DH = 65.67 + 12.12A + 4.62B + 1.50C − 0.75AB − 1.00AC + 0.50BC − 7.46A2 + 3.54B2
+ 0.79C2 (1)
FAA = 45.58 + 7.02A + 6.91 B + 0.24 C − 0.28 AB + 0.59 AC + 0.85 BC − 3.82 A2 − 3.30 B2
− 1.14 C2 (2)
TBARS = 132.62 + 3.56A + 11.35 B + 20.13 C − 11.69 AB + 3.87 AC + 7.94 BC − 27.48 A2
− 17.83 B2 − 29.49 C2 (3)
Scientific Reports | (2020) 10:9590 | https://doi.org/10.1038/s41598-020-66152-0 7www.nature.com/scientificreports/ www.nature.com/scientificreports
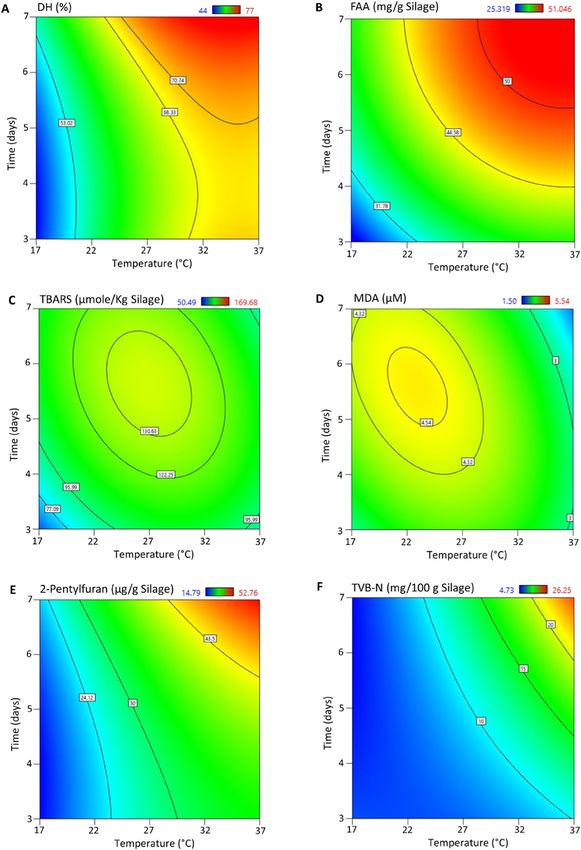
Figure 5. Contour plots showing the effect of temperature and time on (A) DH, (B) FAA, (C) TBARS, (D)
MDA, (E) 2-pentylfuran and (F) TVB-N when evaluating the BBD. Stirring was set at 10 rpm for all responses.
MDA = 4.47 − 0.58A + 0.08 B + 0.65 C − 0.55 AB + 0.07 AC + 0.20 BC − 0.92 A2 − 0.52 B2
− 0.92 C2 (4)
2‐pentylfuran = 31.83 + 12.24A + 6.61 B + 1.80 C + 2.84 AB + 0.11 AC − 0.05 BC − 3.53 A2
+ 2.64 B2 + 1.33 C2 (5)
TVB‐N = 9.59 + 5.87A + 3.24 B − 1.46 C + 4.01 AB − 2.13 AC − 0.68 BC + 1.36 A2 + 0.53 B2
+ 0.03 C2 (6)
Scientific Reports | (2020) 10:9590 | https://doi.org/10.1038/s41598-020-66152-0 8www.nature.com/scientificreports/ www.nature.com/scientificreports
Figure 6. Changes in molecular weight distribution of proteins and peptides over time (0–7 days) at 27 °C; (A)
SEC chromatogram, (B) relative content of differently sized proteins and peptides.
It is evident from Fig. 5A that DH increased with temperature and time up to 37 °C and 7 days, respectively.
The observed increase in DH even after 32 °C was somewhat different from the results of Fig. 2C, in which herring
co-products from the autumn season were used, indicating that the endogenous proteolytic enzymes present in
herring co-products collected in the spring season were most active above 32 °C. The optimum activity tempera-
ture of herring muscle protease has been reported to be around 50 °C at pH 3.8056; supporting that increased DH
at temperatures above 32 °C is still within a natural range for herring proteases. The FAA content also increased
with both temperature and time (Fig. 5B), and correlated strongly with DH (see Supplementary Information
Figs. 3–4), which has also been reported by other authors57. However, besides FAA, peptides were also produced
over time during the ensilaging process, and, the relative content of peptides was around 90% (Fig. 6). Most
of the proteins with sizes between 17–366 kDa were hydrolyzed into peptides mainly within the size of 1.9–
4.7 kDa within 3 days of ensilaging. The observed peak around 0.2 kDa could possibly be due to FAA and/or small
di-peptides58, which increased over time. Therefore, to produce a high-quality silage, both DH and FAA should be
considered with the aim to increase the DH while keeping the FAA content to a minimum. Looking into the spe-
cific FAA released, no specific pattern was noticed in this BBD study (see Supplementary Information; Figs 7–8).
TBARS and MDA (Fig. 4D,E, respectively) responded most different to the model terms in that temperature
and time had very little influence on their formation. This is also evident when looking at their respective contour
plots shown in Fig. 5C,D. As can be seen here, both TBARS and MDA accumulated around 22–27 °C (within 5–6
days), then degraded at elevated temperatures. MDA, being the main carbonyl responding in the TBARS test, can
be subjected to hydrolytic cleavage at elevated temperature to form acetaldehyde and formic acid21,24. It can also
react further with e.g. proteins/peptides/amino acids to give rise to the formation of non-enzymatic browning
reaction products21,48. Hence, lower TBARS and MDA values at elevated temperature does not necessarily imply
less oxidation, but just a different profile of oxidation-derived products21. This theory was confirmed by the fact
that 2-pentylfuran – which can be formed both from the oxidation of n-3 LC PUFAs and from non-enzymatic
browning reactions – followed an increasing trend with both temperature and time alone, as well as with their
interaction effect (Figs. 4F and 5E). Thus, if ensilaging is done >22 °C, it is important that the correct oxidation
markers are used if aiming at a high quality fish silage and/or at extracting high-quality oils for feed or human
consumption26. For the latter, lipid oxidation should be kept within the acceptable limits for edible oils set by the
GOED Voluntary Monograph59.
Similar to 2-pentylfuran, TVB-N followed an increasing trend with both temperature and time (Fig. 5F) which
was in agreement with an earlier study on fish silage22 and may result from the extended hydrolysis (Fig. 5A) with
subsequent deamination of amino acids containing amide-N groups, e.g. glutamine and asparagine, into NH322.
TVB-N is a freshness indicator often applied at different steps during fishmeal and fish silage production. A value
below 50 mg/100 g refers to a good-quality fishmeal22; while no such limits are yet described for fish silage.
Multi-response optimization using the desirability function. Among the six responses studied
in the BBD, DH, FAA, and 2-pentylfuran were selected to find the optimum process settings with the aim to
maximize the DH while keeping the unwanted formation of FAA and 2-pentylfuran to a minimum. TVB-N
can also be used as a freshness indicator of fish silage; however, it was not considered in this study due to
Scientific Reports | (2020) 10:9590 | https://doi.org/10.1038/s41598-020-66152-0 9www.nature.com/scientificreports/ www.nature.com/scientificreports
Figure 7. Graphical representation of (A) desirability ramp: the optimum value of temperature, time, and
stirring to achieve possible maximum DH of 58% while keeping the 2-pentylfuran and FAA content to a
minimum with an overall desirability score of 0.75 out of 1.0, (B) overlay plot showing suggested ensilaging
settings (grey region) within investigated parameter settings in this study at 10 rpm stirring, and (C) contour
plot of desirability function for optimum ensilaging settings mentioned in the desirability ramp: effect of
temperature and time at 10 rpm stirring.
significant (p < 0.05) lack-of-fit and low predicted R2 values of the model (see Supplementary Information;
Table 6 and 12). It was further decided to minimize the ensilaging temperature and time, to perform the
ensilaging in an energy-smart manner, while at the same time produce a high-quality silage. The desirability
settings of multi-response optimization are given in Table 2, and the outcomes of this desirability settings
are shown in Fig. 7. Temperature and time were found to influence the ensilaging process more than stirring;
thus the importance score of 5 was given to both temperature and time while the stirring was kept constant
at 10 rpm to secure proper mixing of acid with minced co-products to avoid microbial spoilage (Table 2).
Based on the inputs given on the desirability function (see Table 2), ensilaging should be performed within
the temperature range of 17–30 °C for 3–7 days as shown in the overlay plot in Fig. 7B. However, based
on the model prediction, it was further recommended to perform ensilaging at ambient temperature (i.e.
∼20 °C) for 1–3 days (Fig. 7C); the exact duration of the ensilaging being depending on the desired DH.
The role of the latter for the value of silage as an aquafeed ingredient needs further evaluation. It is gener-
ally accepted that smaller peptides are more bioavailable to fish than larger ones60–62, but the difficulty in
controlling the enzymatic activity during autolysis makes it difficult to maximize the formation of small
peptides yet avoiding FAA formation. The latter has, as earlier stated, been shown to lower the nutritional
and biological value, and increase fluctuations in plasma amino acid levels14,16,63.
Scientific Reports | (2020) 10:9590 | https://doi.org/10.1038/s41598-020-66152-0 10www.nature.com/scientificreports/ www.nature.com/scientificreports
Conclusions
The effect of temperature and time on (bio)chemical reactions taking place during ensilaging of herring
co-products has here been systematically investigated and reported for the first time. Temperature and time were
the most significant parameters influencing the studied responses (i.e. DH, FAA, TBARS, MDA, 2-pentylfuran,
and TVB-N); however, in some cases the interaction effects of these two parameters also influenced the responses
significantly. At temperature >22 °C, 2-pentylfuran was a better lipid oxidation marker for silage than TBARS/
MDA. It was generally found that the formation of FAA, lipid oxidation products and TVB-N increased with
time, which is expected to lower the value of the silage as a feed/food ingredient. Using a multivariate approach
comprising a BBD it was seen that performing ensilaging at ambient temperatures (i.e. ∼20 °C), with continuous
stirring at 10 rpm for 1–3 days produces the highest quality silage and keeps energy input levels at a minimum.
The exact ensilage time will depend on the desired DH; the latter being an area that needs further research.
Received: 27 February 2020; Accepted: 14 May 2020;
Published: xx xx xxxx
References
1. Fish, W. B. to 2030: prospects for fisheries and aquaculture. World Bank Report 83177, 102 (2013).
2. FAO. The State of Food Insecurity in the World: Addressing food insecurity in protracted crises. Rome: Food and Agriculture
Oranization of the United Nations (FAO) and World Food Programme (WFP) (2010).
3. Westhoek, H. et al. The protein puzzle: the consumption and production of meat, dairy and fish in the European Union. Report No.
907864561X, (Netherlands Environmental Assessment Agency, 2011).
4. Carlucci, D. et al. Consumer purchasing behaviour towards fish and seafood products. Patterns and insights from a sample of
international studies. Appetite 84, 212–227 (2015).
5. Olsen, S. O., Scholderer, J., Brunsø, K. & Verbeke, W. Exploring the relationship between convenience and fish consumption: a cross-
cultural study. Appetite 49, 84–91 (2007).
6. Olsen, S. O. Understanding the relationship between age and seafood consumption: the mediating role of attitude, health
involvement and convenience. Food quality and Preference 14, 199–209 (2003).
7. Ghaly, A. E., V. V. Ramakrishnan, M. S. Brooks, S. M. Budge, and D. Dave. Fish Processing Wastes as a Potential Source of Proteins,
Amino Acids and Oils: A Critical Review. Journal of Microbial & Biochemical Technology 05, https://doi.org/10.4172/1948-
5948.1000110 (2013).
8. Anastas, P. T. & Warner, J. C. Principles of green chemistry. Green chemistry: Theory and practice, 29–56 (1998).
9. Raa, J., Gildberg, A. & Olley, J. N. Fish silage: a review. Critical Reviews in Food Science &. Nutrition 16, 383–419 (1982).
10. Olsen, R. L. & Toppe, J. Fish silage hydrolysates: Not only a feed nutrient, but also a useful feed additive. Trends in Food Science &
Technology (2017).
11. Olsen, R. L., Toppe, J. & Karunasagar, I. Challenges and realistic opportunities in the use of by-products from processing of fish and
shellfish. Trends in Food Science & Technology 36, 144–151, https://doi.org/10.1016/j.tifs.2014.01.007 (2014).
12. Jackson, A., Kerr, A. & Bullock, A. Fish silage as a dietary ingredient for salmon. II. Preliminary growth findings and nutritional
pathology. Aquaculture 40, 283–291 (1984).
13. Espe, M., Haaland, H. & Njaa, L. R. Autolysed fish silage as a feed ingredient for atlantic salmon (Salmo Salar). Comparative
Biochemistry and Physiology Part A: Physiology 103, 369–372, https://doi.org/10.1016/0300-9629(92)90596-I (1992).
14. Frederick, E. & Stone, R. W. H. Nutritional value of acid stabilised silage and liquefied fish protein. Journal of the Science of Food and
Agriculture 37, 797–803 (1986).
15. Silk, D., Grimble, G. & Rees, R. Protein digestion and amino acid and peptide absorption. Proceedings of the Nutrition Society 44,
63–72 (1985).
16. Gilmartin, L. & Jervis, L. Production of cod (Gadus morhua) muscle hydrolysates. Influence of combinations of commercial enzyme
preparations on hydrolysate peptide size range. Journal of agricultural and food chemistry 50, 5417–5423 (2002).
17. Bautista, J., Hernandez-Pinzon, I., Alaiz, M., Parrado, J. & Millan, F. Low molecular weight sunflower protein hydrolysate with low
concentration in aromatic amino acids. Journal of Agricultural and Food Chemistry 44, 967–971 (1996).
18. Zambonino Infante, J. L., Cahu, C. L. & Peres, A. Partial substitution of di-and tripeptides for native proteins in sea bass diet
improves Dicentrarchus labrax larval development. The. Journal of nutrition 127, 608–614 (1997).
19. Cowey, C. & Walton, M. Studies on the uptake of (14C) amino acids derived from both dietary (14C) protein and dietary (14C)
amino acids by rainbow trout, Salmo gairdneri Richardson. Journal of Fish Biology 33, 293–305 (1988).
20. Zarate, D. D. & Lovell, R. T. Free lysine (L-lysine· HCl) is utilized for growth less efficiently than protein-bound lysine (soybean
meal) in practical diets by young channel catfish (Ictalurus punctatus). Aquaculture 159, 87–100 (1997).
21. Sajib, M. & Undeland, I. Towards valorization of herring filleting by-products to silage 2.0: Effect of temperature and time on lipid
oxidation and non-enzymatic browning reactions. LWT, 109441, https://doi.org/10.1016/j.lwt.2020.109441 (2020).
22. van’t Land, M., Vanderperren, E. & Raes, K. The effect of raw material combination on the nutritional composition and stability of
four types of autolyzed fish silage. Animal Feed Science and Technology (2017).
23. Altissimi, S. et al. Indicators of protein spoilage in fresh and defrosted crustaceans and cephalopods stored in domestic condition.
Ital J Food Saf 6, 6921–6921, https://doi.org/10.4081/ijfs.2017.6921 (2018).
24. Vandemoortele, A. & De Meulenaer, B. Behavior of malondialdehyde in oil-in-water emulsions. Journal of agricultural and food
chemistry 63, 5694–5701 (2015).
25. McBride, J., Idler, D. & MacLeod, R. The liquefaction of British Columbia herring by ensilage, proteolytic enzymes and acid
hydrolysis. Journal of the Fisheries Board of Canada 18, 93–112 (1961).
26. Özyurt, G., Özkütük, A. S., Uçar, Y., Durmuş, M. & Ozogul, Y. Evaluation of the potential use of discard species for fish silage and
assessment of its oils for human consumption. International Journal of Food Science & Technology 54, 1081–1088 (2019).
27. Khuri, A. I. & Mukhopadhyay, S. Response surface methodology. Wiley Interdisciplinary Reviews: Computational Statistics 2,
128–149 (2010).
28. Myers, R. H., Montgomery, D. C. & Anderson-Cook, C. M. Response surface methodology: process and product optimization using
designed experiments. (John Wiley & Sons, 2016).
29. Harrington, E. C. The desirability function. Industrial quality control 21, 494–498 (1965).
30. Derringer, G. & Suich, R. Simultaneous optimization of several response variables. Journal of quality technology 12, 214–219 (1980).
31. Mariotti, F., Tomé, D. & Mirand, P. P. Converting nitrogen into protein—beyond 6.25 and Jones’ factors. Critical reviews in food
science and nutrition 48, 177–184 (2008).
32. Lee, C. M., Trevino, B. & Chaiyawat, M. A simple and rapid solvent extraction method for determining total lipids in fish tissue.
Journal of AOAC International 79, 487–492 (1996).
33. Sluiter, A. et al. Determination of ash in biomass (NREL/TP-510-42622). National Renewable Energy Laboratory, Golden (2005).
Scientific Reports | (2020) 10:9590 | https://doi.org/10.1038/s41598-020-66152-0 11www.nature.com/scientificreports/ www.nature.com/scientificreports
34. Nielsen, P., Petersen, D. & Dambmann, C. Improved method for determining food protein degree of hydrolysis. Journal of food
science 66, 642–646 (2001).
35. Schmedes, A. & Hølmer, G. A new thiobarbituric acid (TBA) method for determining free malondialdehyde (MDA) and
hydroperoxides selectively as a measure of lipid peroxidation. Journal of the American Oil Chemists Society 66, 813–817 (1989).
36. Undeland, I., Kelleher, S. D. & Hultin, H. O. Recovery of functional proteins from herring (Clupea harengus) light muscle by an acid
or alkaline solubilization process. Journal of agricultural and food chemistry 50, 7371–7379 (2002).
37. Özcan, S. & Şenyuva, H. Z. Improved and simplified liquid chromatography/atmospheric pressure chemical ionization mass
spectrometry method for the analysis of underivatized free amino acids in various foods. Journal of chromatography A 1135,
179–185 (2006).
38. Harrysson, H. et al. Production of protein extracts from Swedish red, green, and brown seaweeds, Porphyra umbilicalis Kützing,
Ulva lactuca Linnaeus, and Saccharina latissima (Linnaeus) JV Lamouroux using three different methods. Journal of Applied
Phycology, 1–16 (2018).
39. Tullberg, C. et al. Formation of reactive aldehydes (MDA, HHE, HNE) during the digestion of cod liver oil: Comparison of human
and porcine in vitro digestion models. Food & function 7, 1401–1412 (2016).
40. Iglesias, J. & Medina, I. Solid-phase microextraction method for the determination of volatile compounds associated to oxidation of
fish muscle. Journal of Chromatography A 1192, 9–16, https://doi.org/10.1016/j.chroma.2008.03.028 (2008).
41. Rawdkuen, S., Jongjareonrak, A., Phatcharat, S. & Benjakul, S. Assessment of protein changes in farmed giant catfish (Pangasianodon
gigas) muscles during refrigerated storage. International journal of food science &. technology 45, 985–994 (2010).
42. Abdollahi, M. et al. Effect of stabilization method and freeze/thaw-aided precipitation on structural and functional properties of
proteins recovered from brown seaweed (Saccharina latissima). Food Hydrocolloids (2019).
43. Love, R. M. The chemical biology of fishes. With a key to the chemical literature. The chemical biology of fishes. With a key to the
chemical literature. (1970).
44. Raa, J. & Gildberg, A. Autolysis and proteolytic activity of cod viscera. International Journal of Food Science & Technology 11,
619–628 (1976).
45. Arason, S. In Fisheries Processing: Biotechnological applications (ed A. M. Martin) 244–272 (Springer US, 1994).
46. Dosoretz, C. G., Chen, H.-C. & Grethlein, H. E. Effect of environmental conditions on extracellular protease activity in lignolytic
cultures of Phanerochaete chrysosporium. Appl. Environ. Microbiol 56, 395–400 (1990).
47. Undeland, I., Hultin, H. O. & Richards, M. P. Added triacylglycerols do not hasten hemoglobin-mediated lipid oxidation in washed
minced cod muscle. Journal of agricultural and food chemistry 50, 6847–6853 (2002).
48. Adams, A., Bouckaert, C., Van Lancker, F., De Meulenaer, B. & De Kimpe, N. Amino acid catalysis of 2-alkylfuran formation from
lipid oxidation-derived α, β-unsaturated aldehydes. Journal of agricultural and food chemistry 59, 11058–11062 (2011).
49. Damodaran, S. & Parkin, K. L. Fennema’s food chemistry. (CRC press, 2017).
50. Kristinsson, H. G. & Hultin, H. O. Changes in trout hemoglobin conformations and solubility after exposure to acid and alkali pH.
Journal of agricultural and food chemistry 52, 3633–3643 (2004).
51. Guo, Y. et al. Modeling and Optimizing the Synthesis of Urea-formaldehyde Fertilizers and Analyses of Factors Affecting these
Processes. Scientific Reports 8, 4504, https://doi.org/10.1038/s41598-018-22698-8 (2018).
52. Zhang, W., Zhu, Z., Jaffrin, M. Y. & Ding, L. Effects of hydraulic conditions on effluent quality, flux behavior, and energy
consumption in a shear-enhanced membrane filtration using box-behnken response surface methodology. Industrial & Engineering
Chemistry Research 53, 7176–7185 (2014).
53. Asadollahzadeh, M., Tavakoli, H., Torab-Mostaedi, M., Hosseini, G. & Hemmati, A. Response surface methodology based on central
composite design as a chemometric tool for optimization of dispersive-solidification liquid–liquid microextraction for speciation of
inorganic arsenic in environmental water samples. Talanta 123, 25–31 (2014).
54. Khodadadi, M. & Kermasha, S. Optimization of lipase-catalyzed interesterification of flaxseed oil and tricaprylin using response
surface methodology. Journal of the American Oil Chemists’ Society 91, 395–403 (2014).
55. Watson, M. A. et al. Response surface methodology investigation into the interactions between arsenic and humic acid in water
during the coagulation process. Journal of hazardous materials 312, 150–158 (2016).
56. Stoknes, I., Rustad, T. & Mohr, V. Comparative studies of the proteolytic activity of tissue extracts from cod (Gadus morhua) and
herring (Clupea harengus). Comparative Biochemistry and Physiology Part B: Comparative Biochemistry 106, 613–619 (1993).
57. Slizyte, R. et al. Bioactivities of fish protein hydrolysates from defatted salmon backbones. Biotechnology Reports 11, 99–109, https://
doi.org/10.1016/j.btre.2016.08.003 (2016).
58. Aspevik, T., Totland, C., Lea, P. & Oterhals, Å. Sensory and surface-active properties of protein hydrolysates based on Atlantic
salmon (Salmo salar) by-products. Process Biochemistry 51, 1006–1014 (2016).
59. Ismail, A., Bannenberg, G., Rice, H. B., Schutt, E. & MacKay, D. Oxidation in EPA-and DHA-rich oils: an overview. Lipid. Technology
28, 55–59 (2016).
60. Kristinsson, H. G. & Rasco, B. A. Fish protein hydrolysates: production, biochemical, and functional properties. Critical reviews in
food science and nutrition 40, 43–81 (2000).
61. Folador, J. et al. Fish meals, fish components, and fish protein hydrolysates as potential ingredients in pet foods. Journal of animal
science 84, 2752–2765 (2006).
62. Chalamaiah, M., Hemalatha, R. & Jyothirmayi, T. Fish protein hydrolysates: proximate composition, amino acid composition,
antioxidant activities and applications: a review. Food chemistry 135, 3020–3038 (2012).
63. Refstie, S., Olli, J. J. & Standal, H. Feed intake, growth, and protein utilisation by post-smolt Atlantic salmon (Salmo salar) in
response to graded levels of fish protein hydrolysate in the diet. Aquaculture 239, 331–349 (2004).
Acknowledgements
The authors wish to acknowledge the funding from the Swedish Research Council for sustainable development –
Formas [grant number 2016-14471-31962-77]. Also, the authors would like to thank Mehdi Abdollahi and Rikard
Fristedt for help with SEC, Bita Forghani for help with free amino acid analysis, Karin Larsson for help with
total nitrogen analyses, and Erik Johansson for help with multivariate analysis. Open access funding provided by
Chalmers University of Technology.
Author contributions
M.S. and I.U. designed the experiments; E.A. and M.L. were involved in related discussions. M.S. performed
experiments, analyzed and interpreted the data, and drafted the manuscript. All the authors reviewed the
manuscript, commented and contributed to write the manuscript.
Competing interests
The authors declare no competing interests.
Scientific Reports | (2020) 10:9590 | https://doi.org/10.1038/s41598-020-66152-0 12www.nature.com/scientificreports/ www.nature.com/scientificreports
Additional information
Supplementary information is available for this paper at https://doi.org/10.1038/s41598-020-66152-0.
Correspondence and requests for materials should be addressed to M.S.
Reprints and permissions information is available at www.nature.com/reprints.
Publisher’s note Springer Nature remains neutral with regard to jurisdictional claims in published maps and
institutional affiliations.
Open Access This article is licensed under a Creative Commons Attribution 4.0 International
License, which permits use, sharing, adaptation, distribution and reproduction in any medium or
format, as long as you give appropriate credit to the original author(s) and the source, provide a link to the Cre-
ative Commons license, and indicate if changes were made. The images or other third party material in this
article are included in the article’s Creative Commons license, unless indicated otherwise in a credit line to the
material. If material is not included in the article’s Creative Commons license and your intended use is not per-
mitted by statutory regulation or exceeds the permitted use, you will need to obtain permission directly from the
copyright holder. To view a copy of this license, visit http://creativecommons.org/licenses/by/4.0/.
© The Author(s) 2020
Scientific Reports | (2020) 10:9590 | https://doi.org/10.1038/s41598-020-66152-0 13You can also read