Photon-in/photon-out spectroscopy at the I20-scanning beamline at diamond light source
←
→
Page content transcription
If your browser does not render page correctly, please read the page content below
Journal of Physics: Condensed Matter

PAPER • OPEN ACCESS

Photon-in/photon-out spectroscopy at the I20-scanning beamline at
diamond light source
To cite this article: Shusaku Hayama et al 2021 J. Phys.: Condens. Matter 33 284003

View the article online for updates and enhancements.

                              This content was downloaded from IP address 46.4.80.155 on 31/08/2021 at 02:13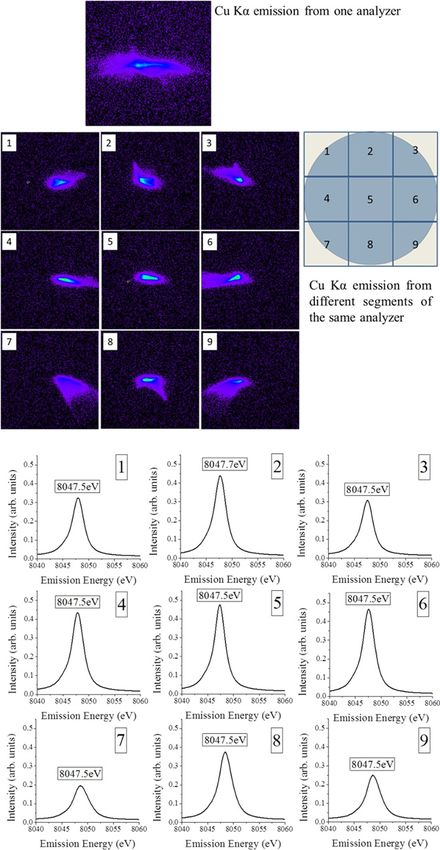
Journal of Physics: Condensed Matter

J. Phys.: Condens. Matter 33 (2021) 284003 (11pp)                                                                            https://doi.org/10.1088/1361-648X/abfe93

Photon-in/photon-out spectroscopy at the
I20-scanning beamline at diamond light
source
Shusaku Hayama1 , Roberto Boada1,2 , Jesús Chaboy1 , Adrian Birt1 ,
Graham Duller1 , Leo Cahill1 , Adam Freeman1 , Monica Amboage1 ,
Luke Keenan1 and Sofia Diaz-Moreno1,∗
1
  Diamond Light Source Ltd., Harwell Science and Innovation Campus, Didcot, Oxfordshire OX11 0DE,
United Kingdom
2
  Department of Chemistry, Universitat Autònoma de Barcelona, 08193 Bellaterra, Barcelona, Spain

E-mail: sofia.diaz-moreno@diamond.ac.uk

Received 30 January 2021, revised 3 April 2021
Accepted for publication 6 May 2021
Published 4 June 2021

Abstract
A scanning multi-crystal x-ray emission spectrometer to perform photon-in/photon-out
spectroscopy at the I20-Scanning beamline at Diamond Light Source is described. The
instrument, equipped with three analyzer crystals, is based on a 1 m Rowland circle
spectrometer operating in the vertical plane. The energy resolution of the spectrometer is of
the order of 1 eV, having sufficient resolving power to overcome the core-hole lifetime
broadening of most of the transition metals K-edges. Examples showing the capability of the
beamline for performing high energy resolution fluorescence detection x-ray absorption
spectroscopy (HERFD-XAS), non-resonant x-ray emission spectroscopy (XES) and resonant
x-ray emission spectroscopy are presented. The comparison of the Zn and Mn K-edge
HERFD–XANES of ZnO and MnO with ab initio calculations shows that the technique
provides enhanced validation of the models by making subtle spectral features more visible.
Keywords: x-ray spectroscopy, photon-in/photon-out spectroscopy, x-ray emission
spectroscopy, high energy resolution fluorescence detection x-ray absorption spectroscopy,
resonant x-ray emission spectroscopy, HERFD–XANES
(Some figures may appear in colour only in the online journal)

1. Introduction                                                                          structural probe, it is applicable to all states of matter; crys-
                                                                                         talline or amorphous solids, liquids and gases. These charac-
X-ray absorption spectroscopy (XAS) is an established exper-                             teristics make the technique suitable for application in many
imental technique at synchrotron radiation facilities that is                            different scientific disciplines, from chemistry and catalysis,
used for the study of the electronic and local atomic struc-                             to environmental science, materials science, physics, biology,
ture of materials [1–3]. The high sensitivity of the method                              and others.
together with its element selectivity make it possible to                                    In recent years, photon-in/photon-out core-level spectros
undertake experiments targeted on functional chemical sites                              copy has expanded the x-ray spectroscopy toolkit for invest
under realistic conditions of concentration. As XAS is a local                           igating chemically specific electronic and geometrical struc-
                                                                                         tures [4–6]. By analysing the energy of the scattered/emitted
∗
 Author to whom any correspondence should be addressed.                                  photons with high energy resolution with an energy band-
                  Original content from this work may be used under the terms
                                                                                         width on the order of the core-hole lifetime broadening of the
                  of the Creative Commons Attribution 4.0 licence. Any further
distribution of this work must maintain attribution to the author(s) and the title       inner-shell electron hole, the range of applications of conven-
of the work, journal citation and DOI.                                                   tional XAS is increased and some of its shortcomings can be

1361-648X/21/284003+11$33.00                                                         1       © 2021 The Author(s). Published by IOP Publishing Ltd   Printed in the UK
J. Phys.: Condens. Matter 33 (2021) 284003                                                                                      S Hayama et al

circumvented [7, 8]. High energy resolution fluorescence
detection XAS (HERFD–XAS), non-resonant x-ray emis-
sion spectroscopy (XES), and resonant x-ray emission spec-
troscopy (RXES), also called resonant inelastic x-ray scat-
tering, have been developed hand in hand with the increas-
ing accessibility of efficient x-ray emission spectrometers that
cover a large solid angle of detection.
    Most x-ray emission spectrometers operating at syn-
chrotron beamlines are based on multiple bent crystal anal-
ysers operating under Bragg scattering condition close to
back-scattering [9–20]. Point to point scanning spectrometers
are usually based on a Rowland circle geometry following
the Johann [21] or Johansson [22] schemes, while dispersive
spectrometers are usually realized in the von Hamos geome-
try [23]. In this report, we present a technical description of
the multi-analyser scanning hard x-ray emission spectrometer
that has been designed and built for the I20-Scanning beam-
line at Diamond Light Source [24], and illustrate its capabil-
ities with a range of examples. The beamline is particularly
well suited to house the emission spectrometer as it makes
use of a 2 m wiggler and is equipped with a state-of-the-art
four-bounce monochromator which can deliver tuneable, high-
brightness and stable hard x-rays to the end-stations [25]. The
beamline covers the energy range from 4 to 20 keV. The inci-
dent photon flux is >1012 photons per second when using the
Si(111) monochromator. The design of the I20 emission spec-
trometer has been optimised for carrying out HERFD–XAS,
XES, and RXES maps, and examples of these methods are
presented that demonstrate the capabilities of the instrument.
In addition, ab initio calculations performed at the Zn and
Mn K-edges for ZnO and MnO respectively, are compared
with the HERFD–XANES spectra, showing the good agree-
ment achieved between experiment and theory after enhanc-
ing the experimental sensitivity, and making the assignment of
near-edge spectral features much more reliable.
                                                                       Figure 1. Schematic illustration of the Rowland geometry, where
                                                                       s-sample, a-analyzer, d-detector, L-distance between the sample and
2. Spectrometer design                                                 analyzer (the analyzer and detector), R-the radius of curvature and
                                                                       dx and dy are the detector x and y positions respectively from s. The
Most of the point-to-point scanning x-ray emission spectrome-          sample position is fixed relative to the incident x-ray beam. θB is the
ters operating at synchrotron beamlines are based on a Johann-         Bragg angle.
type geometry [9–17] and the I20-Scanning spectrometer is
no exception. This geometry utilises spherical or cylindrical
analyser crystals that are bent to a radius, R, to maximise the        on the circle because the diameter of the Rowland circle is the
photon capture efficiency of the spectrometer. All the opti-           same as the radius of curvature of the crystal [11, 26]. A num-
cal components of the instrument, including the sample, are            ber of researchers have demonstrated that the approximation is
placed on a Rowland circle of diameter R (see figure 1). In            best satisfied when θB is close to backscattering (90◦ ), R is as
this set-up, the analyser crystal(s) will focus and collect pho-       largest as possible, and the diameter of the analyser crystal is
tons that are emitted from the sample onto the detector using a        as small as possible [27]. Consequently these parameters must
symmetric Bragg reflection, selecting photons of wavelength            be chosen carefully when designing this type of spectrometer
λ for a cubic system:                                                  to suit the needs of each beamline.
                                                                           The I20 spectrometer has a 1 m fixed diameter Rowland
                nλ = 2 sin(θB )(a/(h2 + k2 + l2 )1/2 )      (1)        circle and uses analyser crystals of 100 mm diameter. The
                                                                       spectrometer is currently equipped with three analyser crys-
where n is an integer, θB is the angle between the incoming            tals. The option of increasing the diameter of the Rowland
beam and the diffraction plane on the analyser, a is the lattice       circle to 2 m to enhance the overall spectral resolution of
parameter, and hkl are the Miller indices of the analyser. This        the instrument was considered at the conceptual design stage
expression is only an approximation for the Johann geometry            of the spectrometer. However, the 2 m design was discarded
as strictly speaking, only the centre of the analyser crystal is       due to the four-fold reduction in the collected solid angle,

                                                                   2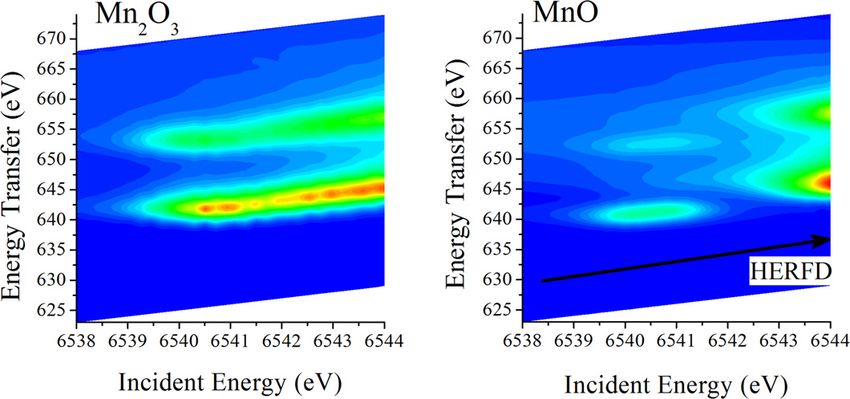
J. Phys.: Condens. Matter 33 (2021) 284003 S Hayama et al
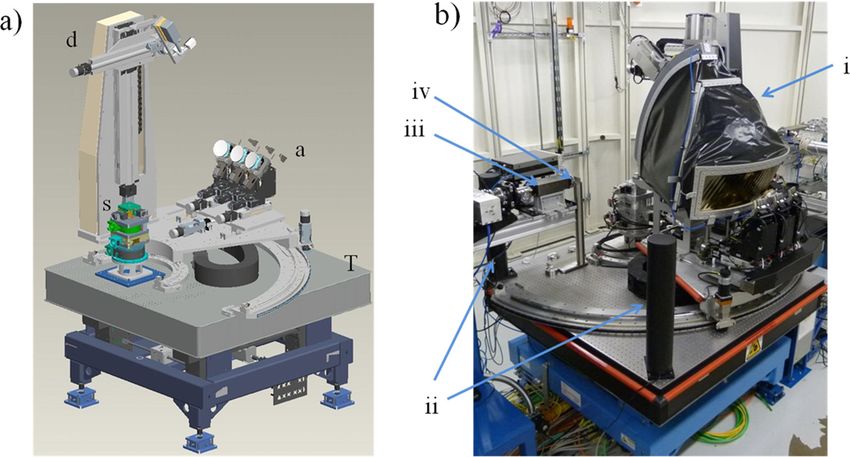
Figure 2. (a) Mechanical design of the I20 XES spectrometer: s-in-house sample stages, a-analyzer assembly, d-detector assembly and
T-experimental table. The illustration is only showing the spectrometer at 90◦ to the incoming beam but can be rotated around the sample
position. (b) Photo of the spectrometer: (i) helium bag, (ii) crosshair lasers, (iii) ion chamber and (iv) master aperture at the upstream
position (only used for alignment). The origin of the spectrometer is located at 57.025 m from the source.
∼0.016% instead of the ∼0.063% for a 100 mm diameter anal- The mechanical design of the hard x-ray I20-Scanning
yser crystal at 1 m. Furthermore, in the 2 m design it would emission spectrometer is illustrated in figure 2. The spec-
not be possible to take full advantage of the larger circle due trometer was designed, assembled and commissioned in-house
to the intrinsic resolution restrictions imposed by the spec- and is permanently mounted on a dedicated optical table
tral purity of the incident beam. In the case of I20, the four- (1.4 m × 1.4 m) in the experimental hutch of the I20-Scanning
bounce monochromator is equipped with Si(111) crystals, and, beamline. This set-up ensures that the accurate positioning of
although the dispersive configuration ensures that the incident the analyser crystals and the detector around the x-ray beam
energy resolution is maintained regardless of the configuration source position (sample) is always maintained. The optical
of the upstream optics, it makes a significant contribution on table is motorised, and the entire spectrometer can be moved
the overal resolution of the experiment. in the vertical plane and in the perpendicular direction to the
The geometry of the Rowland circle is another important incoming beam. We note that the sample position is the only
aspect that governs the total resolution of the spectrometer as fixed point of the instrument and acts as the origin of the spec-
trometer. On top of this table, there is a rotational motorised
demonstrated by Bergmann et al [27]. They have shown that
base-plate upon which all the components of the spectrometer
the source-size at the sample position is a very important fac-
are mounted. The motorised rotational movement, main_rot,
tor and should be minimised to achieve the highest spectral
is provided to allow the instrument to be moved around the
resolution. The Rowland circle of the I20 spectrometer has
sample position (−10 to +58◦, taken the 0◦ as the position
therefore been implemented in the vertical operating plane to
when spectrometer is in a perpendicular position to the x-ray
benefit from the smaller vertical source size; the beam-size beam) in the horizontal plane while maintaining the Rowland
at the sample position is 400 μm (h) × 300 μm (v) FWHM. alignment between the analyser crystals and the detector in
Choosing a vertical Rowland geometry also eliminates any the vertical plane. This motion greatly improves the flexibil-
dependency on the sample orientation: in typical emission ity of the spectrometer by making it possible to accept a wider
experiments, the sample is orientated at 45◦ in the horizontal range of sample environments by not limiting the incident
plane with respect to the incident beam to keep the analyser beam-spectrometer angle to 90◦ .
and detector perpendicular to the incoming beam. In the case In order to put the centre of the analyser surface on the
of a horizontal configuration, the horizontal source-size seen desired Rowland coordinates, each analyser crystal is mounted
by the analyser/detector would increase with increasing beam- on a motorised stage assembly consisting of tilt, lift (y-axis)
sample angle, essentially making an undesireable geometrical and pitch stages. The central analyser which lies along the x-
contribution to the energy resolution that is dependent on the axis when main_rot = 0◦ acts as a master for the other side
experimental set-up and sample alignment. analysers (minus and plus) and defines the diameter of the
3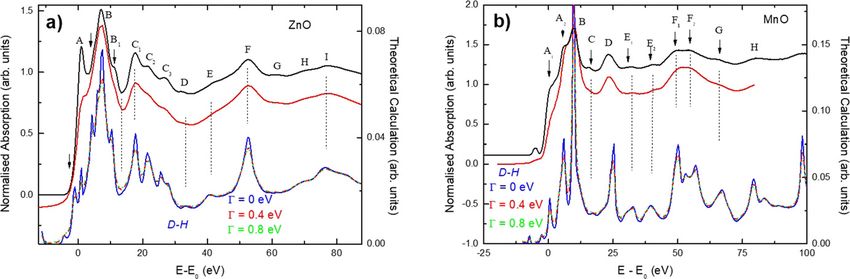
J. Phys.: Condens. Matter 33 (2021) 284003                                                                                            S Hayama et al

                                                                            Figure 4. Current list of the analyzer crystals that are available at
                                                                            I20 and the energy range covered by each crystal orientation.

                                                                            Figure 5. Spectra of elastically scattered photons measured with
                                                                            one Si(444) analyser crystal with a 90 mm diameter circular mask in
                                                                            the front. The spectrometer was set at 79.3◦ and 84◦ for (a) and
                                                                            (b) respectively. The quality of the focus improves significantly
                                                                            when close to backscattering. The FWHM of the elastic peak is
                                                                            ∼1.3 eV and ∼1.0 eV for (a) and (b) respectively.

                                                                            yser. The Rowland circles for the plus and minus analysers are
Figure 3. Images captured by the Medipix detector from one                  off-centre from the plane of the central Rowland circle, and
Si(111) analyzer crystal. All the images were taken at the maximum          must be tilted and moved in the horizontal direction as well as
of the Cu K α1 emission peak using the Si(444) reflection with the
spectrometer at ∼79.3◦ . To evaluate the quality of this analyzer
                                                                            in the vertical direction relative to the central analyser to main-
crystal, a square mask was placed in the front of the analyzer to           tain the Rowland condition. All the analyser stages, apart from
check the focus quality and spectral shape from nine separate               the tilt stages, are equipped with an encoder and each stage has
segments. These measurements show the bottom-edge of this                   enough resolution to allow a step-size of 0.2 eV.
analyzer crystal is affected by non-uniform strain and masking this             The detector movement must follow a large circular-arc,
small region of the crystal can greatly improve the energy-resolution
from this analyzer.
                                                                            pointing towards the analyser crystals and is placed at the
                                                                            focal point to maintain the Rowland condition. The detec-
Rowland circle, R. A decision has also been made to fix the                 tor is mounted on a small rotary goniometer via a detach-
central analyser at the same height as the sample position when             able adaptor plate. A set of motorized slits are available and
scanning the spectrometer. The analyser stages are mounted on               can be mounted in front of the detector when it is neces-
a large translation platform, with the central analyser assem-              sary to minimize the background signal. The detector assem-
bly fixed to this stage. To change the Bragg angle of the central           bly is carried by a highly rigid x–y axis positioning structure
analyser, it is only necessary to translate using this stage and            which is located on the main rotating platform. The detector
pitch towards the detector (see figure 1). The plus and minus               position in x and y coordinates relative to the sample posi-
analysers are located at ±137 mm from the centre analyser, and              tion (dx.dy) is shown in figure 1. Currently, the spectrometer
are equipped with additional short-range translation stages to              is operated in the energy range from 4.5 to 18 keV, and it
move them along the x-axis with respect to the central anal-                can be equipped with either a one-element Si-drift detector

                                                                        4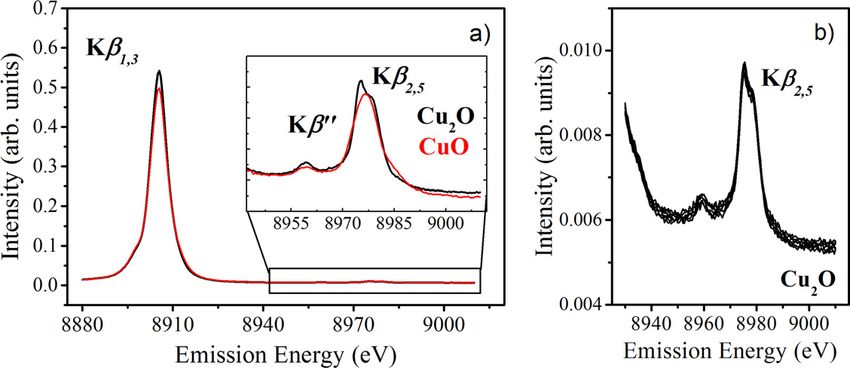
J. Phys.: Condens. Matter 33 (2021) 284003                                                                                      S Hayama et al

Figure 6. Comparison between normalised HERFD–XANES                     Figure 7. (a) Lα1 and Lα2 emission lines of a platinum foil. The
(black line) and normalised conventional XANES spectra for PtBr2        measured FWHM of the Lα1 is 4.2 ± 0.2 eV. (b) HERFD–XANES
and PtO2 .                                                              spectra collected at the Lα1 emission line. 60 consecutive scans are
                                                                        shown, demonstrating the excellent reproducibility of the
                                                                        measurements. Each scan was collected in 15 min to obtain a good
(SII Nanotechnology) or a Medipix-Merlin photon-counting                signal to noise ratio.
pixel detector. The Si-drift detector is mainly used to perform
experiments below 4.8 keV, as well as in those cases when               ply maximizing the count rate as with the Si-drift detector.
there is a need to discriminate unwanted photons selected by            Recently, a four element Medipix detector has been acquired
other harmonics of the analyser crystals (for example, to reject        for the beamline (14 mm × 56 mm). The wider version is
the La Lγ 1 , 5785.7 eV, from Ge(333) when collecting Co K β2,5 ,       particularly useful when operating the spectrometer below
7706 eV, from Ge(444) in LaCoO3 ). The Medipix detector is a            78◦, when the horizontal size of the focal spot at the detec-
high performance x-ray imaging detector that has been devel-            tor becomes too large to be captured with the single-element
oped at Diamond Light Source [28]. The active area of this              detector. In addition, the use of the larger detector offers the
detector is 14 mm × 14 mm with 55 μm pixel size and it                  possibility of collecting the beam from each analyser crystal
offers a 12 bit dynamic range per pixel with the possibility of         independently.
selecting a region of pixels to be acquired. A few examples of             Although the angular range of the spectrometer, θB , has
images taken with this detector are shown in figure 3. Because          been designed to cover the range from 85◦ to 60◦ , it is prefer-
a pixel detector is capable of directly imaging the secondary           able to use the spectrometer in a near-backscattering configu-
photons, it can be readily used to check the focus-quality and          ration with Bragg angles as close to 90◦ as possible [26]. To
radius of curvature of each analyser crystal by simply look-            help facilitate this, a battery of spherically-bent silicon and ger-
ing at the shape and size of the image that is being collected.         manium analyser crystals with different crystal cuts that can
Furthermore, it was found that the Medipix detector is espe-            operate at multiple orders of reflection (hkl) has been made
cially useful when aligning more than one analyser crystal. A           available (see figure 4).These crystal sets cover most of
better alignment with an improved spectral resolution is                the K α and K β emission lines of the first row transition
achieved having access to the beam image rather than sim-               metals. In recent years, strip-bent analyser crystals have

                                                                    5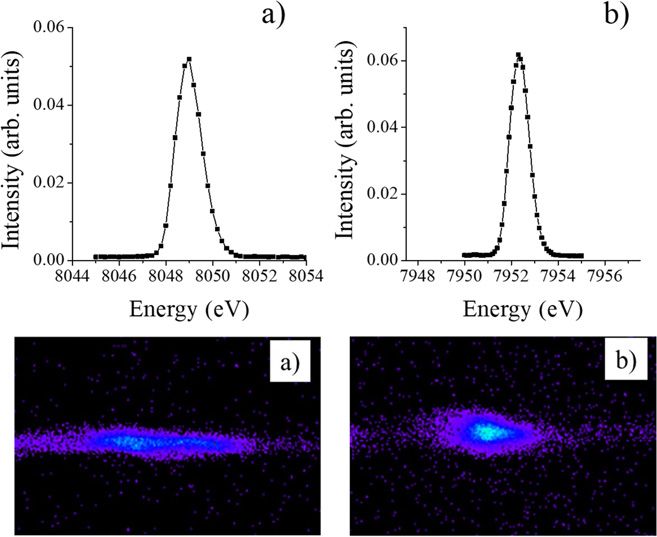
J. Phys.: Condens. Matter 33 (2021) 284003                                                                                       S Hayama et al

                                                                           Figure 9. PrBr2 HERFD–EXAFS taken with three Ge(660)
                                                                           analyser crystals and conventional EXAFS spectra taken in
                                                                           transmission mode (black lines) and best fit (red lines) performed
                                                                           using the Demeter software [48] and following standard procedures.
                                                                           The acquisition times for transmission and HERFD–EXAFS are
                                                                           approximately 20 and 80 min, respectively.

                                                                           2.1. Spectrometer alignment

                                                                           The alignment of the XES spectrometer is performed in three
                                                                           stages. The first step uses a laser tracker (Leica Absolute
                                                                           Tracker) to accurately place the analyser crystals and the detec-
                                                                           tor to a known position and set the position of each stage rela-
                                                                           tive to the origin of the spectrometer. In the case of the analyser
                                                                           stages, this was done at the backscattering geometry, θB = 90◦ ,
                                                                           adjusting the stages until the centre of the analyser surface was
                                                                           located at the same height and translated 1000 mm from the
Figure 8. (a) Normalised HERFD–XANES spectra for MnO (black                sample position. The offset in the analyser stages was then set
line), Mn2 O3 (red line) and MnO2 (blue line). (b) The edge                so that the current readback values were consistent with the
positions, taken as the maximum of the first derivative) are plotted       θB = 90◦ positions. The pitch and tilt analyser stages were
as a function of the formal oxidation state with the Mn foil edge          then set to the θB = 90◦ position using a high-precision square
position (6539 eV) at the origin.
                                                                           spirit level. The laser tracker and a small reflector were also
                                                                           used to identify the centre of rotation of the detector and the
                                                                           main horizontal rotation stages.
become commercially available [29], providing a smaller                        The next step of alignment is achieved using a set of laser-
focus and improved energy-resolution than the single-wafer                 alignment tools especially developed for the spectrometer. The
type crystals, thanks to the reduced strain [30].                          alignment tools consist of a master aperture, secondary aper-
   Finally, the spectrometer is equipped with a helium-filled              ture with a laser, and two crosshair lasers (figure 2(b)). The
bag that is placed between the sample position, the analyser               master aperture has a fixed pin-hole of 0.8 mm diameter and
crystals and the detector to minimise the air path (figure 2(b)            is designed so that it can be accurately located at two posi-
shows a photograph of the spectrometer with the helium-bag                 tions: (i) with the aperture at the sample position and (ii) just
in place). The helium bag is constructed from a rigid structure            upstream of this position with the pin-hole aligned with the
and two large kapton windows (25 μm thickness) and it can                  sample position. The master aperture is predominantly used
be used for the entire operational range of the spectrometer.              in the upstream position for aligning the origin of the spec-
The use of a helium environment is essential as the absorption             trometer to the incident x-ray beam by adjusting the optical
coefficient of air is not negligible in the working energy range           table (x and y) until the incident beam is at the centre of the
of the spectrometer. For example, at 10 keV, the absorption                pin-hole. The two cross-hair lasers are permanently mounted
coefficient of air is 0.00 59 cm−1 , hence only ∼30% of photons            at the upstream corners of the optical table and the intersection
are transmitted through 200 cm of air. At 5 keV, almost all the            of their crosshairs is used to identify the position of the sample.
photons are lost as the absorption coefficient of air increases            The secondary aperture laser system is adjustable and used for
to 0.048 cm−1 .                                                            aligning the analyser crystals and detector by shining the laser

                                                                       6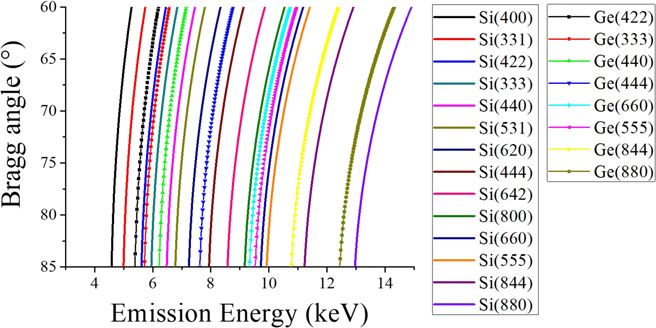
J. Phys.: Condens. Matter 33 (2021) 284003                                                                                       S Hayama et al

Figure 10. (a) K β XES for Cu2 O and CuO. The intensity of the K β2,5 line is very weak, only about 1.5% of the main K β1,3 line; (b) six
consecutives scans (8 s per point) taken from the Cu2 O samples in the satellite region.

on the crystal surface and checking the position of the reflected         spectrometer geometry and the quality of analyser crystals, but
beam at the detector. If necessary, small manual adjustments              it can be routinely estimated by measuring the width of an elas-
(tilt, x and y) of each analyser holder and/or the detector stages        tic scattering peak once the upstream optics and the spectrom-
are carried out in order to place the reflected beam on the cen-          eter is configured for a specific emission line. Figure 5 shows
tre of the detector to satisfy the Rowland condition. Typically           the emission spectra of elastically scattered photons from a vit-
this process is repeated at two Bragg positions to confirm that           reous carbon foil measured using the XES spectrometer at two
the linearity of the spectrometer is maintained within the mea-           different angles. The spectra were acquired using the Si(111)
surement range of interest. It should also be noted that the              monochromator that has been calibrated at the Cu K-edge and
secondary aperture system is carefully aligned to ensure the              one Si(444) analyser crystal, mounted on the central analyser
laser beam overlays the path of emitted photons as closely as             position. The incident intensity was simultaneously measured
possible. This is done by ensuring that the secondary aperture            using an 15 cm long ion chamber (OKEN) and the position
is at the sample position using the crosshairs of the upstream            sensitive Medipix detector was used to measure the emitted
lasers and simultaneously passing the secondary laser beam                photons. As expected, the resolution improves significantly
through the master aperture located at its upstream position to           when the spectrometer is rotated from 79.3◦ to 84◦ , as the geo-
make the laser beam parallel with the horizontal plane.                   metrical contributions to the energy resolution are minimized
    The final step of alignment is done with x-rays to correct            the closer to backscattering geometry the spectrometer oper-
for any small mismatch (e.g. miscut of the crystal) between               ates. Since the measured energy resolution can be estimated as
the laser and x-ray positions by simply finding the peak of               a convolution of the incident and spectrometer resolutions, and
the chosen emission line from a metal foil with the beam-                 the intrinsic resolution of the Si(111) monochromator is about
line monochromator set between 100 eV to 200 eV above the                 1.0 eV at 8 keV, we can estimate that the energy resolution of
absorption edge. When more than one analyser crystal is used,             the spectrometer equipped with the Si(444) analyser is of the
each is aligned separately to ensure that the energy calibration          order of 0.8 eV at the Cu K α -line energy (8047.8 eV, 79.3◦).
and linearity of the emission spectra are consistent from one             Although this is an estimate only as the measured line shape
analyser to the other. We note that only minor adjustments to             is neither totally symmetric nor Gaussian-like, it still demon-
the tilt and pitch of the analyser stages are typically needed to         strates that the inherent resolution of the I20 spectrometer is
find the emission line at the detector. Once the spectrometer is          remarkably good.
aligned, the peak of the main emission line (or elastically scat-             To demonstrate the capabilities of the emission spectrome-
tered peak) is recorded and the energy of the spectrometer is             ter, three different types of experiments are described below.
calibrated to the tabulated value [31]. If the Medipix detector           3.1. High energy resolution fluorescence detection XAS
is in use, the diameter of the Rowland circle, R, is also tweaked
until the best focus and energy-resolution are attained. The sec-         HERFD–XAS data is collected by aligning the spectrometer
ond and third steps described above are always repeated when              to the maximum of the emission line of interest, while the inci-
the spectrometer is reconfigured to measure different emission            dent energy is scanned through the absorption edge (XANES)
lines.                                                                    and/or over the extended energy region (EXAFS). The inten-
                                                                          sity variation of the emitted line is recorded as a function of
                                                                          the incident energy.
3. Spectrometer capabilities                                                  Figure 6 shows a comparison between the HERFD
                                                                          –XANES spectra and the conventional XANES spectra col-
The overall energy resolution of the spectrometer is variable             lected in transmission mode on the same platinum contain-
and difficult to calculate accurately as it depends greatly on the        ing samples. The high-energy resolution spectra were obtained

                                                                      7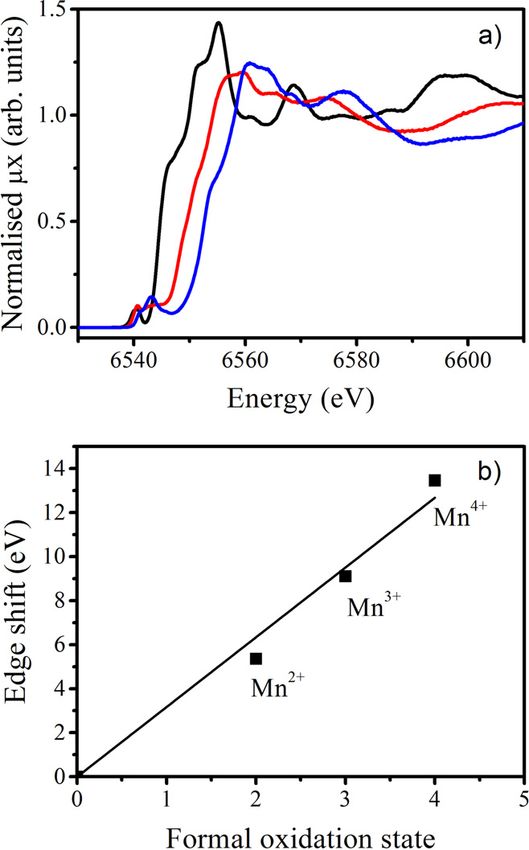
J. Phys.: Condens. Matter 33 (2021) 284003                                                                                           S Hayama et al

                                                                                the XANES) shifts to higher energy with increasing oxida-
                                                                                tion state of the manganese centre, as was already shown by
                                                                                Zaharieva et al using conventional XANES [35]. Our results
                                                                                show that HERFD–XANES can be applied in a similar man-
                                                                                ner but with much greater accuracy than with conventional
                                                                                XANES, thanks to its higher spectral resolution and the fact
                                                                                that the background in the pre-edge and edge regions is signif-
                                                                                icantly supressed when using the emission spectrometer. We
                                                                                estimate that the accuracy of the measured edge position is of
                                                                                the order of ±0.1 eV.
                                                                                    In much the same way as HERFD–XANES, HERFD
                                                                                –EXAFS measurements are also possible using the XES spec-
                                                                                trometer as is demonstrated in figure 9, showing that the
Figure 11. V2C–XES for Cr3 C2 , CrN and Cr2 O3 . The energy                     EXAFS signal of PrBr2 taken with the spectrometer overlaps
position of the K β  emission line is given by the nature of the ligand       with the spectrum taken in transmission mode, althought the
bond to the chromium centre.                                                    noise level in the former is slightly higher.
                                                                                    It is important to note that EXAFS measurements using the
using three Ge(660) analyser crystals with the spectrometer                     spectrometer are limited due to the inherently low detection
fixed at the Pt Lα1 emission line and scanning the incident                     efficiency and only feasible for concentrated samples that can
energy across the Pt L3 -edge. To check the energy calibra-                     provide sufficient signal-to-noise over the wider energy range
tion of the spectrometer, the emission line of a platinum metal                 where the EXAFS oscillations are weak. In practical terms, it
foil (Goodfellow, 5 μm thickness) was measured with the                         is usually more convenient to perform EXAFS measurements
incident energy set well-above the Pt L3 absorption edge (11                    using conventional XAS.
564 eV). The measured Lα1 and Lα2 emission energies and the                         There are however cases when the spectrometer can be
line shape of the Lα1 emission line (see figure 7) verify that                  used to overcome some of the main drawbacks of standard
the linearity and calibration of the spectrometer are excellent                 fluorescence measurements. For example, the capability of
in the measurement range. We have also checked the repro-                       the spectrometer to separate fluorescence contributions that
ducibility of the HERFD–XANES scans by repeatedly tak-                          are very close together in energy, can be used for the study
ing the same spectra with the XES spectrometer positioned at                    of samples containing additional elements with fluorescence
the peak of the measured Lα1 emission line (9442.3 eV, θB =                     emission lines that are very close in energy to those of the
79.93◦) using three analyser crystals. We see that the edge fea-                element of interest, and the latter is present only in relative
tures are extremely reproducible with no visible change in the                  low concentration. In those cases, conventional fluorescence
edge position over a time span of 14 h, and these scans can                     XAS methods are not able to extract the structural information
be safely merged without additional alignment of the energy                     about the minority component, even when using energy dis-
scale. The features in the edge region measured with the spec-                  criminating detectors, as the resolving powder is insufficient
trometer are sharper and better defined than when measured                      to resolve the lines. In addition, HERFD–XAS can also be
using conventional XANES, due to the capability of the mea-                     used to suppress diffraction peaks in XAS measurements of
surements taken with the spectrometer to overcome the core-                     polycrystalline samples measured in fluorescence mode that
hole lifetime broadening [7]. This capability makes the task                    otherwise distort the absorption spectrum.
of assigning a particular feature of the near-edge much more                    3.2. Non-resonant x-ray emission spectroscopy
reliable and offers new insight into qualitative or fingerprint-
ing interpretations of the XANES structures. Furthermore, the                   XES is performed by scanning the spectrometer over the emis-
spectrometer can be used to probe a specific decay-channel                      sion line of interest while keeping the incident energy at a fixed
in the edge region by tuning to a particular emission line of                   value well above the absorption edge, typically between 100
interest, providing yet another powerful tool for studying the                  and 200 eV.
electronic/spin states of matter.                                                  The energy position and line shape of the emission lines
    The XANES region of the absorption spectrum is sen-                         provide information about the electronic configuration of the
sitive to the electronic structure and local geometry around                    absorbing centre. For example, the shift in energy of the K α
the absorbing atom [1–3]. The energy shift of the absorp-                       emission lines has been used to determine the formal oxidation
tion threshold is related to the oxidation state of the absorber                state of sulphur containing compounds [36], while the K β lines
through the modification of the next-neighbouring interatomic                   have provided useful information regarding the spin state of
distances and, consequently, the edge position is very often                    Mn in GaN [37].
used to determine formal oxidation states [32–34]. Figure 8                        The K β emission lines for two copper oxide samples are
shows a set of K-edge HERFD–XANES of a series of man-                           shown in figure 10. The measurements were taken using three
ganese oxides. These spectra were collected using one Si(422)                   Si(642) analyser crystals while maintaining the incident x-ray
analyser crystal with the spectrometer fixed at the Mn K α1 line                energy fixed at 9012 eV. Three analyser crystals were needed
(5898.75 eV). As shown in the figure, the edge position of the                  to maximise the efficiency of the spectrometer, as the K β emis-
spectra (determined as the maximum of the first derivative of                   sion lines are significantly weaker than the K α emission lines:

                                                                            8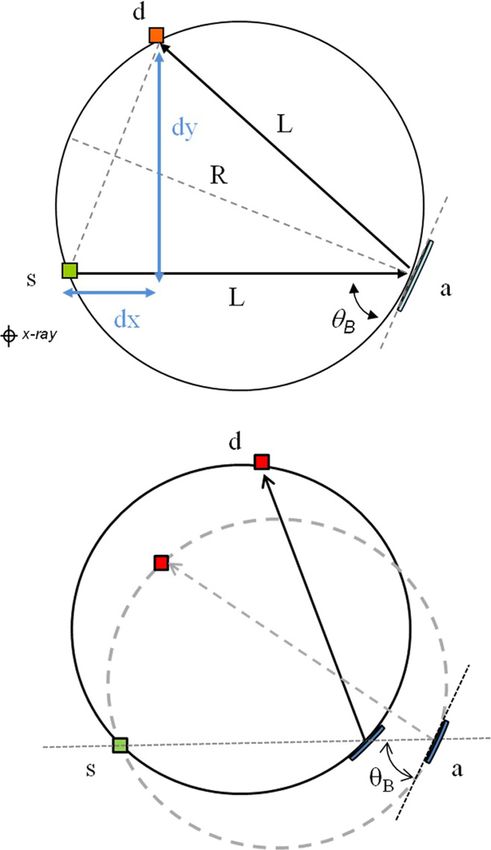
J. Phys.: Condens. Matter 33 (2021) 284003                                                                                    S Hayama et al

Figure 12. RXES maps for Mn2 O3 and MnO2 . The intensity is scaled to the edge step. Slicing along the vertical axis of the above plots can
provide L-edge like information.

for Cu, the K β1,3 line is ∼17% of the K α1 line, and sub-                  RXES maps from two different manganese oxides have
sequently more challenging to measure. This is particularly              been collected to further demonstrate the potential of the
true for the the very weak K β2,5 and the K β  satellite line,         I20 spectrometer, using three Si(422) analyser crystals. The
often called valence to core (V2C) region, when long acqui-              obtained data are comparable with what has already been pub-
sition times are often needed to obtain a spectrum with a good           lished in the literature [43]. In the case of the measured man-
enough signal-to-noise ratio. In the case of the copper oxides,          ganese oxide samples, the pre-edge region has been shown to
we measured the V2C region separately to decrease the num-               reveal information on the upper-band excitations with energies
ber of data points, and each set of measurements took approx-            much lower than the energy of the incident x-rays as the final
imately 3 h to record (six consecutive scans with 8 s per point          state of RXES is equivalent to the L-edge excitation (2p3dn+1 ).
acquisition time). We can see from figure 10 that the consis-
tency of the spectra is excellent, thanks to the good stability
of the spectrometer and detector, so the spectra can safely be
merged to increase the signal quality.                                   4. Illustrative example
    V2C XES studies have become increasingly used in recent
years as the technique provides a method to directly probe the           As an advanced illustrative example the Zn and Mn K-
valence levels of the absorbing centre. The V2C transitions              edge HERFD–XANES spectra of ZnO and MnO measured
arise from orbitals of mainly ligand character, making them              at the Zn and Mn K α1 emission line (2p3/2 –1s transition)
very sensitive to the nature and the electronic structure of the         are shown in figure 13, together with the spectrum col-
coordinating ligand [38–42]. Figure 11 shows the V2C–XES                 lected from the same compound using conventional XAS in
for three chromium compounds. As can be seen in the figure,              transmission detection mode. As expected, a clear resolution
the position in energy of the satellite emission line moves              enhancement is observed: features A, C1, C2 and C3 in the
towards higher energy when the coordinating ligand changes               ZnO and A1 and A2 in the MnO are better resolved in the
from C, to N and to O. This can be used to overcome one                  HERFD–XANES, while others (B1 and D in ZnO and C and
of the main limitations of conventional XAS: the inability to            E1 in MnO) are simply not visible in the conventional XANES
distinguish ligands that are neighbouring in the periodic table.         spectrum.
                                                                             Ab initio calculations for the K-edge XANES in ZnO-
                                                                         wurtzite and MnO were carried out by using the multiple-
3.3. Resonant x-ray emission spectroscopy
                                                                         scattering code CONTINUUM [44], based on the one-electron
In contrast with XES, when performing RXES, the incident                 full-multiple-scattering theory [45]. In both cases, the XANES
energy is tuned to a resonant feature in the absorption edge.            computations were performed for clusters including the con-
RXES measurements are usually taken at a variety of incident             tributions of neighbouring atoms within the first 8 Å around
energies across the edge, producing two dimensional maps of              the photoabsorber and by using the Dirac-Hara exchange and
the emission energy versus the incident energy. The maps are             correlation potential. No fitting parameters were used in the
usually shown as the incident energy versus the transfer energy          calculations. A complete discussion of the procedure can be
(figure 12), and a diagonal line through the RXES plane cor-             found elsewhere [46, 47]. The results of the calculation are
responds to a scan of the incident energy at fixed emission              reported in figure 13, where different convolution values have
energy, e. g. to the HERFD–XANES spectrum. As shown in                   been used to illustrate the effect of resolution broadening.
figure 12, by measuring the RXES map, additional information                 As can be seen in the figure, the computations performed
about intermediate states can be revealed.                               show a very good agreement with the experimental results,

                                                                     9
J. Phys.: Condens. Matter 33 (2021) 284003 S Hayama et al
Figure 13. Comparison of the normalised HERFD–XANES (black line) and conventional XANES (red line) spectra for ZnO (panel (a)) and
MnO (panel (b)), and the results of ab initio computations performed by using the multiple-scattering code CONTINUUM (see text for
details).
both in the energy position and the relative intensity of the will allow the spectrometer to operate in a two-colour mode
spectral features. It is important to highlight that the simula- with the possibility of measuring two emission lines simulta-
tions reproduce remarkably well those features that are present neously. The spectrometer will also be designed ground up to
in the HERFD–XANES experimental spectra but that are not allow the pitch stages to be scanned in a coordinated manner
visible or poorly defined in the conventional XANES spectra. to facilitate quick-scanning of the emission energy in approxi-
This demonstrates the power of HERFD–XANES to enhance mately ±20 eV range. These developments are expected to be
the experimental sensitivity of the spectroscopic method by available to the user community in 2023.
overcoming the core-hole lifetime broadening, and shows how
it can be used to better discriminate between various theoreti- Acknowledgments
cal models.
We acknowledge Diamond Light Source for providing beam-
5. Conclusions time at beamline I20-Scanning. We would like to thank Mark
Lunnon, Trevor Orpin, Adrian Marsh and the Diamond Survey
An x-ray emission spectrometer has been successfully Group for their invaluable work carried out when building and
designed and commissioned for the I20-Scanning beamline installing the spectrometer. We also thank Chris Coles and Iain
at Diamond Light Source. The excellent energy stability and Hall for implementing the data acquisition routines and GUI
reproducibility of the spectrometer have been demonstrated by software to control the spectrometer.
collecting three different types of measurements: (i) scanning
Data availability statement
the monochromator with the spectrometer at a fixed energy
(HERFD–XANES); (ii) scanning the spectrometer with the
The data that support the findings of this study are available
monochromator at a fixed energy (XES) and (iii) scanning both
upon reasonable request from the authors.
the monochromator and the spectrometer (RXES maps). One
of the key aims of this work was to develop a robust emis-
sion spectrometer that can be routinely operated by the user ORCID iDs
community and this goal has been achieved.
An upgrade of the spectrometer is currently under way. The Sofia Diaz-Moreno https://orcid.org/0000-0001-7616-
new instrument will still be based on a 1 m diameter Row- 6515
land circle operating in the Johann configuration in the ver-
tical plane, but the number of the analyser crystals will be References
increased from three to fourteen to greatly increase the effi-
[1] Bunker G 2010 Introduction to XAFS: A Practical Guide to
ciency of the instrument. To accommodate this large number
X-ray Absorption Fine Structure Spectroscopy (Cambridge:
of crystals, the spectrometer will be configured in two rows Cambridge University Press)
of seven analyser crystals each, and two 4e Medipix detec- [2] Filipponi A 2001 J. Phys.: Condens. Matter. 13 R23–60
tors will be used to maintain two independent Rowland circles. [3] Evans J 2017 X-ray Absorption Spectroscopy for the Chemical
The use of two detectors will enable the option for collecting and Materials Sciences (New York: Wiley)
[4] van Bokhoven J A and Lamberti C 2016 X-ray Absorption and
the photons selected by the 14 analyser crystals on different
X-ray Emission Spectroscopy: Theory and Applications (New
spots to avoid the saturation of the detectors. This will also York: Wiley)
enable the selection of the regions of the focal spot that offer [5] Glatzel P, de Groot F M F and Bergmann U 2009 Synchrotron
the best possible energy resolution. This innovative design Radiat. News 22 12
10J. Phys.: Condens. Matter 33 (2021) 284003 S Hayama et al
[6] Glatzel P, Weng T-C, Kvashnina K, Swarbrick J, Sikora M, [28] Plackett R, Horswell I, Gimenez E N, Marchal J, Omar D and
Gallo E, Smolentsev N and Mori R A 2013 J. Electron Tartoni N 2013 J. Instrum. 8 C01038
Spectrosc. Relat. Phenom. 188 17 [29] https://xrstech.com/
[7] Glatzel P and Bergmann U 2005 Coord. Chem. Rev. 249 65 [30] Rovezzi M, Lapras C, Manceau A, Glatzel P and Verbeni R 2017
[8] Hämäläinen K, Siddons D P, Hastings J B and Berman L E 1991 Rev. Sci. Instrum. 88 013108
Phys. Rev. Lett. 67 2850 [31] Thompson A C 2009 X-ray Data Booklet (California: LBNL)
[9] Hazemann J-L et al 2009 J. Synchrotron Radiat. 16 283 [32] Glatzel P, Smolentsev G and Bunker G 2009 J. Phys.: Conf. Ser.
[10] Kleymenov E et al 2011 Rev. Sci. Instrum. 82 065107 190 012046
[11] Sokaras D et al 2013 Rev. Sci. Instrum. 84 053102 [33] Chaboy J 2009 J. Synchrotron Radiat. 16 533
[12] Kvashnina K O and Scheinost A C 2016 J. Synchrotron Radiat. [34] Farges F 2005 Phys. Rev. B 71 155109
23 836 [35] Zaharieva I et al 2009 J. Phys.: Conf. Ser. 190 012142
[13] Duan P, Gu S, Cao H, Li J and Huang Y 2016 X-ray Spectrom. [36] Devillers T et al 2012 Sci. Rep. 2 722
46 12 [37] Alonso Mori R, Paris E, Giuli G, Eeckhout S G, Kavčič M,
[14] Finkelstein K D, Pollock C J, Lyndaker A, Krawcyk T and Žitnik M, Bučar K, Pettersson L G M and Glatzel P 2009
Conrad J 2016 AIP Conf. Proc. 1741 030009 Anal. Chem. 81 6516
[15] Moreti Sala M et al 2018 J. Synchrotron Radiat. 25 580 [38] Pollock C J and DeBeer S 2011 J. Am. Chem. Soc. 133
[16] Ablett J M et al 2019 J. Synchrotron Radiat. 26 1 5594
[17] Glatzel P et al 2021 J. Synchrotron Radiat. 28 362 [39] Bauer M 2014 13827 Phys. Chem. Chem. Phys. 16 13827–37
[18] Klementiev K, Preda I, Carlson S, Sigfridsson K and Norén K [40] Rovezzi M and Glatzel P 2014 Semicond. Sci. Technol. 29
2016 J. Phys.: Conf. Ser. 712 012018 023002
[19] Szlachetko J et al 2012 Rev. Sci. Instrum. 83 103105 [41] Pollock C J and DeBeer S 2015 Acc. Chem. Res. 48 2967
[20] Alonso-Mori R et al 2012 Rev. Sci. Instrum. 83 073114 [42] Cutsail G E, Gagnon N L, Spaeth A D, Tolman W B and
[21] Johann H H 1931 Z. Phys. 69 185 DeBeer S 2019 Angew. Chem., Int. Ed. 58 9114
[22] Johansson T 1933 Z. Phys. 82 507 [43] Glatzel P et al 2004 J. Am. Chem. Soc. 126 9946
[23] Hámos L v 1932 Naturwissenschaften 20 705 [44] Natoli C R, Misemer D K, Doniach S and Kutzler F W 1980
[24] Diaz-Moreno S et al 2018 J. Synchrotron Radiat. 25 998 Phys. Rev. A 22 1104
[25] Hayama S et al 2018 J. Synchrotron Radiat. 25 1556 [45] Natoli C R and Benfatto M 1986 J. Phys. Colloques 47 C8
[26] Collart E, Shukla A, Gélébart F, Morand M, Malgrange C, [46] Guglieri C and Chaboy J 2010 J. Phys. Chem C 114 19629
Bardou N, Madouri A and Pelouard J-L 2005 J. Synchrotron [47] Guglieri C, Céspedes E, Prieto C and Chaboy J 2011 J. Phys.:
Radiat. 12 473 Condens. Matter. 23 206006
[27] Bergmann U and Cramer S P 1998 Proc. SPIE. 3448 198 [48] Ravel B and Newville M 2005 J. Synchrotron Radiat. 12 537
11You can also read