Genesis of the Koka Gold Deposit in Northwest Eritrea, NE Africa: Constraints from Fluid Inclusions and C-H-O-S Isotopes
←
→
Page content transcription
If your browser does not render page correctly, please read the page content below
Article

Genesis of the Koka Gold Deposit in Northwest
Eritrea, NE Africa: Constraints from Fluid Inclusions
and C–H–O–S Isotopes
Kai Zhao 1, Huazhou Yao 1, Jianxiong Wang 1, Ghebsha Fitwi Ghebretnsae 2, Wenshuai Xiang 1
and Yi-Qu Xiong 3,4,*
 1 Wuhan Center, China Geological Survey (Central South China Innovation Center for Geosciences),
   Wuhan 430205, China; kabao_8725@163.com (K.Z.); yaohuazhou123@163.com (H.Y.);
   wangjianxiong00@163.com (J.W.); oldwenzi@163.com (W.X.);
 2 State Key Laboratory of Geological Processes and Mineral Resources, Faculty of Earth Sciences,

   China University of Geosciences, Wuhan 430074, China; ohghebsh@gmail.com
 3 State Key Laboratory of Geological Processes and Mineral Resources, Faculty of Earth Resources,

   Collaborative Innovation Center for Exploration of Strategic Mineral Resources,
   China University of Geosciences, Wuhan 430074, China
 4 Key Laboratory of Metallogenic Prediction of Nonferrous Metals and Geological Environment Monitoring,

   Ministry of Education, School of Geosciences and Info-Physics, Central South University,
   Changsha 410083, China
 * Correspondence: xiongyiqu@126.com

 Received: 14 January 2019; Accepted: 21 March 2019; Published: 27 March 2019

 Abstract: The Koka gold deposit is located in the Elababu shear zone between the Nakfa terrane
 and the Adobha Abiy terrane, NW Eritrea. Based on a paragenetic study, two main stages of gold
 mineralization were identified in the Koka gold deposit: (1) an early stage of
 pyrite–chalcopyrite–sphalerite–galena–gold–quartz vein; and (2) a second stage of pyrite–quartz
 veins. NaCl-aqueous inclusions, CO2-rich inclusions, and three-phase CO2–H2O inclusions occur in
 the quartz veins at Koka. The ore-bearing quartz veins formed at 268 °C from
 NaCl–CO2–H2O(–CH4) fluids averaging 5 wt% NaCl eq. The ore-forming mechanisms include fluid
 immiscibility during stage I, and mixing with meteoric water during stage II. Oxygen, hydrogen,
 and carbon isotopes suggest that the ore-forming fluids originated as mixtures of metamorphic
 water and magmatic water, whereas the sulfur isotope suggests an igneous origin. The features of
 geology and ore-forming fluid at the Koka deposit are similar to those of orogenic gold deposits,
 suggesting that the Koka deposit might be an orogenic gold deposit related to granite.

 Keywords: C–H–O isotopes; fluid inclusion; Koka deposit; orogenic gold deposit

1. Introduction
      The Nubian Shield, located in northeastern Africa, is an important Gondwana metallogenic
domain [1,2] that formed during the Neoproterozoic Pan-African orogenic cycle (ca. 900–550 Ma)
[2,3]. Most of the Volcanic-associated Massive Sulfide (VMS) type and quartz vein-hosted gold ±
sulfide deposits and occurrences in Eritrea are concentrated along NNW- and NNE-trending narrow
zones in the south Nubian Shield [4]. Ghebreab et al. [5] named these zones, the Augaro-Adobha Belt
(AAB) and the Asmara-Nakfa Belt (ANB). Both the world class Bisha VMS and Koka gold deposits
are located in the AAB copper and gold metallogenic belt [6,7].
      The Koka gold deposit is located in northwest Eritrea, which has a long mining history that
extends back to the Egyptian Pharaohs. However, modern mining began in the early 20th century.
Minerals 2019, 9, 201; doi:10.3390/min9040201                                   www.mdpi.com/journal/minerals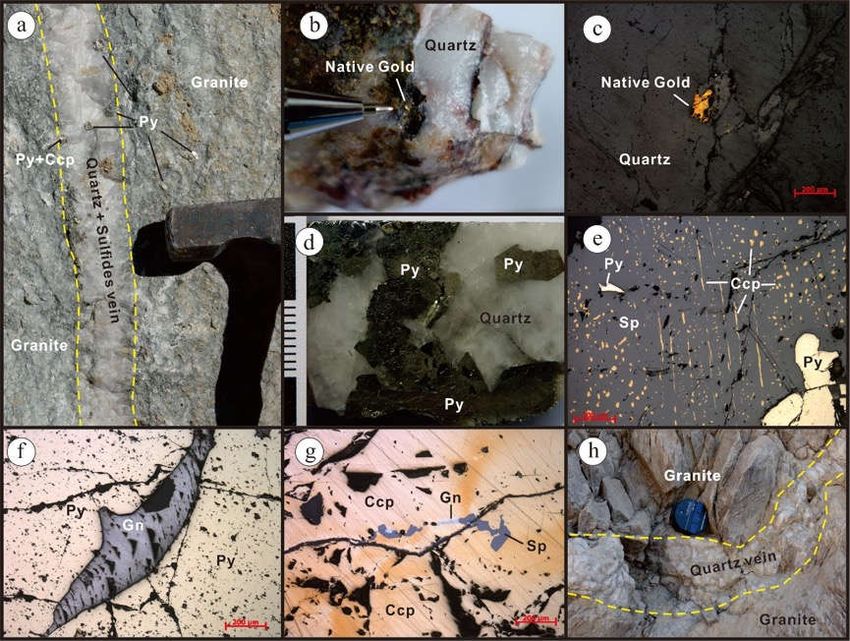
Minerals 2019, 9, 201                                                                         2 of 20

During the Italian colonization, until it was terminated due to the war for independence. Following
independence in 1991, several foreign mining companies from China, South Africa, India, Japan, the
United Kingdom, Australia, and Canada have been involved in exploring the mineral potential of
the country. As a result of several years of explorations, Koka gold still has promising prospects.
     Previous studies have suggested that the Koka deposit is a vein-type gold deposit, which is
controlled by the shear zone and Koka granite, and is considered to be an orogenic-like gold deposit
[8]. However, orogenic gold deposits are commonly unrelated to the granite [9–11], making the
genesis of Koka gold deposits enigmatic. The key question is the metal and fluid source, and the
evolutionary history of ore-forming fluid.
     Therefore, in order to understand the genesis of the Koka deposit, we conducted a detailed
study of deposit geology, fluid inclusions (FIs), quartz C–H–O isotopes, and the sulfide S isotope of
the Koka gold deposit to better constrain the fluid and metal source, ore-forming fluid evolutionary
history, and genesis.

2. Regional Geology
     Tectonically, the Koka gold deposit is located in the south Nubian Shield. The shield was
formed by the collision between East and West Gondwana upon the closure of the Mozambique
Ocean during the Neoproterozoic Pan-African orogenic cycle (ca. 900–550 Ma) (Figure 1a) [3]. The
prolonged tectonomagmatic evolution of the Arabian-Nubian Shield involves the rifting and
breakup of Rodinia, the formation and accretion of island-arcs, continental collision, extension, and
orogenic collapse [2]. Voluminous magmatic activities have also been recorded that are associated
with all phases of the tectonic evolution. High strain NNE to NNW trending brittle–ductile shear
zones conformable with major fabrics of ANS terranes are dominant in the shield [12]. It is suggested
that some of these shear zones that contain dismembered ophiolitic suites represent the major suture
zones between terranes [13]. However, others are strike-slip faults and belts of shearing and folding
that have modified older sutures [14,15]. Studies have shown that the later types of shear zones are
known to host numerous VMS-type polymetallic and orogenic gold deposits and occurrences [15].
     More than 60% of the territory of Eritrea is part of the southern Nubian Shield (Figure 1b). The
geological setup of the country is made up of three major stratigraphic successions: the basement
rocks constituting the Precambrian greenstone volcano-sedimentary assemblages, which are
unconformably overlain by Paleozoic and Mesozoic sedimentary and volcanic rocks, which are in
turn overlain by sedimentary and volcanic rocks of the Paleogene to Quaternary ages [7]. Based on
lithological and structural characteristics, the Eritrean Neoproterozoic basement has been divided
into five tectono-stratigraphic terranes: (1) the Barka terrane in the west, mainly composed of upper
amphibolite to granulite metasedimentary and mafic gneiss complexes; (2) the Hagar terranes in the
north are dominated by oceanic affinity supra-subduction mafic and felsic volcanic rocks; (3) the
Adobha Abiy terrane in the central and western parts is principally composed of highly deformed
ophiolites and post-accretionary basinal sediments, which are imbricated by the regional shear
zones of the Elababu shear zone (ESZ) in the east and the Baden shear zone (BSZ)in the west; (4) the
Nakfa terrane occupying more than half of the basement complex contains greenschist facies
volcano-sedimentary and syn- to post-collision granitoid rocks; and (5) the easternmost Arig terrane
is a narrow belt of high-grade gneiss and syn- to late-tectonic granitoid rocks along the Red Sea
lowlands composition [16–18].
     Regional structures including the NNW-striking brittle–ductile shear zones and strike-slip
faults, low angle thrust faults, fold structures as well as local macroscopic en-echelon quartz veins
and tension gashes with a general trend of NNE to NNW are commonly developed on the
Precambrian granitoid-greenstone belt. Among these, the ductile strike-slip shear zones are the most
prominent tectonic structures in the region and can be traced for several kilometers in length and
several meters to several tens of meters in width. The dominantly sinistral AAB and dextral ANB are
the two main transpressional strike-slip shear zones, along which the important mineral deposits
occur [5]. Semi-brittle shear zones developed synchronously along axial planes of isoclinal folds are
also common structures on the greenschist metamorphic rocks. Syn- to late-tectonic granitoid
Minerals 2019, 9, 201                                                                                        3 of 20

magmatic rocks intrude along the ductile shear zones as elliptical rigid bodies [5]. These magmatic
rocks are dominated by granite, granodiorite, and diorite, and are accompanied by fine-grained
rocks, dolerite, and quartz porphyry [7].

      Figure 1. (a) Tectonic scheme of the Koka deposit (after Johnson et al., [15]). (b) Location of the Koka
      deposit (after Zhao et al., [19]). (c) Geological map of the Koka gold deposit (after Dean et al., [20]).

3. Geology of the Koka Deposit
     The Koka gold mine is located in the Elababu shear zone (ESZ) that separates the Nakfa terrane
in the east from the Adobha Abiy terrane in the west. The ESZ is the dominant ore- and
granite-controlling structure in the area, where the ore bodies are strictly distributed in the
SN-striking ESZ. The ESZ is characterized by the occurrence of thrust nappe faults (strike to 10~20°,
tending to the southwest) and low grade metamorphic volcanic-sedimentary rocks upright folds
(dip angle of limbs is 75°~90°) along the different lithologic interfaces. The formation of the ESZ is
related to the SN-striking extrusion caused by the collision of the Neo-Proterozoic Gondwana
continent. The gold-bearing quartz veins commonly occur as reticular veins, with branching and
converging features, and have locally expanded to form lens-shaped bodies (Figure 2a). The granite
occurring in the ESZ is characterized by strong mylonitization (Figures 2b,c). Preferred orientation of
sericite defined the main foliation anastomozing around rotated K-feldspar porphyroclasts (Figure
2d).
     The ores are hosted by a relatively fine to medium grained, gray colored, elongated nearly
vertically dipping granitic body. The granitic host rock is dominated by primary minerals of
plagioclase, quartz, and subordinate K-feldspar with alteration products dominated by sericite,
micro-granular albite, and quartz. The host rock is bounded by greenschist facies metamorphic
rocks, consisting of intermediate to felsic volcanic and pyroclastic rocks and post-tectonic granitoids
in the east part of the Nakfa terrane and sequence of siliciclastic metasedimentary and metavolcanic
rocks including tuffaceous greywacke, sandy mudstone, shales and mafic metabasaltic flows, and
associated syn-tectonic granitoid rocks in the west part of the Adobha Abiy terrane (Figure 1c). The
area is dominated by the NNE shear zones, which are comprised of a series of asymmetric
overturned isocline folds and thrust faults, particularly prevailed on the fine grained volcanic and
sedimentary rocks. The high-angle thrust faults are the main controlling structures for the
ore-bearing hydrothermal activities in the mine area.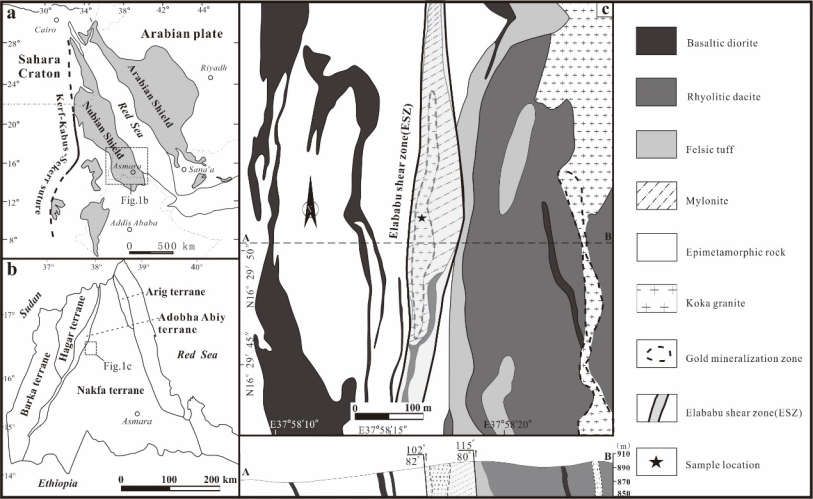
Minerals 2019, 9, 201                                                                                    4 of 20

      Figure 2. (a) Lens-shaped quartz veins occurring in the microgranite. (b) Microscopic aspects of
      foliated leucogranite. Foliation is defined by the preferred orientation of sericite. (c) Microscopic
      view of rotated K-feldspar porphyroclasts with asymmetric strain shadows. (d) Rotation of
      K-feldspar under microscope. Abbreviations: Kfs = K-feldspar; Qz = quartz; Ser = sericite.

     In the Koka gold deposit, the mineralization developed within the relatively competent
elongated NNE trending microganitic body. Post-magmatic deformations have fractured the Koka
microgranite (851.2 ± 1.9 Ma, [19]). These tectonic-induced brittle fractures served as a pathway for
the gold-bearing hydrothermal fluids and eventually became a mineralized stockworks of quartz
veins. The main mineralization zone can be classified into two categories: the quartz vein type and
wall-rock alteration type. The former is characterized by intense alteration and the main
mineralization zone occurs from 50 to 80 m from the contact of the footwall within the microgranite.
This zone is about 10 m wide and is characterized by stockworks of quartz veins with varying
widths, generally no more than two meters. The second wall-rock alteration type mineralization
mainly developed in the contact zone between the Koka microgranite and footwall
metavolcano-sedimentary rocks. As of 2010, the diamond drilling had constrained the Koka gold
orebody over a strike length of 650 m, with an average depth of more than 165 m below the surface,
and an average grade of about 5~6 g/t, proving that the gold reserves are about 26.13 tons [20].
     Gold is mainly formed in quartz veins in the form of native gold. Ore minerals are mainly
native gold, pyrite, chalcopyrite, galena, and sphalerite. Gangue minerals are mainly quartz, calcite,
and sericite. The types of alterations closely related to gold mineralization are silicification,
sericitization, pyrite mineralization, and carbonation and these are superimposed on each other in
the mining area and are generally zoning. In particular, silicification is consistent with the main
mineralization. Sericitization and pyrite mineralization are beyond the distribution of the
mineralization zone, and formed the sericite + pyrite altered halo boundary. The formation of the
carbonation often occurred in the surrounding rock mainly as a carbonated vein, accompanied by
other alterations or separately.
     Based on microscopic observations, and a paragenetic study of the primary ore mineral
assemblages, two main stages of mineralization are recognized in the Koka gold deposit: stage I is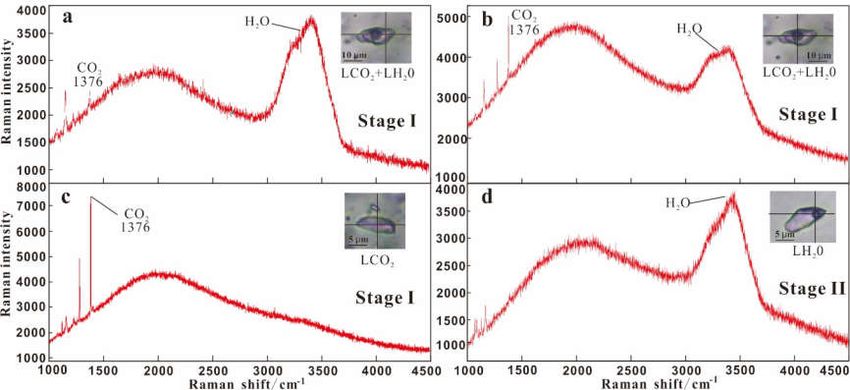
Minerals 2019, 9, 201 5 of 20
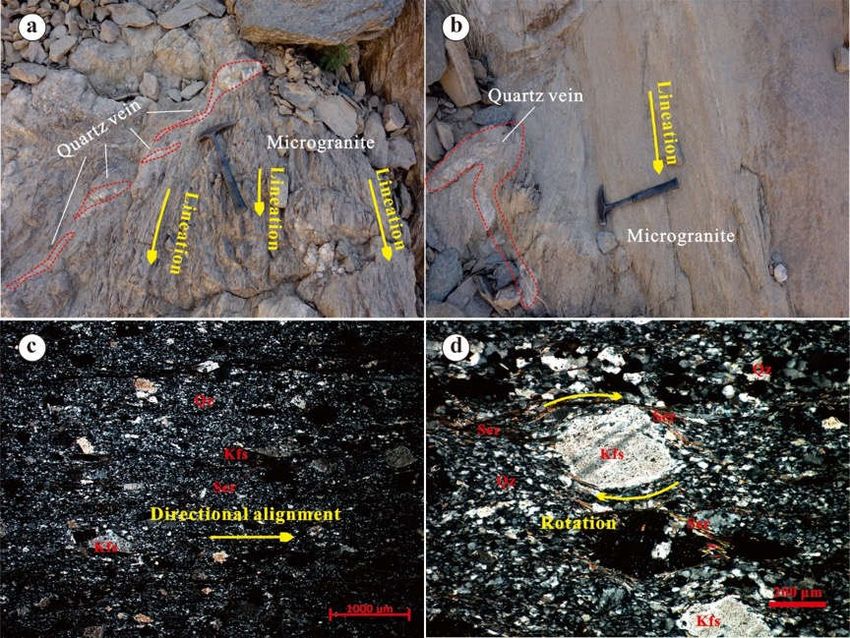
characterized by the development of quartz–sulfide–gold veins, of which sulfides are mainly pyrite,
chalcopyrite, galena, and sphalerite (Figure 3a). The shape of natural gold is xenomorphic granular
and is generally distributed between pyrite and quartz (Figures 3b,c). Pyrites mostly occur as
clusters, which are hypautomorphic-cubic crystals with large particle size changes (Figure 3d).
Galena is xenomorphic granular in shape and has a distinct triangular cleavage (Figure 3f).
Chalcopyrite and sphalerite mostly show a solid solution structure, and aggregates can also be seen,
occasionally as a single grain (Figures 3e,g). Stage II is characterized by the development of milky
white quartz veins with poor sulfide (Figure 3h). The mineral combination is relatively simple, and
only a small amount of its chalcopyrite and fine pyrite can be seen.
Figure 3. Microscopic photos of the orebodies, hand-specimens, and minerals of the Koka gold
deposit. (a) Gold-bearing quartz veins of stage I occur in granite; (b) native gold occurs in quartz
veins; (c) native gold occurs in the crack of quartz grains; (d) euhedral pyrite occurs in quartz veins;
(e) pyrite coexists with chalcopyrite and sphalerite; (f) pyrite coexists with galena; (g) chalcopyrite
coexists with galena and sphalerite; (h) quartz veins of stage II occur in granite. Abbreviations: Ccp =
chalcopyrite; Gn = galena; Py = pyrite; Sp = sphalerite.
4. Sampling and Analytical Method
Five ore-bearing quartz samples were collected from the Koka gold deposit, namely KO-15,
KO-16, KO-17, KO-3, KO-7, and KO-14. Sampling locations are shown in Figure 1c.
4.1. Fluid Inclusions (FIs)
Fluid inclusion assemblages were characterized prior to the selection of samples for
microthermometry. Microthermometry analyses were completed at the Institute of Materials and
Engineering, University of Science and Technology Beijing, by using the Linkam THMSG600
heating–freezing stage (−196 to 600 °C) (Linkam, Surrey, UK). The precision of each measurement
was ±0.1 °C during the cooling cycles and ±1 °C during the heating cycles. The heating rate was held
between 0.2 °C/min and 10 °C/min during these cycles. The temperatures of the phase transitions of
the CO2-bearing fluid inclusions and aqueous inclusions were determined at heating rates of 0.1
°C/min and 0.2 to 0.5 °C/min, respectively. The temperatures of the phase transitions were
Minerals 2019, 9, 201                                                                           6 of 20

confirmed by the cycling technique to ensure the accuracy of the microthermometric data. For
salinity determination of the CO2–H2O FIs, the equation was S=15.52022 − 1.02342t − 0.05286t2 (−9.6
≤ t ≤ 10 °C), S = salinity wt% NaCl eqv, t represents the temperature of clathrate in CO2 FIs [21]. For
NaCl-aqueous FIs, the equation was S = 0.00 + 1.78t − 0.0442t2 + 0.000557t3, 0 < S < 23.3% wt% NaCl
eqv, t represents the temperature of ice melting [22].
      The chemical composition of the vapor phases in the fluid inclusions was determined by ion
and gas chromatography and Raman spectroscopy at the Central South China of the Mineral
Resources Supervision and Testing Center, Wuhan. The Raman spectroscopy instrument was a
Renishaw inVia, UK. The spectrum ranged from 50 cm−1 to 4500 cm−1. The operating conditions
included a laser wavelength of 514.5 nm and laser power of 30 mW. The Raman shift was calibrated
using a single crystal of silicon. The cation test instrument in the liquid phase composition of the
group inclusions was a Hitachi Z-2300 (Hitachi, Tokyo, Japan), and a DIONEX ICS-3000 (Dionex,
Sunnyvale, CA, USA) was used for ion chromatography. A GC-2014C was used for gas
chromatography. The bursting temperature of the inclusions ranged from 100 to 550 °C, and the
precision was 0.01 mg/L (0.01 μg/g).

4.2. Stable Isotope Analytical Methods
     The H–O–C isotope analyses were accomplished with a MAT253 mass spectrometer (Finnigan,
San Jose, CA, USA) at the Analytical Laboratory of the Beijing Research Institute of Uranium
Geology. The accuracy of the O isotope analysis was better than ±0.2‰, and that of the H isotope
analysis was better than ±2‰, and that of the C isotope analysis was typically better than ±0.1‰. The
amount of O in quartz water (aquartz water) was calculated from the O isotope level of the analyzed
quartz by using the fractionation equation 1000lnαquartz water = (3.38 × 10⁶)T−2 − 3.40, where T is the
temperature in Kelvin [23], and the average fluid inclusion temperature of each stage was used to
calculate the δ18Owater value.

5. Fluid Inclusions

5.1. Fluid Inclusion Petrography
     Fluid inclusions (FIs) of the Koka gold deposit are found in quartz. Quartz is mainly
characterized by ductile deformation (quartz). A large number of fluid inclusions including primary,
pseudosecondary, and secondary fluid inclusions [22,24] were identified in two mineralization
stages of quartz using detailed petrographic observations. Primary and pseudosecondary inclusions
occur in the growth zone of quartz (Figure 4), or are distributed as an isolated form. The
microthermometric data in this study were basically from primary and pseudosecondary inclusions,
and inclusions with only an aqueous liquid phase are the result of necking phenomena and cannot
be used for microthermometry. In accordance with the classification principles of Roedder [24] and
Lu et al. [22], vapor-to-liquid ratios at room temperature, heating–freezing behaviors, and results of
laser Raman analysis were used to classify the fluid inclusions found in the Koka deposit into four
types:
     (1) Type I, liquid-rich aqueous fluid inclusions (LH2O + VH2O), are mainly found in stage II, and
are rarely found in stage I. Type I FIs are dominantly liquid-rich inclusions with few pure liquid
inclusions. The liquid-rich inclusions have ellipsoidal or irregular shapes with long axes of 8–16 μm
and a 75–95 vol% liquid phase. These types of FIs are mostly primary and pseudosecondary
inclusions that are distributed in isolation or along the crystal growth (Figures 4a,b).
     (2) Type II, CO2-rich fluid inclusions (LCO2 + VCO2), are mainly found in the early stage quartz
veins. Liquid-rich CO2 inclusions have ellipsoidal or irregular shapes with long axes of 6–16 μm
(Figures 4c–f) and a 40–95 vol% liquid phase. Type II FIs dominantly occurred as a liquid phase in
room temperature (25 °C), whereas few occurred as two phases. Liquid-rich CO2 inclusions will
appear as vapor in the cooling process. Type II FIs commonly coexist with Type III FIs, and few
coexist with Type I FIs (Figure 4d).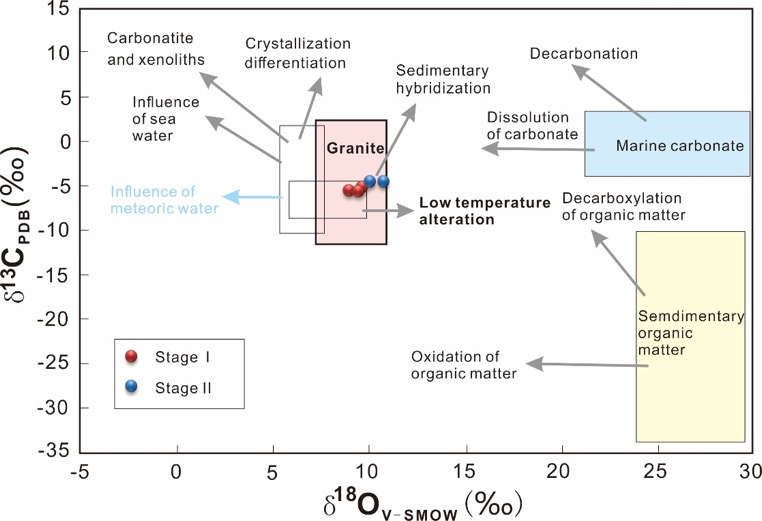
Minerals 2019, 9, 201                                                                                                7 of 20

    (3) Type III, three-phase CO2-rich fluid inclusions (VCO2 + LCO2 + LH2O) at room temperature,
occurred in both the early and late stages, have ellipsoidal or irregular shapes with long axes of 6–24
μm (Figures 4a,g,h) and a 20–85 vol% liquid phase.

      Figure 4. (a) Type I fluid inclusions (FIs) coexist with type III FIs in stage I veins; (b) Type I FIs occur
      in stage II veins; (c) Abundant Type II FIs occur in stage I veins; (d) Type I FIs coexist with type II FIs
      in stage I veins; (e) Primary FIs distributed along the crystal growth bands; (f) Type II of vapor-rich
      FI in stage I; (g) Type II of liquid-rich FI in stage I; (h) Type III FI in stage I; and (i) Type III FI in stage
      II.

5.2. Fluid Inclusion Microthermometry
      Five ore-bearing quartz samples from the Koka gold deposit were selected for ice melting and
homogenization temperatures analysis, namely KO-15, KO-16, KO-17, KO-3, KO-7, and KO-14. A
total of 135 microthermometric data of all types of fluid inclusions are listed in Table 1 and Figure 5.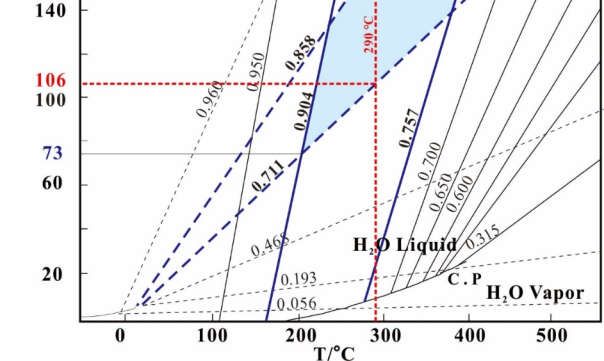
Minerals 2019, 9, 201                                                                                                                                      8 of 20

                                      Table 1. Summary of microthermometric data of the fluid inclusions from the Koka gold deposit.

Sample                                          Size                   Tm, CO2        Tm, ice      Tm, Cl      Th, CO2                     Salinity     Density
                Stage          FI type                   Number                                                              Th, (°C)
  No.                                          (μm)                     (°C)           (°C)         (°C)        (°C)                     (wt% NaCl)     (g/cm3)
                          Type I, minor        6~12          4                       –4.3~–2.4                             254~341 (V)      4.0~6.9   0.757~0.822
 KO-15                    Type II, abundant    8~16          9       –56.9~–58.0                              –2.3~17.2                               0.801~0.904
                          Type III, abundant   8~16         11       –56.7~–57.9                   5.7~7.8    19.2~30.1    280~356 (V)     4.3~7.9    0.576~0.793
                          Type I, minor        6~12          5                       –2.6~–1.9                             243~288 (V)     3.2~4.3    0.711~0.831
 KO-16         Stage I    Type II, abundant    6~12         10       –56.7~–58.2                              –4.9~18.9                               0.757~0.898
                          Type III, minor      6~20         14       –56.8~–58.1                   5.8~7.9    19.9~29.6    235~295 (V)     4.1~7.7    0.608~0.783
                          Type I, minor        6~12          6                       –3.2~–1.8                             223~275 (V)     3.1~5.3    0.783~0.858
 KO-17                    Type II, abundant    6~14         13       –56.8~–58.0                              –4.7~16.4                               0.812~0.901
                          Type III, abundant   10~24        14       –56.6~–58.0                   5.3~8.0    10.6~29.4    238~305 (V)     3.3~8.5    0.613~0.862
                          Type I, abundant     8~16          6                       –2.6~–1.5                             221~288 (V)     2.6~4.3    0.765~0.872
  KO-3
                          Type III, abundant   8~20         11       –57.0~–57.9                   6.2~8.2    19.7~29.7    228~295 (V)     3.5~7.1    0.613~0.787
                          Type I, abundant     8~12          6                       –2.8~–1.3                             212~280 (V)     2.2~4.7    0.763~0.871
  KO-7         Stage II
                          Type III, abundant   8~24         11       –56.9~–57.4                   6.6~8.5    18.5~29.7    232~318 (V)     3.0~7.5    0.597~0.793
                          Type I, minor        8~14          5                       –2.6~–0.9                             235~267 (V)     2.2~4.3    0.786~0.842
 KO-14
                          Type III, abundant   10~22        10       –56.7~–57.3                   5.6~8.0    18.2~25.7    259~309 (V)     3.9~8.0    0.672~0.701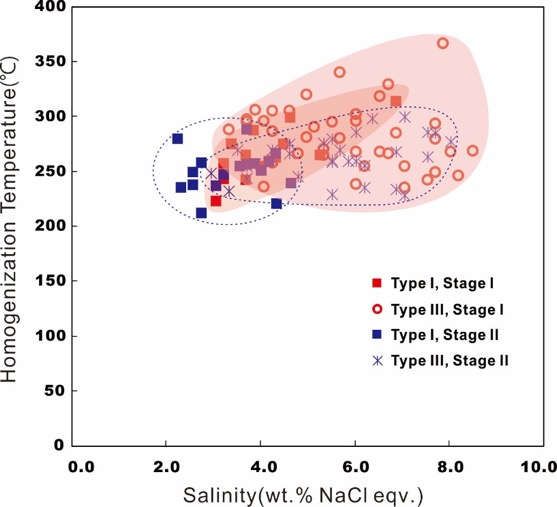
Minerals 2019, 9, 201                                                                              9 of 20

(1) Stage I
     The fluid inclusions in stage I included types I, II, and III. Type I FIs homogenized to the liquid
phase at temperatures ranging from 254 °C to 341 °C, predominantly at 260–280 °C. Their ice melting
temperatures ranged from –4.3 °C to –1.8 °C, corresponding to salinities of 3.1–6.9 wt% NaCl eqv,
with most around 3–4 wt% NaCl eqv. Type II fluid inclusions showed that the CO2 phase melting
temperatures ranged from –56.7 °C to –58.2 °C, with a peak at –57 °C, and the homogenization
temperatures to the liquid phase were –4.9 °C to 18.9 °C. Type III (CO2-rich) inclusions formed solid
CO2 upon cooling. The solid CO2 melted at temperatures between –56.6 °C and –58.1 °C, lower than
the triple point temperature of pure CO2 (–56.6 °C). The CO2-clathrate melting temperatures varied
from 5.3 °C to 8.0 °C, corresponding to salinities of 3.3–8.5 wt% NaCl eqv, with most around 6–7
wt% NaCl eqv. Vapor- and liquid-CO2 homogenized to the vapor phase at temperatures between
10.6 °C and 30.1 °C, higher than the type II FIs in stage I (Figure 6). The total homogenization
temperatures of type III inclusions ranged from 235 °C to 356 °C, with most around 280–300 °C.

      Figure 5. (A,C) Homogenization temperature of different stages of the Koka gold deposit; (B,D)
      Salinity of different stages of the Koka gold deposit.

(2) Stage II
      The fluid inclusions in stage II included types I, III, and rare type II, and the inclusions of type
III are commonly vapor-rich (V/(V + L) > 40%). The FIs of type I are dominantly liquid-rich, and
homogenized to the liquid phase at temperatures varying from 212 °C to 288 °C, predominantly at
260–280 °C. Their ice melting temperatures ranged from −2.8 °C to −0.9 °C, corresponding to
salinities of 2.2–4.7 wt% NaCl eqv, with most around 3–4 wt% NaCl eqv. Type II fluid inclusions
showed the CO2 phase melting temperatures ranged from −56.9 °C to −57.9 °C, and the
homogenization temperatures to the liquid phase of 6.8 °C to 17.3 °C. The solid CO2 of type III
inclusions melted at temperatures between −56.9 °C and –57.9 °C, and the CO2-clathrate melting
temperatures varied from 6.2 °C to 8.5 °C, corresponding to salinities of 3.0–8.0 wt% NaCl eqv, with
most around 5–7 wt% NaCl eqv. Vapor- and liquid-CO2 homogenized to the liquid phase at
temperatures between 18.5 °C and 29.7 °C, and the total homogenization temperatures of type III
inclusions ranged from 232 °C to 318 °C, with most around 260–280 °C.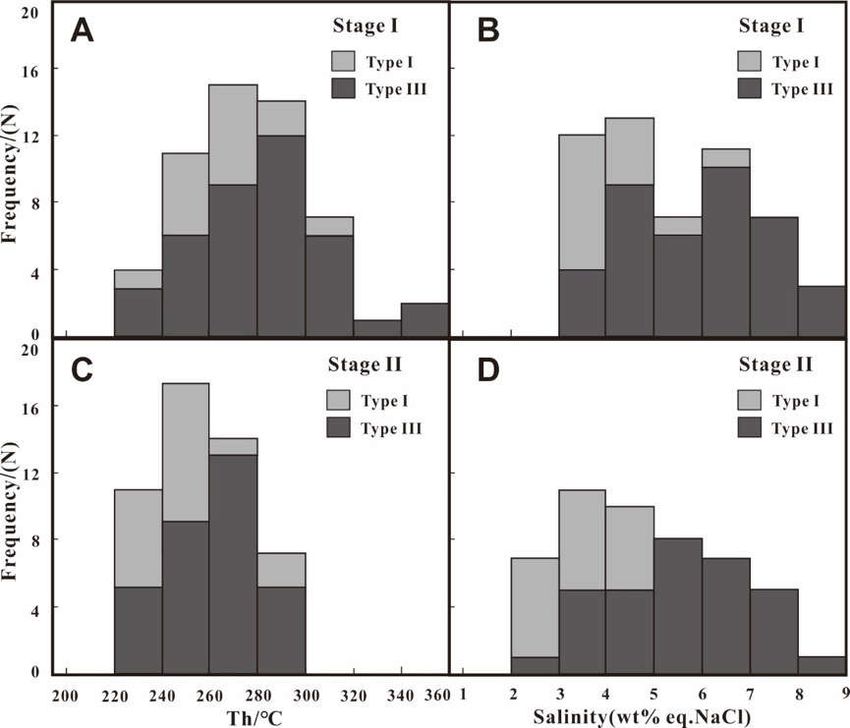
Minerals 2019, 9, 201                                                                                        10 of 20

      Figure 6. Homogenization temperature of the vapor phase CO2 in different stages of the Koka gold
      deposit.

5.3. Laser Raman Spectroscopy
      Selected samples based on the fluid inclusion petrology of the two stages were examined by
laser Raman micro spectroscopy. The results showed that the composition of FIs in type I was
relatively simple, dominated by H2O (Figure 7d). The composition of type II FIs was basically pure
CO2 (Figure 7c). The inclusion gas of type III was dominated by CO2 and H2O, and the aqueous
phase also contained some CO2 (Figures 7a,b).

      Figure 7. Raman spectra of the fluid inclusion of the Koka gold deposit. (a,b) Type III FI of stage I; (c)
      Type II FI of stage I; (d) Type I FI of stage II.
Minerals 2019, 9, 201 11 of 20
5.4. Ion and Gas Chromatography
The results of the composition of the fluid inclusions cluster in quartz based on ion and gas
chromatography showed that CO2 and H2O were the dominant gaseous ingredients, and CH4 was
rare (Table 2). The average mole% of H2O and CO2 of stage I were 0.535 and 0.465, respectively,
whereas the average mole% of H2O increased to 0.753, and the average mole% of and CO2 reduced to
0.245 in stage II. Only 0.11 mole% of CH4 was detected in sample KO-16 of stage I. The mole% of CO
and H2 of all of the samples were below the detection limit.
The results of the ion chromatography showed that Na+ was the dominant cation in both stages,
with minor K+ and Ca+, and the ratio of Na+/K+ ranged from 20.13 to 26.33, and 12.75 to 17.15,
respectively. The anion of the two stages was mainly Cl− with minor SO42−, and the ratio of Cl−/SO42−
ranged from 11.52 to 17.42, and 19.24 to 31.26, respectively. Moreover, the average content of Na+
and Cl− in stage I was 5.40 mg/L and 6.96 mg/L, respectively. Compared with stage I, the average
contents of Na+ and Cl− in stage II were 9.64 mg/L and 12.63 mg/L, respectively, higher than those in
stage I. Li+, F−, and Br− of all samples are below the detection limit.
Table 2. Results of the ion and gas chromatography of the fluid inclusions from the Koka gold
deposit.
H2O CO2 CO CH4 K+ Na+ Ca2+ Mg2+ Cl− SO42−
Sample No. Stage
mol% mol% mol% mol% mg/L mg/L mg/L mg/L mg/L mg/L
KO-15 0.595 0.405Minerals 2019, 9, 201 12 of 20
Figure 8. Calculated δ13C and δ18O values of fluids at Koka (after Chen et al., 2012 [25]).
The oxygen and hydrogen isotopic data are listed in Table 3 and plotted in Figure 9. The
measured δ18O values of five quartz samples in the two stages ranged from +8.0 to +8.8‰. The δ18O
values of hydrothermal fluids were calculated using the equation of Clayton et al. [21],
1000lnaquartz–water = 3.38 × 10⁶ × T−2 − 3.40, together with the measured δ18Oquartz values and the
corresponding average homogenization temperatures of the FIs in the same stage of the same
sample (Table 3). As a result, the δ18OH2O values from the early stage and the late stage were +1.7‰ to
+2.4‰, and 2.0‰ to +2.7‰, respectively. All samples selected for δ18O analysis were also analyzed
for their hydrogen isotopic composition. The δDH2O values of the quartz samples in the early stage
and the late stage were −57.0‰ to −50.1‰, and −54.1‰ to −53.1‰, respectively.
Figure 9. The δ18O and δD values of the ore fluids at the Koka deposit. The metamorphic water field,
primary magmatic water field, and meteoric water line are from Taylor (1974) [26].
The sulfur isotopic data are shown in Table 4 and plotted in Figure 10. The δ34S values of ten
pyrite samples from the Koka gold deposit ranged from −0.1‰ to +2.7‰, with an average of +1.6‰,
and the δ34S value of the samples of one chalcopyrite, one galena, and one sphalerite were +1.3‰,
−1.3‰, and +1.2‰, respectively. Therefore, the sulfur isotopic compositions in the Koka goldMinerals 2019, 9, 201 13 of 20
deposit showed a relatively narrow range (−1.3 to +2.7‰, around zero), indicating a homogenous
sulfur source.
Table 4. Sulfur isotopic compositions of sulfides from the Koka gold deposit.
δ34SCDT
Sample No. Stage Mineral
(‰)
KO-11 Pyrite 1.7
KO-11 Pyrite −0.1
KO-15 Pyrite 1.3
KO-16 Pyrite 1.4
KO-17 Stage I Pyrite 1.6
KO-17 Pyrite 1.6
KO-17 Chalcopyrite 1.3
KO-17 Galena –1.3
KO-17 Sphalerite 1.2
KO-3 Pyrite 1.9
KO-3 Pyrite 1.9
Stage II
KO-7 Pyrite 2.7
KO-14 Pyrite 1.8
Figure 10. Histograms of the δ34S values of sulfide for the Koka deposit.
7. Discussion
7.1. Nature and Evolution of Ore-Forming Fluid
CO2-bearing FIs were the most abundant occurrence in the Koka gold deposit, with moderate
liquid-rich aqueous FIs. Generally, the results of fluid inclusion petrography, microthermometry,
and laser Raman micro-spectroscopy showed that the ore-forming fluid of the Koka gold deposit
was a medium- to low-temperature and low-salinity CO2–NaCl–H2O system.
(1) Stage I
The ore-forming fluid of this stage was a medium-temperature, low-salinity
NaCl–H2O–CO2(–CH4) fluid (CH4 was detected via gas chromatography). The majority of CO2 and
CH4 are likely to be from the metamorphic strata [10,27–29]. Fluid immiscibility is one of the
dominant ore-forming mechanisms in gold deposits [30–32]. The common coexistence of type I andMinerals 2019, 9, 201 14 of 20
II FIs during stage I suggests that they were entrapped simultaneously, and homogenized in
different ways, which suggests that fluid immiscibility occurred prior to their entrapment [33]. The
plot of salinity vs. the homogenization temperatures (Figure 11) indicates that the ore-forming fluid
underwent a fluid immiscibility process during stage I at Xiangdong (three-phase CO2-rich
inclusions commonly coexist with two-phase aqueous inclusions in quartz, with similar
homogenization temperatures [24]), which is likely to be due to the decrease in temperature and
pressure as the ore-forming fluid ascended, leading to the escape of CO2 from the fluid.
Figure 11. Plot of salinity vs. homogeneous temperature for fluid inclusions of different stages from
the Koka deposit.
Moreover, varying degrees of CH4 involvement in the fluid system were detected in the stage I
FIs, and CH4 may lead to fluid immiscibility of the NaCl–H2O–CO2 system at depth [34].
We calculated the densities of the type I (salinityMinerals 2019, 9, 201 15 of 20
Figure 12. Pressure estimations for the primary fluid inclusions of the Koka deposit (after Roedder
and Bodnar [36]).
Figure 13. Pressure estimations for the primary fluid inclusions of the Koka deposit (after Van den
Kerhof and Thiéry 2001 [39]).Minerals 2019, 9, 201 16 of 20
(1) Stage II
The occurrence and composition of different FIs types suggest that the ore-forming fluid from
stage II is a medium-temperature, low-salinity NaCl–H2O–CO2 fluid. The temperature of the
ore-forming fluid decreased from stage I to II, most likely due to the progressive cooling of the fluid
system or/and mixing with relatively low-T fluid, whereas the meteoric water mixing is supported
by the results of the hydrogen and oxygen isotopes. In addition, the water content increased in the
fluid of stage II, suggesting a water mixing. Salinity from stage I to II changed slightly, most likely
due to the precipitation of metal elements in stage II.
7.2. Source of Ore-Forming Fluids and Metal
Most of the δDfluid values (–57.0 to –50.1‰) and the δ18OH2O values (+1.7 to +2.7‰) of the ore
quartz in the Koka gold deposit fell within the ranges of the isotopic compositions of metamorphic
water [26,40], and near the primitive magmatic water field (Figure 9). The H–O data suggest that
these ore-forming fluids were derived from metamorphic water, and that magmatic water could mix
within the ore-forming fluids.
The δ13C values of the quartz samples ranged from −5.5 to−4.4‰, which were higher than those
of the organic matter (averaging −25‰ [41]), CO2 dissolved in water (−9 to −20‰ [42]), atmospheric
CO2 (~−8‰ [43] or −7 to −11‰ [42]), and crust (−7‰ [44]), and lower than the marine carbonates
(~0‰ [41]), but consistent with the C isotopic compositions of igneous/magma systems (−3 to −30‰
[42]; mantle (−5 to −7‰ [41]). In the δ13C vs. δ18O diagram, all of the quartz samples were plotted
within the granite box field (Figure 8), indicating that carbon in the early ore-forming fluids was
likely to be provided by magmatic water. Moreover, the late stage quartz samples showed an
obvious trend of influence by low temperature alteration, which suggests a temperature cooling in
the late ore-forming system. This interpretation is consistent with the results of the fluid inclusion
microthermometry.
The δ34S values of sulfides in the Koka gold deposit exhibited a narrow range of values that
were close to 0‰ (−1.3 to +2.7‰, Figure 10), which suggests that the sulfides that precipitated from
the fluid system originated from a single sulfur source that was primarily comprised of deep-seated
magma (δ34S = 0 ± 3‰ [45,46]). Moreover, the δ34S values exhibited a trend of δ34Spyrite > δ34Ssphalerite >
δ34Sgalena, which is consistent with the crystallization sequence of minerals in a hydrothermal system
under the conditions of sulfur isotopic fractionation equilibrium [45,47]. These data suggest that the
hydrothermal system reached a state of sulfur isotopic fractionation equilibrium before its ore
minerals were precipitated [48–50], suggesting that these ore-forming materials were predominantly
sourced from magma. Then we calculated the galena-sphalerite pair and obtained a temperature of
265±19 °C according to Ohmoto and Rye 1979 [45], which is in agreement with the temperatures
obtained from oxygen isotopes.
7.3. Genetic Model for Ore Deposition
The continental collision of East and West Gondwana caused the reconstruction of the regional
juvenile crust and lithosphere, and the formation of Eeat African Ogogenic Belt (EAOB) during the
Neoproterozoic (~650 Ma). Most of the juvenile crust were conjoined along the arc–arc suture, and
the subsequent orogeny lasted nearly 100 Ma [15]. Due to the rapid convergence between East
Gondwana and West Gondwana, the Eritrea region in the southern part of the EAOB experienced
regional metamorphism [51].
40Ar–39Ar ages of sericite in the gold-bearing quartz veins of the Koka deposit were 600–580 Ma
(unpub. data), suggesting that the Koka deposit most likely formed in the Neoproterozoic.
Moreover, several gold deposits in the Nubian Shield were reported to have formed at this period
such as Sukhaybarat [52], An Najadi [53], Ad Duwayhi [54], and Lega-Dembi [55]. Regionally, Post
orogenic a-type granite was formed after 610 Ma [15], combined with the formation age of Kyanite
schist (U–Pb age of monazite, 593 ± 5Ma [56]), suggesting that the time interval of 600–580 Ma was inMinerals 2019, 9, 201 17 of 20
the transition environment from crust compression to extension during the collision, accompanied
by regional metamorphism.
The characteristics of geotectonic environment, occurrence of orebodies, mineral assemblages,
and ore-forming fluid of the Koka gold deposit were similar to the features of orogenic gold deposits
[11,30,57], whereas the carbon and sulfur isotopes suggested an igneous origin. Hence, the Koka
gold deposit could be an orogenic gold deposit related to magmatism. The detailed ore-forming
process is described as follows:
After the solidification of Koka granite, multi-fractures that existed in the granite became a
relatively low-pressure zone in the district. Ore-bearing fluid, which was derived from the
metamorphic strata and containing abundant CO2 in high-pressure conditions, was driven by
regional thermodynamic processes to flow into the fault system of Koka granite. The temperature
and pressure decreased as the ore-forming fluid rose during stage I, which led to CO2 separating
from the fluid accompanied by fluid immiscibility, leading to the dissolution of the Au-bearing
complexes and a pH change in the residual fluid. Then, ore-forming ions such as Au+, Fe2+, Cu2+, Pb2+,
Zn2+, and S2− were precipitated at locations with advantageous structural conditions. During stage II,
meteoric water was mixed in and cooled the fluid system, so that metal cations such as Fe2+ and S2−
remaining in the fluid were deposited in the structural fractures and micro-fractures of the existing
veins.
8. Conclusions
(1) The ore-forming fluid of the Koka gold deposit is a medium- to low-temperature and
low-salinity CO2–NaCl–H2O system, and ore-forming mechanisms include fluid immiscibility
during an early stage and fluid mixing with meteoric water in subsequent stages at lower
temperature. We used two methods to estimate a similar pressure at ~168 MPa, which corresponded
to a depth of 6.3 km.
(2) The C–H–O isotopic compositions indicated that the ore-forming fluids of the Koka deposit
could have originated from metamorphic strata and were likely to have made a considerable
magmatic contribution. The S isotopic result suggest that the metals were derived from magma.
(3) Features of geology and ore-forming fluid at the Koka gold deposit were similar to those of
orogenic gold deposits. Hence, the Koka deposit might be an orogenic gold deposit related to
granite.
Author Contributions: K.Z., H.Y, J.W., and Y.-Q.X. conceived and designed the experiments; G.F.G., and W.X.
performed the experiments; all authors wrote the paper.
Funding: This research was funded by (China Geological Survey, Mineral resources assessment of Egypt and
adjacent areas) grant number (DD20160109), (the National Natural Science Foundation of China Project) grant
number (41803044) and (the Construction Project of National Technical Standard System of Mineral Resources
and Reserves) grant number (CB2017-4-10; 2017TP1029).
Acknowledgments: This work was supported by the China Geological Survey, Mineral resources assessment of
Egypt and adjacent areas (DD20160109), Evaluation of large copper and gold resource bases in North Africa
Project, and the National Natural Science Foundation of China Project (grant number 41803044).
Conflicts of Interest: The authors declare no conflict of interest.
References
1. Kröner, A.; Eyal, M.; Eyal, Y. Early Pan-African evolution of the basement around Elat, Israel and the Sinai
Peninsula revealed by single-zircon evaporation dating and implication for crustal accretion rates. Geology
1990, 18, 545–548.
2. Stern, R.J. Neoproterozoic (900–550 ma) arc assembly and continental collision in the east Africa orogen:
Implications for the consolidation of Gondwanaland. Annu. Rev. Earth & Planet. Sci. 1994, 22, 319–351.
3. Stern, R.J. Neoproterozoic crustal growth: The solid Earth system during a critical episode of Earth history.
Gondwana Res. 2008, 14, 33–50.Minerals 2019, 9, 201 18 of 20
4. Johnson, P.R.; Zoheir, B.A.; Ghebreab, W.; Stern, R.J.; Barrie, C.T.; Hamer, R.D. Gold-bearing volcanogenic
massive sulfides and orogenic-gold deposits in the Nubian Shield. S. Afr. J. Geol. 2017, 120, 63–76.
5. Ghebreab, W.; Greiling, R.O.; Solomon, S. Structural setting of Neoproterozoic mineralization, Asmara
district, Eritrea. J. Afr. Earth Sci. 2009, 55, 219–235.
6. Barrie, C.T.; Nielsen, F.W.; Aussant, C.H. The Bisha volcanic-associated massive sulfide deposit, western
Nakfa terrane, Eritrea. Econ. Geol. 2007, 102, 717–738.
7. Zhao, X.Z.; Duan, H.C.; Wang, F.X. General characteristics of geology and mineral resources in Eritrea and
exploration progress. Miner. Explor. 2012, 5, 707–714. (In Chinese)
8. Xiang, P.; Wang, J.X. Ore geology character and type of Koka gold deposit, Eritrea. Acta Mineral. Sin. 2013,
s2, 1067–1068. (In Chinese)
9. Goldfarb, R.J.; Groves, D.I.; GardollS. Orogenic gold and geologic time: A global synthesis. Ore Geol. Rev.
2001, 18, 12–75.
10. Groves, D.I.; Goldfarb, R.J.; Robert, F. Gold deposits in metamorphic belts: Overview of current
understanding, outstanding problems, future research, and exploration significance. Econ. Geol. 2003, 98,
1–29.
11. Goldfarb, R.J.; Groves, D.I. Orogenic gold: Common or evolving fluid and metal sources through time.
Lithos. 2015, 233, 2–26.
12. Abdelsalam, M.; Stern, R. Sutures and shear zones in the Arabian-Nubian Shield. J. Afr. Earth Sci. 1996, 23,
289–310.
13. Stern, R.J.; Johnson, P.R.; Kröner, A.; Yibas, B. Neoproterozoic ophiolites of the Arabian-Nubian shield.
Dev. Precambrian Geol. 2004, 13, 95–128.
14. Johnson, P.R.; Woldehaimanot, B. Development of the Arabian–Nubian Shield: Perspectives on Accretion and
Deformation in the Northern East African Orogen and the Assembly of Gondwana; Special Publication: London,
UK, 2003; pp. 290–325.
15. Johnson, P.R.; Andresen, A.; Collins, A.S.; Fowler, A.R.; Fritz, H.; Ghebreab, W.; Kusky, T.; Stern, R.J. Late
Cryogenian–Ediacaran history of the Arabian–Nubian shield: A review of depositional, plutonic,
structural, and tectonic events in the closing stages of the northern East African Orogen. J. Afr. Earth Sci.
2011, 61, 167–232.
16. Drury, S.A.; Berhe, S.M. Accretion tectonics in Northern Eritrea revealed by remotely sensed imagery.
Geol. Mag. 1993, 130, 177–190.
17. Teklay, M. Petrology, Geochemistry and Geochronology of Neoproterozoic Magmatic Arc Rocks from Eritrea:
Implications for Crustal Evolution in the Southern Nubian Shield; Department of Mines-Ministry of Energy
Mines and Water Resources-State of Eritrea: Asmara, Eritrea, 1997; Volume 1, pp. 1–125.
18. Drury, S.A.; De Souza Filho, C.R. Neoproterozoic terrane assemblages in Eritrea: Review and prospects. J.
Afr. Earth Sci. 1998, 27, 331–348.
19. Zhao, K.; Yao, H.Z.; Wang, J.X.; Ghebsha, F.G.; Xiang, W.S.; Yang, Z. Zircon U-Pb geochronology and
geochemistry of Koka granite and its geological significances, Eritrea. Earth Sci. in press. (In Chinese)
20. Dean, C.; David, L.; David, G. Technical Report on the Koka Gold Deposit, Eritea; Chalice Gold Mine Limited:
Asmara, Eritrea, 2010; pp. 1–111.
21. Bozzo, A.T.; Chen, H.S.; Kass, J.R.; Barduhn, A.J. The properties of the hydrates of chlorine and carbon
dioxide. Desalination 1975, 16, 303–320.
22. Lu, H.Z.; Fan, H.R.; Ni, P.; Ou, G.X.; Shen, K.; Zhang, W.H. Fluid Inclusions; Science Press: Beijing, China,
2004; pp. 406–419. (In Chinese)
23. Clayton, J.; Tretiak, D.N. Amine-citrate buffers for pH control in starch gel electrophoresis. J. Fish. Board
Can. 1972, 29, 1169–1172.
24. Roedder, E. Fluid Inclusions. Review in Mineralogy; Mineralogical Society of America: Chantilly, VA, USA,
1984; pp. 1–644.
25. Chen, H.Y.; Chen, Y.J.; Baker, M.J. Evolution of ore-forming fluids in the Sawayaerdun gold deposit in the
Southwestern Chinese Tianshan metallogenic belt. J. Asian Earth Sci. 2012, 49, 131–144.
26. Taylor, H.P. The application of oxygen and hydrogen isotope studies to problems of hydrothermal
alteration and ore deposition. Econ. Geol. 1974, 69, 843–883.
27. Yang, L.Q.; Deng, J.; Guo, L.N.; Wang, Z.L.; Li, X.Z.; Li, J.L. Origin and evolution of ore fluid, and
gold-deposition processes at the giant Taishang gold deposit, Jiaodong Peninsula, eastern China. Ore Geol.
Rev. 2016, 72, 585–602.Minerals 2019, 9, 201 19 of 20
28. Yang, L.Q.; Guo, L.N.; Wang, Z.L.; Zhao, R.X.; Song, M.C.; Zheng, X.L. Timing and mechanism of gold
mineralization at the Wang’ershan gold deposit, Jiaodong Peninsula, eastern China. Ore Geol. Rev. 2017, 88,
491–510.
29. Qiu, K.F.; Taylor, R.D.; Song, Y.H.; Yu, H.C.; Song, K.R.; Li, N. Geologic and geochemical insights into the
formation of the Taiyangshan porphyry copper–molybdenum deposit, Western Qinling Orogenic Belt,
China. Gondwana Res. 2016, 35, 40–58.
30. Yang, L.Q.; Deng, J.; Wang, Z.L.; Guo, L.N.; Li, R.H.; Groves, D.I.; Danyushevsky, L.V.; Zhang, C.; Zheng,
X.L.; Zhao, H. Relationships between gold and pyrite at the Xincheng gold deposit, Jiaodong Peninsula,
China: Implications for gold source and deposition in a brittle epizonal environment. Econ. Geol. 2016, 111,
105–126.
31. Yang, L.Q.; Deng, J.; Li, R.P.; Guo, L.N.; Wang, Z.L.; Chen, B.H.; Wang, X.D. World-class Xincheng gold
deposit: An example from the giant Jiaodong gold province. Geosci. Front. 2016, 7, 419–430.
32. Groves, D.I.; Goldfarb, R.J.; Gebre-Mariam, M.; Hagemann, S.G.; Robert, F. Orogenic gold deposits: A
proposed classification in the context of their crustal distribution and relationship to other gold deposit
types. Ore Geol. Rev. 1998, 13, 7–27.
33. Shepherd, T.J.; Rankin, A.H.; Alderton, D.H.M. A Practical Guide to Fluid Inclusion Studies; Chapman &
Hall: Abingdon, UK, 1985; pp. 1–239.
34. Naden, J.; Shepherd, T.J. Role of methane and carbon dioxide in gold deposition. Nature 1989, 342,
793–795.
35. Brown, P.E. FLINCOR: A microcomputer program for the reduction and investigation of fluid-inclusion
data. Am. Mineral. 1989, 74, 1390–1393.
36. Roedder, E.; Bodnar, R.J. Geologic pressure determinations from fluid inclusion studies. Annu. Rev. Earth
Planet. Sci. 1980, 8, 263–301.
37. Xiong, Y.Q.; Shao, Y.J.; Zhou, H.D.; Wu, Q.H.; Liu, J.P.; Wei, H.T.; Zhao, R.C.; Cao, J.Y. Ore-forming
mechanism of quartz-vein-type W-Sn deposits of the Xitian district in SE China: Implications from the
trace element analysis of wolframite and investigation of fluid inclusions. Ore Geol. Rev. 2017, 83, 152–173.
38. Xiong, S.; He, M.; Yao, S.; Cui, Y.; Shi, G.; Ding, Z.; Hu, X. Fluid evolution of the Chalukou giant Mo
deposit in the northern Great Xing’an Range, NE China. Geol. J. 2015, 50, 720–738.
39. Van den Kerkhof, A.; Thiéry, R. Carbonic inclusions. Lithos 2001, 55, 49–68.
40. Qiu, K.F.; Marsh, E.; Yu, H.C.; Pfaff, K.; Gulbransen, C.; Gou, Z.Y.; Li, N. Fluid and metal sources of the
Wenquan porphyry molybdenum deposit, Western Qinling, NW China. Ore Geol. Rev. 2017, 86, 459–473.
41. Hoefs, J. Stable Isotope Geochemistry, 6th ed.; Springer: Berlin/Heidelberg, Germany, 2009; pp. 130–135.
42. Hoefs, J. Stable Isotope Geochemistry, 3rd ed.; Springer: Berlin/Heidelberg, Germany, 1997; pp. 1–201.
43. Schidowski, M.; Hayes, J.M.; Kaplan, I.R. Isotopic inferences of ancient biochemistry: Carbon, sulfur,
hydrogen and nitrogen. In Earth’s Earliest Biosphere; Schopf, J.W., Ed.; Princeton University Press:
Princeton, NJ, USA, 1983, pp. 149–186.
44. Faure, G. Principles of Isotope Geology, 2nd ed.; Wiley: New York, NY, USA, 1977; pp. 589.
45. Ohmoto, H.; Rye, R.O. Isotopes of sulfur and carbon. In Geochemistry of Hydrothermal Ore Deposits, 2nd ed.;
Barnes, H.L., Ed.; John Wiley and Sons: New York, NY, USA, 1979; pp. 509–567.
46. Chaussidon, M.; Lorand, J.P. Sulphur isotope composition of orogenic spinel lherzolite massifs from
Ariege (North-Eastern Pyrenees, France): An ion microprobe study. Geochim. Cosmochim. Acta. 1990, 54,
2835–2846.
47. Xiong, Y.Q.; Shao, Y.J.; Mao, J.W.; Wu, S.C.; Zhou, H.D.; Zheng, M.H. The polymetallic
magmatic-hydrothermal Xiangdong and Dalong systems in the W–Sn–Cu–Pb–Zn–Ag Dengfuxian
orefield, SE China: Constraints from geology, fluid inclusions, H–O–S–Pb isotopes, and sphalerite Rb–Sr
geochronology. Miner. Depos. 2019, doi:10.1007/s00126-019-00863-x.
48. Zheng, Y.F.; Xu, B.L.; Zhou, G.T. Geochemical studies of stable isotopes in minerals. Earth Sci. Front. 2000,
7, 299−320. (In Chinese)
49. Deng, J.; Liu, X.F.; Wang, Q.F.; Pan, R.G. Origin of the Jiaodong-type Xinli gold deposit, Jiaodong
peninsula, China: Constraints from fluid inclusion and C–D–O–S–Sr isotope compositions. Ore Geol. Rev.
2015, 65, 674–686.
50. Yang, L.Q., Deng, J.; Li, N.; Zhang, C.; Yu, J.Y. Isotopic characteristics of gold deposits in the Yangshan
Gold Belt, West Qinling, central China: Implications for fluid and metal sources and ore genesis. J.
Geochem. Explor. 2016, 168, 103–118.Minerals 2019, 9, 201 20 of 20
51. Ghebreab, W. Tectono-metamorphic history of Neoproterozoic rocks in eastern Eritrea. Precambrian Res.
1999, 98, 83–105.
52. Albino, G.V.; Jalal, S.; Christensen, K. Neoproterozoic mesothermal gold mineralization at Sukhaybarat
East mine. Trans. Inst. Min. Metall. (Sect. B Appl. Earth Sci.) 1995, 104, 157–170.
53. Walker, B.M.; Lewis, R.S.; Al Otaibi, R.; Ben Talib, M.; Christian, R.; Gabriel, B.R. An Najadi Gold Prospect,
Kingdom of Saudi Arabia; Geology and Gold-Resource Assessment; Saudi Arabian Deputy Ministry for Mineral
Resources Technical Report, USGS-TR-94-5; Reston Publishing Service Center: Reston, VA, USA, 1994; pp.
1–89.
54. Doebrich, J.L.; Zahony, S.G.; Leavitt, J.D.; Portacio, J.S., Jr.; Siddiqui, A.A.; Wooden, J.L.; Fleck, R.J.; Stein,
H.J. Ad Duwayhi, Saudi Arabia: Geology and geochronology of a Neoproterozoic intrusion-related gold
system in the Arabian shield. Econ. Geol. 2004, 99, 713–741.
55. Billay, A.Y.; Kisters, A.F.M.; Meyer, F.M.; Schneider, J. The geology of the Lega Dembi gold deposit,
southern Ethiopia: Implications for Pan-African gold exploration. Miner. Depos. 1997, 32, 491–504.
56. Andersson, U.B.; Ghebreab, W.; Teklay, M. Crustal evolution and metamorphism in east-central Eritrea,
south-east Arabian-Nubian Shield. J. Afr. Earth Sci. 2006, 44, 45–65.
57. Chen, Y.J.; Ni, P.; Fan, H.R.; Prajno, F.; Nai, Y.; Su, W.C.; Zhang, H. Diagnostic fluid inclusions of different
types hydrothermal gold deposits. Acta Petrol. Sin. 2007, 23, 2085–2108. (In Chinese)
© 2019 by the authors. Licensee MDPI, Basel, Switzerland. This article is an open
access article distributed under the terms and conditions of the Creative Commons
Attribution (CC BY) license (http://creativecommons.org/licenses/by/4.0/).You can also read