The Independent Higher Education Survey 2019 - INDEPENDENT HIGHER EDUCATION - Supported by
←
→
Page content transcription
If your browser does not render page correctly, please read the page content below

INDEPENDENT
      HIGHER
      EDUCATION

The Independent
Higher Education
Survey 2019

                    Supported by:

Contents

About the Authors                                                                          4
Foreword                                                                                   5
Introduction                                                                               6
Survey demographic                                                                         7
     What do they teach?                                                                   9
     Models of teaching                                                                  10
     Institutional missions                                                              11
Regulation and Oversight                                                                 12
     Student Funding from Scotland, Wales and Northern Ireland                           14
     Teaching Excellence and Student Outcomes Framework (TEF)                            15
Students                                                                                 16
Corporate Governance and size                                                            17
Staff at independent higher education providers                                          19
Office for Students Registration                                                         20
     Funding from the Office for Students                                                22
     Experience of the Office for Students                                               23
Policy questions                                                                         24
     Transnational Education                                                             24
     Higher technical education                                                          25
     Policy to impact future student funding                                             26
     Student Mental Health and Well-being                                                27
     Brexit                                                                              27
Membership and engagement with sector bodies                                             28
The Future                                                                               30
     Growth and decline in staff and student numbers                                     30
     Degree Awarding Powers                                                              31
     Plans for the next two years                                                        32
     Priorities for the future                                                           34
     Support with priorities                                                             36
Conclusion                                                                               37

                                                   The Independent Higher Education Survey 2019   3
About the Authors

                                                   INDEPENDENT
                                                   HIGHER
                                                   EDUCATION

                  The Independent Higher Education Survey 2019

           Independent HE is the UK membership organisation and national representative body
             for independent providers of higher education, professional training and pathways.

             Independent HE works to promote, support and enhance the independent tertiary
               education sector. We lobby for positive reforms to the regulatory and operating
            environment, work to share good practice and raise standards in the sector and help
                        members to overcome challenges to succeed in the market.

               Membership is open to independent providers of higher education, professional
            training or pathways who demonstrate a commitment to high educational standards,
           transparency, ethical marketing practices and protecting the interests of their students.

            Shakespeare Martineau is a leading law firm, ranked 52 in the top 100 that combines
              creativity, commerciality and clarity. We work with blue-chip companies, leading
                    organisations, high street brands and individuals across the country.
             Our multi-disciplinary team delivers a broad range of specialist legal services, and
              particularly stands out for its expertise within Education, including Independent
           Providers, Higher Education, Further Education, Academies and Independent Schools.
              We pride ourselves on protecting and growing businesses and personal wealth.
             Our approach goes beyond just legal solutions: clients trust us to advise on what's
                        possible, what's prudent and what's coming around the corner.

4   The Independent Higher Education Survey 2019
Foreword

The Independent Higher Education Survey has become a
regular and essential contribution to the rich and varied
data landscape within the UK’s tertiary education sector.
Offering valuable insights into a group of providers who
have not previously been well understood, or captured at all within the official
higher education data, the IHE Survey continues to evolve as more independent
providers join the regulated sector and start to return more comparable data.
It aims to complement these official data sources by reaching into the experiences
of independent providers individually and as a collective and garnering their
particular views of how well the sector’s bodies and structures accommodate them,
and whether policy proposals are likely to gain their support. The Survey also
provides a means of tracking future plans and expectations against the reality of
change year on year, in order to better inform a strategic approach to planning for
independent providers and the organisations which work with them.

This year sees the emergence of an important new group within the sector: the
higher education SMEs. Many of the differences in experience and attitude the
Survey has previously captured can now be correlated with new fidelity to the size
of the institutions concerned. The SME perspective is characterised by an ability
to shift gears quickly in response to a changing environment, exhibiting an
entrepreneurial spirit which offers resilience in the face of external challenges.
But it may also necessitate some different rules of engagement from regulators
and other authorities who have yet to firmly grasp the concept, and ensuring this
principle is adopted throughout government and the sector will be one of IHE’s
priorities over the coming year.

Alex Proudfoot
Chief Executive
Independent Higher Education

                                                        The Independent Higher Education Survey 2019   5
Introduction

     The third edition of the Independent Higher Education Survey comes at a time of great change for the
     education sector. The impact of the registration process for the Office for Students remains largely
     unknown and this survey is the first test of that. Other external pressures such as Brexit and the political
     environment also have the ability to change the size and shape of the independent higher education
     sector. For the first time this year, over 80% of respondents completed the survey in 2018, allowing us to
     look at change over this critical period.

     With an election just weeks away this year’s survey will also give insight into some of the hot political
     topics for higher education. We ask questions about Higher Technical qualifications, transnational
     education and student funding including what providers think of Labour’s proposals for a National
     Education Service free from cradle to grave.

     We have also asked about staff for the first time in this survey, exploring staff numbers as well as
     predictions for changes in the future. Delving more into corporate governance across our sector we
     looked at providers’ status as SMEs and if there were any identifiable features of SME higher education
     providers.

     The independent higher education sector has always evolved rapidly, our providers able to operate with
     agility, reacting to student choice at pace. With the rate of change the OfS brings, it is important to not
     only take a snapshot of the size, shape and characteristics of independent providers but to ask questions
     about the impact of change. A more consistent sample this year has allowed us to do that better than
     before.

     The Independent Higher Education Survey is the only survey of this valuable part of the higher education
     landscape and we are grateful to the sector experts, civil servants and providers who helped shape our
     questions to ensure they can bring to life the key topics and issues of 2019.

6   The Independent Higher Education Survey 2019
Survey demographic

The annual Independent Higher Education Survey received responses from a range of self-identifying
independent higher education providers, including those who have registered with OfS, those who have
chosen not to, and those who are ineligible for OfS registration. IHE members make up 59% of the
respondents. Our sample size is smaller than the two previous surveys, with only 82 providers completing
the survey. This sample is much more consistent than the previous two years as over 80% of respondents
also completed the survey in 2018. 18% of survey responses are from providers who chose not to
complete it before, including several providers new to the higher education system.

While this year’s survey demographic is very similar to 2018, 42 previous respondents chose not to
complete the survey this year, which reduces comparability on the overall sample. In some areas we found
it helpful to make comparisons with only those who completed the survey both years and we have
identified these instances in the report.

Once again, we asked providers to provide a student headcount across their programmes.
Figure 1 illustrates the size of this year’s cohort by student headcount:

    Figure 1:                         STUDENT HEADCOUNT
                                              2018      2018                                   STUDENT HEADCOUNT 2019
                                                    5000+
                                                                                                  STUDENT HEADCOUNT 2019
                                                                                                         5000+ 0
    IHE Survey                        1001-          1%                                                   4% 1%
                                                                  1-100
                                                                  1 100                                              1-100
                                      5000
    respondents by                                                 19%                                                18%
                                       21%                                           1001
                                                                                        1--5000
    size (IHE Survey                                                                    21%
                                                                                        21

    2019 & IHE Survey
    2018)

                                                                                    501-10
                                                                                         000
                                501-10
                                     000
                                       0                                              16%
                                                                                        %
                                  23%
                                    %
                                                                     101-5
                                                                         500                                          101-500
                                                                       36%
                                                                         %                                              40%

The responses received are again dominated by smaller providers, with 75% identifying as currently
having 1000 students or less enrolled at their institutions. 8% of those responding had 50 or fewer
students. The increase in the largest providers reflects a change in survey responses from specific
providers who have included the number of students they teach at levels 1-3 on the Qualifications
Framework and through CPD for the first time. The responses are consistent with previous years and
other data sources with 75% of providers having 1000 students or less 1.

75% of providers responding are based in London or the South East, similar to the spread of independent
HE providers across the UK in previous surveys. 21% of providers also report having one or more
additional campuses, half of these are outside London and the South East. Six providers report being
based in one of the three devolved nations.

181% of providers in the Higher Education Student Statistics: Alternative Providers, 2017/18 reported 1000 or less students:
https://www.hesa.ac.uk/news/14-02-2019/sb254-higher-education-student-statistics-APs/location

                                                                                        The Independent Higher Education Survey 2019   7
Providers by region

                          North East

                           Midlands

                               Wales

                    Northern Ireland

            Yorkshire and the Humber

                      East of England

                         North West

                            Scotland

                         South West

                          South East

                             London

                                        0%   10%     20%         30%          40%   50%   60%   70%

                                                       2017   2018     2019

         Figure 2: IHE Survey respondents by region three year comparison

8   The Independent Higher Education Survey 2019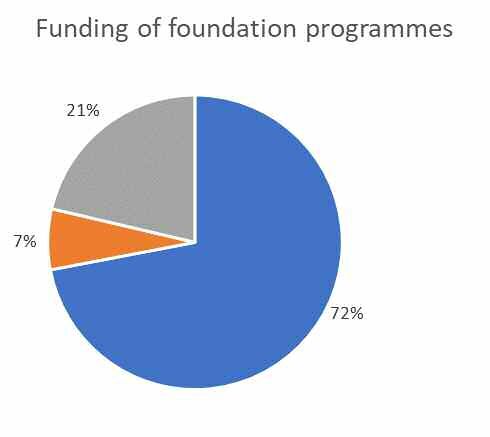
What do they teach?

The majority of providers who responded teach undergraduate degree courses (72%), with 11% of all
providers teaching at least one accelerated degree course. For the first time this year we separated out
other undergraduate provision, revealing that more providers teach level 4 than level 5 at 34% and 26%
respectively. We also asked about pathway to Master’s programmes for the first time, alongside pathway
to undergraduate programmes. Undergraduate pathways remain most popular at 23% of providers,
however, 15% of the respondents offer the pre-masters pathway route. 11% of providers offered some
form of further education, well over half of whom offering this alongside their undergraduate or
postgraduate provision, and many reported these numbers for the first time in this survey. In some
providers their provision at Levels 1-3 on the qualifications framework far outstretches their provision at 4+.

There is an increase this year in providers teaching franchised or subcontracted degrees (28%) while
both validated awards (63%) and those with their own degree awarding powers (6%) see a slight decline.
The decline in providers offering awards by Pearson continues, with some providers from 2018 reporting
that they no longer teach these qualifications.

                                                                                        Qualifications

                     Validated UK degrees and awards (via university partner)

                                             Internal and unaccredited awards

  Franchised or subcontracted UK degrees and awards (via university partner)

                       Professional or industry accreditations or qualifications

                       Pearson awards (including BTECs and Higher Nationals)

                                       Other RQF awards regulated by Ofqual

                                      Overseas university degrees and awards

   Recognised UK degrees and awards (via your own Degree Awarding Powers)

                                SQA (Scottish Qualifications Authority) awards

   Franchised or subcontracted UK degrees and awards (via FE college partner) *

                                                              Prefer not to say

                                                                                   0%     10%          20%     30%   40%   50%    60%     70%    80%    90%

                                                                                        2017    2018    2019

   Figure 3: IHE Survey respondents by qualifications three-year comparison

*These categories were not included in this question in the 2018 survey.

Over half of the respondents offer two or more different qualification types (61%) with the majority
(37%) offering two qualification types. While this is a decrease from 46% last year, the proportion of those
offering three qualifications is up from 15% to 17%. The most common combination of qualifications
awarded were providers who had both a validated programme and their own internal or unaccredited
award.

                                                                                                                     The Independent Higher Education Survey 2019   9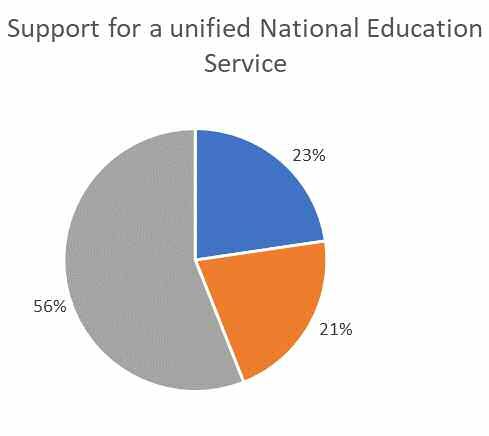
Models of teaching

      Each year we have asked providers if they teach some of the alternative models of delivery most relevant
      to current policy discussions. This year we made some changes to the list. We split the question of
      apprenticeships into Degree Apprenticeships and those below degree level. While a similar number of
      providers taught apprenticeships, 4% and 5% respectively, only one provider offered both degree and
      below degree level apprenticeships. One third of providers offer work placements as an assessed part of
      their course, and 5% offer closed courses for corporate or external partners. Again this year, high numbers
      of providers deliver courses designed to give students greater choice over when they learn, and 20%
      indicated they offer block teaching, delivering learning one subject or module at a time. There was a
      high correlation of providers delivering part-time and flexible learning, evening and/or weekend, online,
      distance and blended learning and block teaching.

                                                                   Alternative delivery models 2019

                                       Part-time and Flexible learning

                                    Evening and/or weekend learning

                                        Work placements (assessed)*

                               Online, Distance and Blended learning

                  Block teaching (e.g. one subject/module at a time)*

                                                Pre-Master's courses*

                       Accelerated programmes (e.g. 2 year degrees)

                     Integrated Degree with foundation year (4 years)

                                                                Other

       Closed courses (any length) for corporate or external partners*

          Integrated Degree with foundation year (3 year accelerated)

                                 Apprenticeships below degree level*

                                            Degree Apprenticeships*

                       Articulated pathways (2+1 models and similar)

                                                                         0%   5%   10%    15%    20%   25%   30%   35%   40%   45%

          Figure 4: Alternative delivery models 2019

      * Indicates new or changed field from the 2018 survey

10   The Independent Higher Education Survey 2019
Institutional missions
Providers were asked to select up to three categories that best reflected their institutional missions.
The top three responses remain the same as last year but gain prominence in the data. Over 60% have
missions related to a specific industry or professional focus and 35% have a specific mission of widening
participation and access to HE.
Institutional Mission
Specific industry/professional focus
Charitable/not for profit
Widening participation and access to HE
Encouraging the arts
International education and cooperation
Theological vocation
Entrepreneurship and incubating start-ups
Study abroad
Other - write In
Advancing scientific learning
0% 10% 20% 30% 40% 50% 60% 70%
Figure 5: Institutional Mission 2019
Smaller providers (less than 500 students) were more likely to have charitable/not for profit missions.
Those with a theological mission tended to be smaller and also have a charitable/not for profit mission.
The Independent Higher Education Survey 2019 11Regulation and Oversight
Regulation and Oversight was always going to look very different in 2019 with the Office for Students
taking over both educational oversight for Tier 4 sponsor licences from the Quality Assurance Agency
(QAA) and designation for student loans from the Department for Education. However only 45% of all
providers taking the survey have registered with the Office for Students, despite 64% of providers in 2017
and 71% of providers indicating they would or had already registered with the Office for Students.
Office
Office for Students
for Students status status
2019 2019
2%
1%
12% Not eligible to register
21%
Eligible but do not plan to register
3%
5% Eligible but undecided if will apply to register
Unsure if eligible to register
Registered in the Approved (fee cap) category
Registered in the Approved category
11% 16%
Intend to register in the future
Applied to register but do not yet have a final
decision
Applied to register but have been refused
29%
2017: In the new single system of 22018: What category have you/do you
regulation, which option are you most expect to register in?
likely to choose?
None - we will not
register with the
3%
office for students
8%
11% Basic Registration None- we will not
21%
register
34%
Approved
Approved
Approved (fee cap)
43%
39% Approved (fee cap) 28%
Don't know/unsure
14%
ŽŶ͛ƚŬŶŽǁͬƵŶƐƵƌĞ
Figure 6: Office for Students status comparison 2017-2019
12 The Independent Higher Education Survey 2019Of those that responded in 2018 and had already applied to the OfS register, only 72% of those were
successful in being registered and in the category they applied to. A further 3% of providers found success
after dropping from the Approved (fee cap) to Approved. Rounding out the successful group were a final
3% who applied after they responded to the survey in October 2018 and achieved registration by this
year’s survey deadline and one provider applied to Approved but registered as Approved (fee cap).
14% of last year’s respondents remain without a registration decision, with half of those applying after
October 2018. A small number of providers from the 2018 survey still intend to register in the future (7%).
Some providers remain unsure of their eligibility (6%) however 13% have confirmed they are ineligible to
register with OfS.
Many providers remain with QAA as their body for higher education review, as QAA continues to provide
the required ‘educational oversight’ for those with a Tier 4 licence who are ineligible for the Office for
Students. For the first time in 2019, qualifying independent HE providers have been given access to new
“full privileges” of Tier 4 sponsorship. This includes eligible students having the right to work while
studying and bring dependants with them while they study. While more providers have been given the
privileges (58%) than not, this does not include all OfS registered providers. 39% of registered providers
have indicated they do not have a Tier 4 licence to sponsor international students and the remaining 3%
have not yet attained the required immigration history to be eligible for these new privileges.
Providers: Regulation and Oversight
OIA (Office of the Independent Adjudicator) - scheme member
QAA reviewed
QAA reviewed for Educational for Educational
Oversight Oversight
(i.e. ineligible for OfS)
Home Office licensed for Tier 4 student visas - "full privileges"
Subject to Prevent Duty and monitored by DfE or Ofsted (i.e. not by OfS)
Home Office licensed for Tier 4 student visas - without "full privileges"
Ofsted inspected
BAC (British Accreditation Council) accredited
ISI (Independent Schools Inspectorate) inspected
Scottish Qualifications Agency
Institute for Apprenticeships and Technical Education
Education and Skills Funding Agency - approved for Advanced Learner Loans
Education and Skills Funding Agency - funded under the Adult Skills Budget
0% 10% 20% 30% 40% 50% 60% 70%
Figure 7: IHE Survey respondents by regulation and oversight
Another welcome change is the number of regulators providers must satisfy, with all providers seeing a
decline in regulators from last year. Providers with less than 500 students saw a noticeable decline, with
most having only one or two regulators in this year’s sample.
The Independent Higher Education Survey 2019 13Student Funding from Scotland,
Wales and Northern Ireland
Last year we asked providers if they were regulated by any of the authorities in Scotland, Wales or
Northern Ireland for the purposes of students from those nations accessing student loans. Following the
consultation in January on changing the regulation for Welsh students studying outside of Wales, and
changes made in Scotland to allow for a reciprocal arrangement for independent providers based in
Scotland to access loans from other nations, we sought to understand the scale of access to student
loans UK-wide.
Does
Does youryour institution
institution have designation
have designation for your
for your students students
to access toloans
student access student
from devolvedloans from devolved administrat
administrations?
Northern Ireland Scotland Wales
Unsure 17% 11% 13%
Yes, we operate outside this devolved administration 21% 19% 24%
Yes, we operate from within this devolved administration 8% 13% 9%
No, we intend to apply in future 14% 17% 14%
No, we do not intend to apply 40% 40% 40%
Figure 8: Access to student loans from devolved administrations
We asked providers to indicate if their students currently had access to student loans if they operated
within or outside the devolved administration. We also asked if they intended to apply in future. 40% of
respondents do not intend to apply for access to student loans from any devolved administration. These
providers are primarly not registered with the Office for Students, although there remains a small portion
who have registered but do not teach any courses eligible for student loans (8%).
14 The Independent Higher Education Survey 2019Teaching Excellence and Student
Outcomes Framework (TEF)
One third of respondents remain ineligible for TEF with a further 28% choosing to not apply for an
award from the framework. For the first time in the three year history of this survey the number of
independent higher education providers with a TEF Bronze, Silver or Gold award is greater than those
who have received a Provisional award due to not having the required data to participate fully.
TEF remains voluntary for providers registered with OfS and registering fewer than 500 students.
Despite 58% of 2019 respondents having fewer than 500 students, one third have a TEF award and a
further 11% intend to apply. The very smallest providers (1-100 students) are either ineligible or are
choosing not to apply. The majority of those with a Gold, Silver or Bronze award have between 101-500
or 1001-5000 students.
TEF Participation 2019
19%
34% No, we are not eligible for TEF
No, we are not eligible for TEF
We intend to apply for the first time in
2020We intend to apply for the first time in
2020
Yes, we have received a Provisional TEF
Yes, we have received a Provisional TEF
award
award
No, we
No,have chosen
we have notnot
chosen toto
apply
apply
Yes, Yes,
we have received
we have a full
received TEF
a full TEFaward
award
(i.e. a(i.e.
rating of Bronze/Silver/Gold)
a rating of Bronze/Silver/Gold)
28%
9%
10%
Figure 9: Participation in the Teaching Excellence and Student Outcomes Framework 2019
The Independent Higher Education Survey 2019 15Students
We asked independent providers about where their students resided before coming to study with them,
and what courses they were currently studying. While most students were studying on full-time courses,
24% of students were studying part-time, and this includes the newly recorded category of students
studying CPD courses at independent higher education providers. One provider also reported 60,000
students studying below degree level part-time which we removed from the figures due to its significant
impact on the data.
Student origin (full time students)
The 2019 sample has more non-EU students UK full-time EU full-time Non-EU International
studying than ever before, with a decrease in
both EU and UK students. The most significant
decrease is in the number of providers reporting 26%
UK undergraduate students, at degree or other 37%
47%
undergraduate degree level. The addition of
pre- master’s students in the numbers has also 17%
increased the amount of non-EU students in the
14%
sample, however this was slightly off-set by a
10%
decline in study abroad student numbers.
Together providers who responded to the 57%
survey teach 64,561 full time students. The 49%
43%
reduction from 2018 is primarily due to the
change in survey participants, as only 18% of
providers who completed both 2018 and 2019
surveys report any decline in their student 2019 2018 2017
numbers. Figure 10: Student origin comparison three years
Number of students on different course types
Pathway courses (Access and Foundation)
Undergraduate Degrees (including final year top-up degrees)
Short courses up to 1 week
Continuing Professional Development (CPD) programmes
Other
Pathway courses (Pre-Masters)
Other undergraduate provision at Level 5 of FHEQ (or Level 8 of SCQF)
Short courses over 1 week
Study abroad and summer programmes
Other undergraduate provision at Level 4 of FHEQ (or Level 7 of SCQF)
Postgraduate taught qualifications (Level 7 FHEQ / Level 11 SCQF)
Accelerated Undergraduate Degrees (2-year degrees)
Further Education (Levels 1-3 RQF)
Postgraduate research qualifications (Level 8 FHEQ / Level 12 SCQF)
0 2000 4000 6000 8000 10000 12000 14000 16000
UK full-time students EU full-time students UK and EU part-time students Non-EU international students
Figure 11: Students by course type
16 The Independent Higher Education Survey 2019Corporate Governance and size
As we did last year, in 2019 we asked providers what corporate form best describes their corporate
governance, however this year we also asked about their organisation size according to the definitions of
micro, small, medium and large businesses set by European standards. This allowed us to explore the
interactions between governance, size and many other factors from within the survey.
This year is remarkably similar to 2018 with almost half of the respondents reporting they are either a
charity, part of a charity or a not for profit company (49%). There are slightly more providers who are
registered as a Company limited by Shares or a Limited Liability Partnership than last year.
Independent HE providers: Corporate governance
8% 5%
P a larger corporate group based
Part of
outside of the UK
10% Company limited by Shares
29%
Not for Profit Company limited by
Guarantee
4%
Charity with primary charitable object to
advance education
4% Prefer not to say
4% Part of a larger corporate group based in
the UK
Limited Liability Partnership
Part of a larger charity with other
22% charitable objects
14% Other:
Figure 12: Corporate governance 2019
Over half of the not for profit companies in the survey have been confirmed ineligible for registration
with the Office for Students, while companies limited by shares are significantly more likely to register,
and to do so in the Approved (fee cap) category. Providers who are part of a larger corporate group are
experiencing challenges in registering with OfS, with half ineligible and half still waiting for a decision.
For the first time in 2019 we asked providers to identify the size of their institution following the European
Commission SME definitions. Almost 90% of providers completing the survey identify as SME.
The Independent Higher Education Survey 2019 17Company and charity category 2019
Company and charity category 2019
11%
17%
Micro (0-9 employees / under £2m turnover)
Micro (0-9 employees / under £2m turnover)
Small (10-49 employees / £10m turnover)
Small
M (10-49 employees / £10m turnover)
Medium (50-249 employees / £50m
28% turnover)
Medium (50-249 employees / £50m
Largeturnover)
(250+ employees / over £50m
turnover)
Large (250+ employees / over £50m
turnover)
44%
Figure 13: Company and charity category 2019
Micro companies were significantly more likely to have corporate models which eschewed profit, while
small companies were more likely to be a company limited by shares. Large providers answering the
survey were fairly evenly distributed across all corporate governance models.
Corporate governance and size category 2019
Corporate governance and size 2019
Other
Part of a larger charity with other charitable objects
Limited Liability Partnership
Part of a larger corporate group based in the UK
Prefer not to say
Charity with primary charitable object to advance education
Not for Profit Company limited by Guarantee
Company limited by Shares
Part of a larger corporate group based outside of the UK
0 5 10 15 20 25 30
Micro (0-9 employees / under £2m turnover) Small (10-49 employees / £10m turnover)
Medium (50-249 employees / £50m turnover) Large (250+ employees / over £50m turnover)
Figure 14: Corporate governance and size 2019
18 The Independent Higher Education Survey 2019Staff at independent higher
education providers
For the first time in 2019 we asked respondents to tell us the number of staff they employed in the past
year. Independent higher education providers employ high numbers of contract staff, almost equal to their
full-time employees. Providers with a specific industry or professional mission are just as likely to hire
contract staff as full-time staff, and those with a mission of encouraging the arts are twice as likely to hire
contract staff as full-time staff.
Figure 15:
Staff at independent
HE providers
Location has no impact in our sample on whether staff are from the UK, EU/EEA or outside the EU, but
size does, with small providers being more likely to hire from the UK.
The Independent Higher Education Survey 2019 19Office for Students Registration
Registration with the Office for Students has been the single most significant challenge of the year for
most independent providers. In 2018 survey respondents rated it their most important priority for the next
two years. For many there were, and remain, genuine questions on eligibility, suitability, affordability and
benefit. For most there was no choice in the decision, as their delivery models required successful
registration to ensure their domestic students could access student loans and their international students
could obtain Tier 4 visas.
The experience of registering with the Office for Students has been different for each provider, and there
are some notable circumstances made visible when we look at certain sizes of provider. All of the
providers who remain unsure about their eligibility, or who feel they are eligible but are not yet planning
to register, have between 101-500 students. More providers are registered in Approved (fee cap) and
gain access to public funding in the 1001-5000 student category suggesting that the additional burden of
requirements in this category may be too great for those with fewer than 1000 students. This conclusion is
supported in the comparison between the 2018 and 2019 survey cohorts. All those providers who applied
to register in Approved (fee cap) but ended up registered in Approved instead had fewer than 1000
students. 19% of providers plan to apply to change the category of their registration over the next year,
and a further 24% are unsure if they will make a change.
Office for Students registration by provider size
35 Applied to register but have been refused
Applied to register but do not yet have a final decision
Intend to register in the future
30
Registered in the Approved category
Registered in the Approved (fee cap) category
25
Unsure if eligible to register
Eligible but undecided if will apply to register
Number of providers
20 Eligible but do not plan to register
Not eligible to register
15
A
10
5
0
1-100 101-500 501-1000 1001-5000 5000+
Student numbers
Figure 16: “What is your registration status with the Office for Students?” by size of provider
20 The Independent Higher Education Survey 2019Of those who still intend to register, most plan to do so in 2020 before the new traditional academic year
begins in September. 63% of those who intend to apply will do so in the Approved category. Those who
have been confirmed ineligible are most likely to be ‘not English enough’ for OfS, being either overseas
institutions, based in the rest of the UK, or have too much academic or corporate control of their English-
based provision located outside of England. Those providers unsure if they are eligible cited a lack of
clarity in the OfS guidance and difficulties around unique programmes as the main reasons.
Those who are not eligible to register responded that their lack of eligibility would pose no disadvantage
to their students, however there remained concerns from independent providers in the devolved
administrations that their students may be disadvantaged should there not be an alternative method to
obtain designation for student loans and the full privileges of Tier 4. Some ineligible providers noted that
neither they nor their students sought the benefits of OfS, and in the words of one respondent that the
process was “going to be arduous and more expensive to register.” Those refused registration were
concerned that this would have a negative impact on their students, citing a decline in recruitment and the
loss of access to loans for their students as the critical factors.
21% of providers are still waiting for a decision, three quarters of whom have applied for the
Approved category.
The Independent Higher Education Survey 2019 21Funding from the Office for Students
We asked providers to identify the types of student and research funding they receive from OfS including
student loans and teaching and capital grant. Only 51% of providers who answered this question report
that all of their courses are eligible for student loan funding, a further 43% report that some of their
courses are eligible. 16% of those who replied say they received recurrent grant funding in 2019 while
16% would like to apply for research funding in the future.
Figure 17: Main Drivers for Registration
What were your
main drivers for
Other
registering?
Research grant funding
Access to project funding e.g. Challenge
Competitions
Teaching grant (recurrent funding)
Other student-targeted funding
Degree Awarding Powers
Access to student finance/loans
0% 10% 20% 30% 40% 50% 60% 70%
Over 60% of those who registered were driven by access to student finance and loans, but only just over
10% wanted access to other student-targeted funding and even fewer were interested in teaching grant.
Reasons listed in the ‘Other’ category include Tier 4, brand and reputation.
22 The Independent Higher Education Survey 2019Experience of the Office for Students
We asked providers to share any further thoughts on their experience of the registration process and/or
any contact they may have had with OfS. 57% of providers’ comments were negative, 23% were mixed
and only 11% were positive. Many cited issues with delays, poor communication and inadequate
guidance. Providers also expressed concern that OfS demonstrated poor knowledge of independent or
alternative providers of HE and were not properly set up to support or engage with SME organisations.
Very limited responses received from any communication to OfS
A struggle – a lack of understanding of the sector. We applied in April 2018 and didn't receive
confirmation until April 2019. We were told we would hear by September 2018, but it got very
complicated. This should have been foreseen!
They are still learning what they are doing so speaking to people they gave different answers –
always had to have them write things down so we had a reference basis. Also they do not seem to
understand an organisation where higher education is not the lion's share of the income.
They demanded more evidence from us but have not reported back to us on that at all.
Of those who left a comment, 11% were positive comments, primarily focused on helpful staff.
OfS were helpful throughout. We had a named point of contact which was useful.
We had a fairly positive experience with the OfS registration process. The process took longer than
anticipated, but staff at OfS were very responsive with any of our enquiries.
The Independent Higher Education Survey 2019 23Policy questions
Transnational Education
Following from the more generic questions on transnational education (TNE) in 2018 we sought to
explore how engaged providers were with unique ways of delivering TNE for this year’s survey.
In consultation with the Department for International Trade staff we drafted a short list of the types of
TNE more commonly found in SME providers, alongside the more traditional TNE models of campus and
partnership delivery. This formulation received a more positive response from providers than the more
generic questions of 2018.
Transnational Education
Short professional courses delivered outside the UK
Branch campus outside the UK
Articulation agreement (with partner outside UK)
Joint/dual programme (part delivered outside UK)
Franchise with international partner (delivered outside UK)
Online learning (open to international students)
Blended learning (in-person delivered with short visits to the UK)
Blended learning (in-person delivered outside UK)
None of the above
0 5 10 15 20 25 30 35
Number of providers
Yes
yes Unsure
unsure We are developing plans to We would like to explore this in the future
Figure 18: Do you teach students through any of the following forms of transnational education?
There was no correlation between the types of courses delivered by the provider in the UK and their
response to this question. As might be expected, those with an International Education mission were 63%
more likely to do TNE than those without. Small and medium providers were twice as likely to do TNE as
micro or large providers in this sample.
24 The Independent Higher Education Survey 2019Policy questions
Higher technical education
Following the release of the Higher Technical Education Consultation by the Department for Education in
the summer, a project which IHE has been supporting as part of an expert reference group, we sought to
understand whether opinion had changed on the new qualifications proposed. Despite the industry focus
of much independent higher education, and the further policy details offered by the consultation,
providers remain highly sceptical of
the proposals, with 53% suggesting Would you consider offering Higher Technical
they would not consider offering a Education courses at your institution?
higher technical qualification and 3%
Yes
3%
just under 50% saying none of the
incentives proposed would encourage No
Unsure
22%
them to do so. 22%22%
We already offer what
22%
we consider to be
Level 4 or 5 higher
This year saw a decline in the number
of providers offering Level 4 and Level technical education
5 (FHEQ) courses in the survey 53%
however those that did reply are 53%
evenly split with one third indicating
they would consider offering higher
technical, one third saying they would Figure 19: Would you consider offering Higher Technical Education
Yes courses at your institution?
not, and one third remaining unsure.
Figure 20: What incentives would encourage you to submit current qualifications or develop
new qualifications for consideration as Higher Technical Qualifications?
What incentives
would encourage Flexibility to approve and fund individual modules and smaller qualifications
you to submit None
current A competitive funding package (which could include higher tuition fee
support, maintenance funding, or better loan terms for students)
qualifications or A straightforward process for submission, appraisal and decision by the
Institute for Apprenticeships and Technical Education
develop new
No extra requirement for programmes to be externally validated
qualifications for
A clear mark of labour market relevance
consideration as
Higher Technical New (DAPs-style) Level 5 Awarding Powers
Qualifications? Enhanced information, advice and guidance for prospective students
Other please specify
0% 10% 20% 30% 40% 50%
Again in 2019 providers felt most strongly that none of the proposals would encourage them to deliver
higher technical education, and there was a very high correlation to those who said they would not
consider offering Higher Technical education in the future. The largest providers were most likely to be
incentivised by a competitive funding package while the smaller providers were also encouraged by
flexibility to approve and fund individual modules and smaller qualifications. Those who were unsure were
most likely to be encouraged by incentives which made the process easier, such as a straightforward
process for submission and no additional requirement for programmes to be externally validated.
The Independent Higher Education Survey 2019 25Policy questions
Policy to impact future student funding
This year we asked only two core questions related to future student funding models: the Augar report’s
proposal to remove funding from foundation programmes and the Labour party’s support for a national
education service.
Funding of foundation programmes Support for unified National
Education Service
Figure 21: Do you support the funding of foundation Figure 22: Do you support the Labour Party proposal
year programmes which aim to support for a "unified National Education Service
students into higher education? (NES) for England to move towards cra-
dle-to-grave learning that is free at the
point of use"?
Providers were strongly in support of continuing to provide funding for foundation courses, although 21%
remain unsure. When asked why they were positive most providers argued that foundation programmes
widen access and several specifically mentioned mature learners and those moving from industry to
learning. There was also strong support from those who argued that foundation programmes were vital
for arts degrees, where art and other creative education at A-level may be lacking. Most of those unsure
reported that they did not offer foundation programmes themselves and did not feel they could comment
or take a position.
Another headline to dominate the higher education space is the proposal from the Labour Party for a
‘cradle to grave’ free National Education Service. We asked providers if they supported Labour’s
proposals. Over half were unsure, citing a lack of detail on the impact of the proposals on delivery models
like accelerated degrees, or on the regulation for new or privately funded providers. Several agreed that
the costs of higher education are too high, but are unsure Labour’s plan has considered the full cost of
delivery of higher education. Across all three responses many providers agreed that the motivation was
honourable, to make education more affordable, but that perhaps the plans would be difficult to deliver.
26 The Independent Higher Education Survey 2019Policy question
Student Mental Health and Well-being
Working closely with the Office for Students, we S
asked providers if they saw student mental health Student mental health and welfare
and student welfare as particular strategic priorities 8%
8%
at their institution? 75% of providers said yes. IHE
members were more likely to respond positively and
17% 17%
50% less likely to be unsure than non-members.
Providers offering franchise/sub-contracted provision
or their own internal awards are less likely to make
student mental health and welfare a strategic priority.
When asked what activities they were undertaking
75%
to support this strategy, most noted training in 75%
mental health first aid and the creation or
development of dedicated student welfare or
Figure 23: The OfS has made student mental health
support services in-house.
and student welfare (particularly relating
to hate crime and harassment) priority
issues for their work at sector level (as
opposed to individual provider-level
regulation). Do you see these areas as
particular strategic priorities at your
institution?
Brexit
We asked providers if they are planning for the UK’s exit from the European Union. Over half said they
were not and a further 15% were unsure if their organisation was planning for the UK to exit the EU. 23%
of respondents said they were planning for multiple different outcomes as part of the Brexit process, while
almost no providers were planning specifically for the withdrawal agreement as proposed in Parliament.
IHE members were more likely to be planning for Brexit than non-members.
We asked providers what areas they were planning in and responses were evenly split between those
planning for changes to the Tier 4 and Tier 2 system to accommodate EU nationals and those who were
focused on student recruitment. Several providers mentioned that part of their planning was to apply for
a Tier 4 licence for the first time.
The Independent Higher Education Survey 2019 27Membership and engagement with
sector bodies
For the third year we asked respondents a series of questions to determine their membership and level
of engagement with a number of sector bodies within UK higher education. Providers were asked to
describe their relationships with 11 of the main sector bodies by indicating whether or not they were
already members/subscribers, whether they intended to join in the future, and their interest in or use of
related services offered by the organisation. We also allowed them to write in a further two sector bodies
if they felt they should be included. The below 9 bodies were selected after reflecting on the responses
from 2017 and 2018. Any sector body who received two or fewer responses were not included in the
chart shown below.
90% of the independent higher education providers who responded indicated that they had previously
engaged or intend to join with one or more of the sector bodies listed. Preferences remain similar to
2018, with independent providers preferring to join larger sector bodies with clear links to regulation.
The responses show that Copyright Licensing Authority (CLA) and Quality Assurance Agency (QAA) are
the most commonly cited as a positive relationship. We have also seen a rise in both membership of and
interest in Advance HE and Jisc among independent higher education providers. However, membership
or subscription of higher education sector bodies remains generally low, and very few providers
expressed an intention to join the organisations listed.
Engagement with HE sector bodies UKCISA
UCAS
Intend to join
Interested in certain services
QAA
Members / Subscribers
No current relationship or interest
Jisc
Unsure
Use certain services (e.g. events, training, consulting)
HEPI
CLA
AUA
I
AGCAS
Advance HE (formerly LFHE, ECU, HEA)
0% 10% 20% 30% 40% 50% 60% 70% 80% 90% 100%
Figure 24: Engagement with UK Higher Education Sector Bodies
28 The Independent Higher Education Survey 2019We then asked respondents to further consider their engagement with HE sector bodies to understand
what may motivate independent providers to engage. Only a small number of independent providers
agreed they received good value from these interactions. Worst performing was the HE sector’s
commercial services, which independent providers rated the worst of the four areas indicated.
Also notable in the data is that most independent providers do not agree that HE sector bodies
understand their particular needs.
Figure 25: Service and value for money: HE sector bodies
The Independent Higher Education Survey 2019 29The Future
Growth and decline in staff and student numbers
Last year we asked respondents to predict if their student numbers would grow, decline or stay the same,
and for 2019 we compared the actual figures reported for those providers completing both surveys to see
how accurate they were.
EU/EEA student numbers decline was in most cases predicted with some accuracy, but some providers
experienced unanticipated growth in this group. Predictions were also off for UK students whose numbers
declined and non-EU students who had less of a decline than predicted.
2018 Growth/Decline predictions versus
reported figures
60%
50%
40%
30%
20%
10%
0%
2018: UK 2019: UK 2018: EU/EEA 2019: EU/EEA 2018: Non-EU 2019: Non-EU
student student student student international international
numbers numbers numbers numbers student student
Prediction prediction numbers numbers
Growth Decline No change
Figure 26: 2018 Growth/decline predictions versus 2019 reported figures?
For the coming year, many providers predict a decline in EU numbers and contrasting growth in UK staff
and students. One third of small providers in particular fear that they will lose EU students. Most differ-
ently sized providers are pessimistic about staff growth, with the exception of large providers who expect
to grow further. Most large providers expect to grow UK and Non-EU students but to lose EU staff.
Most SME providers expect little change in staff numbers.
Figure 27:
Growth and decline in
staff and student numbers
EU 2019: Non-EU
nal international
student
s numbers
30 The Independent Higher Education Survey 2019Degree Awarding Powers
2018 Survey: No, we do not expect to apply for
Do you plan to apply for Degree
5% DAPs before August 2020
Awarding Powers before August 2020? 17%
Unsure
We have already applied for DAPs
under the old process and have an
50% application under consideration
7% We have already been granted
DAPs under the old system
Figure 28a:
5% Yes, we will apply under the route
Plans for degree awarding
for Established Providers
powers 2020
D 16% Yes, we will apply under the route
for New Providers
2019 Survey: 5%
Do you plan to apply for Degree 10%
Awarding Powers before August 2021?
Single Subject/Level
Apply for Degree Awarding
6% Powers Single Subject/Level
A
Apply for New Degree
Awarding Powers
Apply for full Taught Degree
Figure 28b: Awarding Powers
Plans for degree awarding Do not intend to apply
powers 2021
79%
Following the release of guidance on degree awarding powers by the Office for Students towards the end
of 2018, the percentage of providers who did not intend to apply for degree awarding powers of any form
increased from 50% last year to 79% in 2019. Of those providers who responded last year that they had
already been granted DAPs under the old system, or were applying under the old system, one had been
granted DAPs and the status of two providers who had already applied was unknown.
None of the providers with DAPs are represented in the 2019 DAPs data.
Of those who reported that they were planning to apply for degree awarding powers by the end of 2021,
the majority (10%) are intending to apply for New Degree Awarding Powers, with 5% planning to apply
for single subject/level degree awarding powers and 6% planning to apply for full taught degree awarding
powers. Again, there is no apparent relationship between the size of providers and their plans to apply for
any of the three types of degree awarding powers. Those planning to apply for New Degree Awarding
Powers are a mix of established providers, providers who are not yet on the register, and providers who
are yet to open their doors to students. Whereas providers intending to apply for Taught Degree
Awarding Powers are all established providers, although not all of them are yet registered with the
Office for Students.
The Independent Higher Education Survey 2019 31Plans for the next two years
Providers were asked about their medium-term plans (up to 2021) to better understand what the key areas
of change in the sector might be over the next three years. Whilst direct comparisons cannot be made
due to differences in respondents, the objectives over the last three have fluctuated across a number of
objectives. Of those who completed the survey both in 2018 and 2019, we can see that developing
capacity in academic and applied research remains a top priority for these providers. Forming a new
international partnership became more popular amongst these same providers, as did securing a Tier 4
licence. The most popular response last year of registering with the Office for Students was not chosen by
any of the continuing respondents.
Objectives
Objectivesfor the next
to 2021: two years:
2017-2019
Develop your capability in academic or applied research
None of the above
Form a new international partnership
Secure a Tier 4 licence for student visas from the Home Office
Open a new campus in the UK
Move into online course delivery
Find a new university partner to validate courses
Apply for New Degree Awarding Powers
Open a new campus elsewhere in the world
Apply for full Taught Degree Awarding Powers
Apply for Degree Awarding Powers Single Subject/Level
Move into the delivery of degree apprenticeships
0% 5% 10% 15% 20% 25% 30% 35% 40%
2017 2018 2019
Figure 29: Objectives for the next two years: 2017- 2019 comparison
32 The Independent Higher Education Survey 2019The top three objectives for this year’s respondents were developing capability in academic or applied
research, securing a Tier 4 license for student visas, and forming a new international partnership.
The bottom three objectives were delivering degree apprenticeships, opening a new campus in the
EU/EEA, and delivering of apprenticeships below degree level.
Looking into more depth at the three objectives based on the size of the provider, small providers were
most likely to prioritise securing a Tier 4 license than their micro and large counterparts. Developing
capability in academic or applied research was prioritised more by small and medium providers than micro
and large providers, and forming a new international partnership was most likely prioritised by small and
large providers. With regards to student numbers, providers with 101-500 and 501-1000 students were
most likely to prioritise securing a Tier 4 license, whilst providers again with 101-500 students were most
likely to prioritise developing capability in academic and applied research than those with other student
populations. Large providers with over 5000 students were most likely to prioritise setting up a new
campus elsewhere in the world.
Objectives to 2021
Apply for New Degree Awarding Powers
Develop your capability in academic or applied research
Move into the delivery of apprenticeships below degree level
Move into the delivery of degree apprenticeships
Move into online course delivery
Form a new international partnership
Open a new campus elsewhere in the world
Open a new campus in the EU/European Economic Area
Open a new campus in the UK
Secure a Tier 4 licence for student visas from the Home Office
Find a new university partner to validate courses
Apply for full Taught Degree Awarding Powers
Apply for Degree Awarding Powers Single Subject/Level
0 2 4 6 8 10 12 14 16 18 20
Number of providers
Ranked 1 Ranked 2 Ranked 3
Figure 30: Objectives to 2021 rankings
The Independent Higher Education Survey 2019 33Priorities for the future
Priorities forfor
Priorities independent higher
independent highereducation
educationproviders
providers2019
Supporting student mental health and wellbeing
Marketing and recruitment
Academic governance
Widening access to higher education
Developing student services and pastoral care
Complying with Tier 4 sponsorship duties
Student data and learner analytics
Supporting students with disabilities
Professional development of academics and tutors
Corporate governance
Student representation
Virtual Learning Environments (VLE)
Improving student assessment and feedback
Learning facilities, including library resources, studios and laboratories
Validation and franchise partnerships
Complying with guidance from CMA (Competition & Markets Authority)
Advising international students on visas
Student terms and conditions
Information, Advice and Guidance for prospective students
Student complaints handling and appeals procedures
Other - please specify
0% 10% 20% 30% 40% 50% 60% 70%
Figure 31: Please identify any areas which are a priority for your institution over the next three years
The survey asked providers to select their priorities for the next three years from a list of 20 key areas.
Providers selected an average of 8 priorities each, with the top 10 being selected by over 40% of
providers. The figure above shows the 20 key areas ordered by the percentage of providers who selected
each as a priority. Providers most commonly identified priorities such as marketing and recruitment,
supporting student mental health and wellbeing, student data and learner analytics, developing student
services and pastoral care, and widening access to higher education.
We then asked providers to rank their top five priorities from those they had selected. The top-ranked
issues change slightly in this case. Marketing and recruitment move to the top of the list, and supporting
student mental health and wellbeing moves to number 7. Academic governance, widening access to
higher education and developing student services and pastoral care retain their spot in the top 5 as they
did in 2018. However, student data and learner analytics moves out of the top 5 this year, to be replaced
by corporate governance.
34 The Independent Higher Education Survey 2019PRIORITIES RANKED IN PROVIDERS’ TOP 5
1. MARKETING AND RECRUITMENT
2. ACADEMIC GOVERNANCE
3. WIDENING ACCESS TO HIGHER EDUCATION
4. CORPORATE GOVERNANCE
5. DEVELOPING STUDENT SERVICES AND PASTORAL CARE
Marketing and recruitment appeared as a greater priority for those with fewer than 1000 students.
Academic governance was a greater priority for those with fewer than 100 students, although it remained
a high priority for every other size of provider. Student representation became a greater issue for providers
as they grew, with more providers choosing it as a priority the higher you go in student number bands.
Validation and franchise partnerships were significantly more of an issue for providers in the 501-1000
students band than any other.
The OfS status of the providers also influenced their prioritisation of the key areas. Providers in Approved
(fee cap) were most likely to be concerned about widening access to higher education. Marketing and
recruitment was most important for those in the Approved category and those still waiting for their
registration to be completed. Academic and corporate governance was a high priority for those who have
applied to OfS, but developing student services and pastoral care was less important for those already on
the register. Mental health ranked highly in all categories except for those who intended to register in the future.
Priority Ranking
Ranked 1 Marketing and recruitment
Academic governance
Ranked 2
Widening access to higher education
Ranked 3 Corporate governance
Developing student services and pastoral care
Ranked 4
Complying with Tier 4 sponsorship duties
Ranked 5 Supporting student mental health and wellbeing
Student data and learner analytics
Supporting students with disabilities
Validation and franchise partnerships
Student representation
Improving student assessment and feedback
Learning facilities, including library resources, studios and laboratories
Professional development of academics and tutors
Advising international students on visas
Virtual Learning Environments (VLE)
Complying with guidance from CMA (Competition & Markets Authority)
Information, Advice and Guidance for prospective students
Other - please specify
Student complaints handling and appeals procedures
Student terms and conditions
0 5 10 15 20 25 30 35
Nuumber of providers
Figure 32: Top priorities in order of importance (maximum 5) 2019
The Independent Higher Education Survey 2019 35You can also read


