The Kumon Method: Its Importance in the Improvement on the Teaching and Learning of Mathematics from the First Levels of Early Childhood and ...
←
→
Page content transcription
If your browser does not render page correctly, please read the page content below
mathematics
Article
The Kumon Method: Its Importance in the
Improvement on the Teaching and Learning of
Mathematics from the First Levels of Early Childhood
and Primary Education
L. Orcos 1 , R. M. Hernández-Carrera 1 , M. J. Espigares 1 and Á. Alberto Magreñán 2, *
 1   Department of Curriculum and instruction, Faculty of Education, International, Universidad Internacional
     de La Rioja, 26002 Logroño, Spain; lara.orcos@unir.net (L.O.); rafael.hernandez@unir.net (R.M.H.-C.);
     manueljesus.espigares@unir.net (M.J.E.)
 2   Departamento de Matemáticas y Computación, Universidad de La Rioja, Madre de Dios,
     26004 Logroño (La Rioja), Spain
 *   Correspondence: angel-alberto.magrenan@unirioja.es; Tel.: +34-941-299-465

 Received: 8 November 2018; Accepted: 15 January 2019; Published: 21 January 2019

 Abstract: The present work gathers an educational experience based on the application of the
 personalized Kumon Mathematics Method, carried out in the school year 2015–2016, in which 30,849
 students and 230 teachers from several educational centers throughout Spain have participated.
 We start with a theoretical foundation of the Kumon Method and continue with a description of
 the research methodology used. The empirical analysis carried out has been both in descriptive
 and correlational terms, using Spearman’s Rho statistic, between the levels at which the students of
 the sample have started and the Kumon level reached. The results show that the sooner students
 begin to learn Mathematics with the Kumon Method, the greater the chance of reaching a level of
 knowledge above their school level, which helps us to demonstrate the potential of this method in
 the teaching and learning process of Mathematics in the educational levels of Early Childhood and
 Primary Education.

 Keywords: Kumon Method; personalized education; mathematics learning process; spearman’s rho;
 Early Childhood and Primary Education

1. Introduction
      The learning of Mathematics in the early stages of education has a great influence on the
subsequent progress of the academic life of students, not only in this subject, but also in all others,
mainly due to the perception of achievement that good mathematical academic results will provide.
It is a fact that the more efficient the mathematical learning in these first periods, the greater the
motivation of the student towards the academic world, in general, and towards Mathematics in
particular. It is important to comment on what authors such as [1] point out in reference to the lack
of interest of students to choose scientific and technological degrees, considering it as a factor that
complicates the improvement of the quality of learning in Mathematics. In this sense, it is crucial
to awaken in children, from an early stage, the interest in Science learning, so that they perceive
themselves as competent and efficient in these areas, as Mathematics is the first contact they have
with this field of knowledge. Stoffelsma and Spooren in [1] comment on the connection between good
qualifications in Mathematics at early ages and in other subjects such as Science.
      Equally, the official curriculum of Mathematics does not always fit the learning rhythm of each
child, because sometimes it is above or below their level of competence (knowledge, skills, and

Mathematics 2019, 7, 109; doi:10.3390/math7010109                          www.mdpi.com/journal/mathematics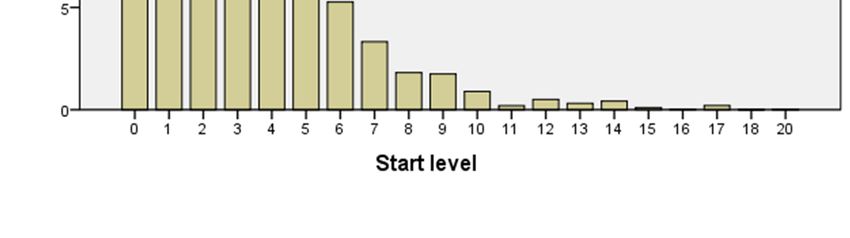
Mathematics 2019, 7, 109                                                                               2 of 17

attitudes). It is at this point where personalized education acquires greater relevance as it will allow
for the adaptation to individuals according to their characteristics. The school also needs to comply
with an official program that, in certain cases, does not give the chance to dedicate enough time to
certain cases of the leaning process that would slow down the pace of the class itself, or to attend to
other students with more capacity.
      That is the reason why personalized education requires methods that allow attending and
adapting learning to the rhythm of each student. It is precisely at this point where the Kumon
Method—which emerged 60 years ago in Japan—is involved, with the aim of answering this question.
This method aims to maximize the learning potential of each child through self-learning, the ability
to concentrate, and the habit of study through a series of personalized activities that are carried out
daily. The personalization of the method allows each student to go at their own pace of learning,
making possible, in some cases, that children are able to study differential and integral calculus in
Primary Education.
      This study aims to demonstrate the influence of the early onset in the Kumon Method and the
subsequent progression of the students along the different levels of mathematical learning, in which
they can be ahead of the course that corresponds to them according their age. This allows self-taught
learning and the development of the full potential of the individual. For this reason, in the realization
of this research, a wide sample of students has been used from educational centers where the Kumon
Method is taught, and the results obtained have been analyzed carefully, studying the starting points
of each student, their ages, as well as their evolution along the different contents and levels of the
method. A series of statistical procedures have been used to confirm, empirically, the influence of an
early start initiation of the Kumon Method and the acquisition of high levels of mathematical skills.

2. Fundamental Principles of Kumon Method
      Kumon is a pedagogic method of Japanese origin whose purpose is to develop the full learning
potential of each individual. To this end, it relies on several aspects, such as self-learning, concentration
ability, habit of study, self-confidence, and academic self-esteem of students. To achieve these goals,
Kumon uses several programs, such as the Mathematics one which was the first created, and on which
this research is based on, followed by Reading and English as a foreign language program. The method
aims to discover the potential of learning in students by providing them with the possibility of
developing self-taught learning in these disciplines.
      There is extensive scientific literature and research about the Kumon Method that covers a broad
spectrum within the educational field in which we can find, from research on students with specific
needs, to studies that apply it in areas of social exclusion.
      Then, we present some studies based on this method that give more support to our research and
to the concepts about it that we will present later.
      One of the most consulted works in relation to the Kumon Method is the one of Ukai in [2], which
details a complete approach to the method, from its origins in Japan to its subsequent international
expansion across the United States and other parts of the world.
      Regarding autonomous work, the ability to concentrate, and the agility to calculate, Lluch in [3]
carried out an investigation in which the Kumon Method was valued from a socio-educational point
of view. In this work, he concludes that students working with the Kumon Method work in an
autonomous and concentrated way, developing, from the beginning, the capacity and agility in mental
calculation as a consequence, among other factors, of the daily work.
      In addition, related to the ability to concentrate—another of the key points of the Kumon
Method—studies such as Henríquez, Quirós, and Reumay in [4] showed that there are external
agents (given by the medium or the context), and internal (personal reflection), which influence the
student’s attitudes when facing the teaching–learning process of mathematics. Among these, there
would be the human models which are available to him, the proper guides to exercises, and the
knowledge and good use of mental reasoning and operations, among which the abstraction and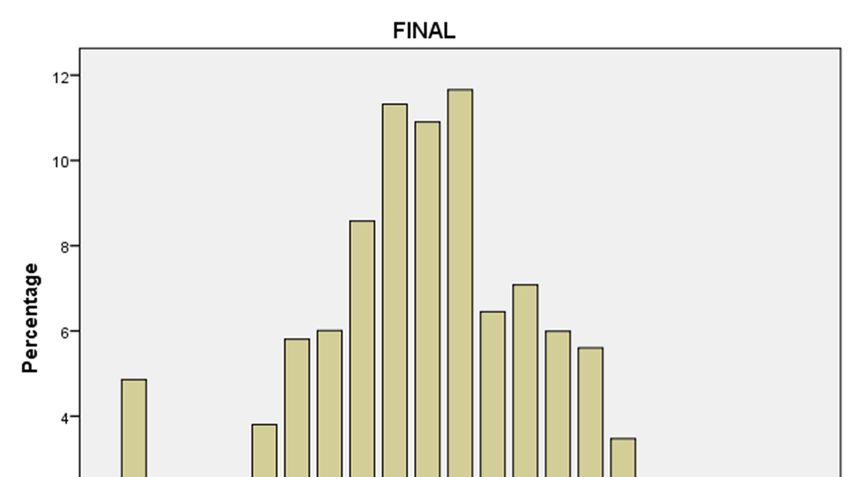
Mathematics 2019, 7, 109                                                                           3 of 17

imagination are highlighted and analyzed. Imaginative capacity is involved in the process, among
other things, such as the capacity for concentration and forming mental pictures that can respond to
the situation. These authors state that not only is it important to train this concentration capacity for
learning mathematics but, also, in doing so, you will have the possibility to develop your creativity
and will be able to abstract problematic situations.
      Concerning another important issue of the Kumon Method, which is the habit of study, several
investigations [5–7] in the field of education, in general, and of mathematics learning, in particular,
indicate the importance of concepts, such as the habit of study, to improve students learning. Hassan,
Sadaf, Aly, and Baig, in [5], insist on this idea.
      Study habits are study practices that include the frequency of studying sittings, rehearsal
of learned material, review of material, studying in favorable surroundings, and self-testing.
The approach of students toward the act of studying are referred to as study attitudes. The learning
behavior of students is the outcome of factors that are complex in nature and comprise of internal and
external factors that play a critical role in education [5].
      However, Luque in [7] then demonstrated that the habits of study influence the academic
performance of students in the mathematical area. In the same way, he also mentions that other
dimensions should be reinforced, such as the study space and environment, study time and planning,
study methods, and study motivation, since he considers his influence on the academic performance
of the students to be significant, see [8].
      Moreover, the concept of self-learning is of great importance in the Kumon Method since the
students learn by themselves from examples that help them to face new exercises and problems.
Research, such as that of Renkl in [9], demonstrates the importance of self-learning as well as
self-explanations that positively influence the improvement of mathematics learning. This author
provides an approach on the significance of self-explanations in mathematics learning from worked-out
examples. Chi et al. in [10] have shown that the extent to which learners profited from the study of
worked-out examples depended on how well they explained the rationale of the presented solutions
to themselves. This was called the “self-explanation effect”.
      By constrast, in relation to the concepts of self-confidence and academic self-esteem, studies such
as Agüero-Calvo, Calderón-Ferrey, Maza-Cascante, and Suárez-Valdés in [11] reveal “the existence of
a significant linear relationship between the level of mathematical self-confidence and self-esteem”.
These authors also consider that low self-esteem can affect academic performance. However, Cruz and
Quiñones in [12] propose to strengthen the students’ self-esteem by pointing out that many educational
intervention proposals plan an improvement of academic performance from the stimulation of
self-esteem through “a complex psychological process that involves perception, image, esteem and
self-concept”.
      According to the learning of mathematics throughout the Kumon Method we highlight the
investigation of Oakley et al. in [8] who conducted a research in Southern Michigan on how to
revitalize mathematics in an inner-urban school district. They showed how “Kumon Mathematics
appears to provide an ideal structured support in mathematics for at-risk children who receive little or
no help at home”.
      Finally, we comment on the study of Thijsse [13] related to the anxiety and achievement in
mathematics, in which it is demonstrated how the Kumon Method contributes to reduce anxiety and
to improve self-confidence. It also shows how students who perform the method improve in aspects
such as the speed of conducting operations and the exam qualifications.
      The results support the hypothesis that a structured teaching method involves a decrease in
mathematics anxiety and an increase in mathematics achievement. Results also show that three
learners increased their achievement on the Kumon achievement test.
Mathematics 2019, 7, 109 4 of 17
2.1. The Origin of Kumon Method
The Kumon Method emerged in 1954 in Osaka, Japan, by the hand of Toru Kumon, a Mathematics
teacher of a High School, who decided to take an active part in his son’s education, when he realized
that he obtained low grades in Mathematics in the second year of Primary Education [14]. Therefore,
the Method emerged as a way of learning at home, since Professor Toru Kumon developed some
materials with a very specific purpose that was to make his son able to do differential and integral
calculus before starting to study Secondary Education, allowing him to learn by himself [15]. The boy
managed to master integrals in the sixth grade of Primary Education when working around 30 min
per day with the method devised by his father. The improvements experienced by Professor Kumon´s
son were not only limited to Mathematics, but also extended to the rest of the subjects. After having
developed the Mathematic method, Toru Kumon elaborated the Reading one since he concluded that
most of the outstanding students would share two qualities: they would read frequently, and they
would have the ability to understand the content of the texts [3].
2.2. Aim and Skills Developed by the Kumon Method
The mission of Kumon Method is as follows: “By discovering the potential of each individual and
developing his or her ability to the maximum, we aim to foster capable people and thus contribute to
the global community” [16]. Therefore, the main objective of the Kumon Method is to maximize the
learning potential of each child. To achieve this, it works with the three aforementioned programs,
through which a series of habits and abilities are acquired that will accompany the individual during
their school and adult life. The habits and capacities on which Kumon relies, to achieve its goal, are:
• Self-learning, the child learns how to learn by himself, without the need of depending of
another person.
• Habit of study, which allows the child to carry out learning tasks without difficulty.
• To foster concentration, if the student is not able to focus on a specific task, it will be difficult for
him to learn effectively.
• Self-confidence that allows him to face any educational challenge.
• Motivation to learn, to perceive learning as something enjoyable that will help him to grow as a
person [17].
The methodological principles of Kumon: objectives, personalization, and self-learning. First of
all, it is important to take into account the idea that Kumon was born as a method of home education
with the purpose of developing the academic ability of the student to become a competent member of
society. Then again, the method aim is that children can be independent in their study, for which it is
intended that they acquire the skills of self-taught learning.
The objectives pursued by the Kumon Method are:
1. To discover the learning potential of children and to develop their full potential offering them an
individualized guidance.
2. To provide as many students as possible the opportunity to learn with the Kumon Method, taking
into account that its dissemination can contribute widely to the society.
3. To help students to become more competent people by developing better guidance materials and
orientation practices through continuous research and thinking process on how they learn with
the Kumon Method.
4. To develop students’ skills and contribute to the future applying of these methodological
principles in other fields apart from education.
5. To achieve a positive cycle in which instructors and support programs members work together to
offer the highest number of children as possible the opportunity to learn with the Kumon Method.
This will result in developing the skills of both instructors and support programs members and,
at the same time, it will allow the study with Kumon to be increasingly accessible [18].Mathematics 2019, 7, 109 5 of 17
To achieve the objectives and skills outlined above, the Kumon Method develops a series of
materials created with the aim of getting the best results in the shortest time possible. Therefore, it
is not intended to perform a review of the official curriculum of the school. In the case of Kumon
Mathematics Method, it contains the essential elements that will allow the student to be able to work
and master the Mathematics of High School level easily, for which it is important to build a strong base
in the previous stages. By contrast, the Kumon Reading Method aims to develop an advanced level of
reading competence. Finally, the Kumon English Method (English as a foreign language) is designed
for students to read original versions of texts in English [19]. All these programs are designed for the
student to achieve the objectives by self-learning, and to progress naturally without over-exerting.
In this sense, one of the keys of the method is the personalization of the teaching–learning process.
For Kumon instructors, to orientate with the method involves adjusting the rhythm of the student’s
progress individually, evaluating the level of mastery of each learning block systematically and
assigning reinforcement in accordance with that evaluation.
Some of the orientation fundamentals of the method consist of the following aspects:
• Self-study of the materials: the instructor does not explain lectures or expository sessions but
encourages the student to find the answers by reading the instructions of the materials carefully,
so he can develop the skills and mentality of self-learning.
• Correction of mistakes: after completing the task, the instructor has to qualify them immediately,
so that the student can correct them quickly while he is still concentrated.
• Daily work: the method is designed for the students to work about 30 min per program per day,
so that instructor will have to customize the task that each child does daily.
• Study in the order of the method: the method is sequenced by levels and each of these levels is
distributed in blocks and booklets that follow a logical order and increase in difficulty, with a
clear and specific objective, so it is not possible to mix the different content blocks arbitrarily.
• Record of daily work: the instructor makes a record and a detailed study of the daily activity of
each child, which will be the empirical material on which he bases the personalized guidance to
each student.
The whole process is based on personalization, and the moment when the student begins with the
Kumon Method is considered crucial. Before having started with the method, the student completes
a diagnostic test to determine the appropriate starting point from which the new knowledge will be
built, based on the student’s prior knowledge. In this sense, the Kumon Method is closely related to
the Theory of Meaningful Learning and the Constructivist Theory, as it is based on the meaningful
learning rather than rote. Fuller, in [20], comments that “the demand for meaningful learning instead
of rote memorization, stems from the premises that Mathematics are too complex to be taught by rote”.
As David said in [21], students constantly “invent” new algorithms anyway. Their discoveries race
ahead of the standard algorithms of adults, giving meaning from the child’s conceptual scheme—how
learning is really consolidated. However, the Constructivist Theory is related to learning by discovery
and the Zone of Proximal Development stated by Vygotsky in [22], among other concepts.
All of them are concepts intimately related to the Kumon Method and the role of the instructors
as elements that enable this type of learning. Learning by discovery has a long and complex history
in education (Dewey in [23] and Bruner in [24]). Although it reached its apogee as a pedagogical
framework in the sixties, the generality of the term allows its application to any learning environment
in which the student participates actively in solving problems (Bruner, 1961), building his own learning.
At its original formulation, learning by discovery focused on the learning process, with the aim of
developing inquiry skills in the domain of a content, considering inquiry as a way to address the issues
(Duffy and Cunningham in [25]).
Vygotsky, in [22], presented the Zone of Proximal Development (Zo-ped) as “the distance between
the actual developmental level of a child as determined by independent problem solving and the
level of potential development as determined through problem solving under adult guidance or inMathematics 2019, 7, 109 6 of 17
collaboration with more capable peers”. In other words, it is the form of joint cognition posed by the
Constructivist Theory where the counsellor-tutor provides support or scaffolding for the child until he
is able to appropriate knowledge for his own use. Progressively, the support of the counsellor will be
withdrawn until the student is able to face the resolution of new problems by himself.
In this way, Kumon instructors constantly value the learning situation of their students having,
as a reference, whether they are at their ideal point of study or not. Thus, observing the students
completing the material, the instructors can describe concretely what the student is able to do with
respect to his ideal point of understanding (what is the student able to do without help?), with respect
to his ideal point of ability to study (is he able to solve the material within the standard time? How
many sheets of the booklets is he able to do?) and with respect to his ideal point of attitude toward
the study (how does he study the material? Does he read the headings? Does he stop to study the
examples? Does he check the clues printed on the material?). In relation to the criterion from which
the student can advance within the different levels of the method, it is important to mention that there
is no single quantitative criterion. It is based on a compendium of decisions resulting from qualitative
observation, bearing in mind how the student solves the material, and a series of quantitative criteria
among which it is the “standard complexion time” (which is particular for each level and for each
group of activities within each of these levels) and the number of errors committed by the student.
These two criteria give very valuable information regarding the precision in the execution of the
exercises, but they do not make sense without the teacher’s observation and guidance. In addition,
in Kumon, there are no lectures or theoretical explanations of the teacher; it is the material itself that,
through examples, allows the student to discover the theory by himself. In some sheets there are brief
explanatory theoretical notes to promote student´s learning discovery.
2.3. Kumon Mathematics Contents
Kumon Mathematics is composed by 21 levels (6A, 5A, 4A, 3A, 2A, A, B, C, D, E, F, G, H, I, J, K, L,
M, N, O, X), among which, the following contents are addressed:
• Counting, writing, and number sequencing (levels 6A, 5A, 4A)
• Addition and subtraction (levels 3A, 2A, A, B)
• Multiplication and division (levels C, D)
• Fractions and decimals (levels D, E, F)
• Order of operations (level F)
• Positive and negative numbers (level G)
• Solving equations (levels G, H)
• Graphs (loves H, I, L, M)
• Algebra, from elementary to advanced (algebraic expressions, linear equations, inequalities,
functions, quadratic equations) (levels J, K, L)
• Trigonometry and logarithms (levels M, N)
• Calculus (level O)
• Probability and statistics (level X)
As it can be seen, the first levels of the method are dedicated to the learning of writing numbers.
Also, the Kumon Method dedicates an important part of its levels to problem reading and problem
solving, a crucial issue also in the learning of Mathematics, as some authors argue: “Writing is
recognized as a critical skill in science, technology, engineering, and mathematical fields, as it provides
opportunities for individuals to think critically about learned information, to integrate knowledge, to
communicate understanding, and to contribute new information to the field [26].Mathematics 2019, 7, 109 7 of 17
2.4. Self-Learning as a Great Goal
Taking into account that the aim of Kumon Method is the development of students’ potential,
self-learning is considered as the way to achieve this goal. In the words of Vygotsky, the learning
potential would be “the set of tasks that each person does not yet perform on his own, but that he
can achieve with adequate support from the environment (level of potential development)” [15].
By contrast, self-learning would be the “ability of a subject to define himself, being the person who
educates and is educated” [27]. In this sense, this author states that learning how to learn does not
only refer to the ability to seek information and to appropriate it, but it also involves learning how to
discriminate the information and, therefore, to analyze what is being learned and to seek the link or
confrontation with what has already been acquired [28]. Therefore, Kumon suggests that this potential
development is achieved in a self-taught way, with the instructors and the material itself standing
at the level of potential development mentioned by Vygotsky. As we see, the concept of potential
development has great weight in the Kumon Method, and it will be obtained through the mediation of
the didactic material itself and the guidelines given by the instructors.
In that sense, the quality of mediation is decisive. Therefore, Vygotsky commented that it is
necessary to differentiate what is the Real Evolutionary Level, understood as the state of development
in the cognitive level of the child achieved through maturation and manifested with the activities that
can develop on its own, with the Evolutionary Potential Level, which is what the person can achieve
thanks to the intervention of the mediator [29].
This is the vision that arises from the Kumon Method when it is presented the concept of
developing the potential of each individual: to achieve the reach of higher goals, through the mediation
of materials and guidance of the instructors, that help the student to contribute to society.
3. Methodology
3.1. Hypothesis and Objective
The main hypothesis of this study is “using the Kumon Mathematics Method the students of
the sample will increase the possibility of obtaining a significant improvement in the learning of the
Mathematics contents established by the method”. From this premise, we will be able to deduce the
suitability of the Kumon Mathematics Method for the learning of Mathematics since childhood. For this
reason, the objective of the study is to demonstrate, empirically and through different techniques of
statistical analysis, that the students of the sample will improve their academic results in Mathematics.
3.2. Sample
Regarding the sample data, the study is based on the detailed information of the process and
learning results corresponding to the academic year 2015–2016. The students and the instructors who
have participated in the study are of several educational centers that cover the entire Spanish national
territory in which the Kumon Method is performed.
The sample formed by all the students who attend the mathematics program of the Kumon
Method is homogeneous and representative. The students come from different socioeconomic and
cultural levels.
The sample s consisted of 30,849 students from the First Elementary Education grade to the
last level of High School Education. The data has been collected by 230 teachers specialized in
mathematics didactics, through monthly reports in which the learning and the evaluation of the
students was provided.
The study has been carried out for 9 months and the data collected has been:
• The Kumon level of students at the beginning, before having taken part in the Method.
• The Kumon level at the end of each month. It is important to mention that in order to evaluate
the potential of the method, we have just taken data corresponding to the last month.Mathematics 2019, 7, 109 8 of 17
• The level at 6 months, 2 years, or 3 years, in which they are above the level they should have
according to the course in which they are.
3.3. Research Design and Phases of the Study
A descriptive and correlational analysis of the data obtained has been carried out, and the
methodology used in this study is quantitative, since it is based on the analysis of quantifiable data
according to the levels obtained after the development of the experiment. We have named the levels
from level 6A as 0 to Level X as 20, in order to show the graphics and the tables in a more compact way.
The research process has been the analysis of variables through descriptive and correlative
statistical techniques (which will be detailed in the data analysis section).
3.4. Information Collection Tools
With regard to data collection, it has been taken into account the considerations of [15], done
through monthly reports sent by each Kumon Center to the Kumon head office. This consists of an
Excel table, made from the information of the sheets, containing the following data: month of the
report, name of the center, student identification, date of birth of the student, date of enrolment in
the Kumon Method, starting level at the beginning of the Kumon Method, level at the beginning of
the current month, level at the end of the current month, number of pages completed during current
month, and situation with respect to the school level (below or advanced, 6 months, 2 years, or 3 years).
Therefore, data have been collected monthly for each student and each center through
these reports.
3.5. Data Analysis
As can be seen in [30], the use of techniques and instruments is very important for the analysis
of data in education, either in the classroom or in any other context. Before the analysis, both the
limitations and the technical possibilities of the instruments used (sheets, s) were assessed, considering
their quality and suitability.
In this study, the registry of the data has been carried out through the construction of a matrix, with
one of the most used and known in social research programs, Statistical Package for Social Sciences [31].
The data analyzed includes all the students of the Kumon Method and all the information regarding
their process of evolution and learning of Mathematics throughout the academic year 2015–2016.
Due to the huge amount of data, selection of the start level, the final level, and the level above the
one that corresponds to these was required, due to the use of school grade as an analytical variable
for study.
Kumon has a nomenclature that establishes three categories, called asterisk level, that alludes to
the fact that the student can be six months, and two years or three years above the school level that
corresponds to the student. It is a quality criterion established by Kumon Centers around the world,
and which is included in the reports of the students that teachers send periodically.
The asterisk level can be as follows:
• No asterisk or level 0 means same level as the one of the school grade in which they are.
• One asterisk or level 1 means 6 months above the school grade level.
• Two asterisks or level 2 means 2 years above the school grade level.
• Three asterisks or level 3 means 3 years above the school grade level.
To simplify the analysis of this work, due to the huge amount of data, only the date related to
the end of the year has been taken, that is, after nine months, leaving the temporary analysis during
each month.
In a second phase, we proceed to the descriptive analysis of data and the analysis of correlations
of pairs of variables (2-tailed analysis) that connects the levels of learning prior to the application ofMathematics 2019, 7, 109 9 of 17
the Kumon Method, and the levels subsequent to the application of the method for the learning of
mathematics. These are:
The correlation between the start and the final levels.
• The correlation between the start level and the level above the one that corresponds to them due
to their school grade, 6 months, 1 year, or 2 years.
• The correlation between the final level and the level above the one that corresponds to them due
to their school grade, 6 months, 1 year, or 2 years.
For this aim, it has been necessary to codify the Kumon levels (from 6A to X) into ordinal
quantitative variables (0–18). Due to the nature of the variables, which are not continuous,
the correlation statistic, under non-parametric assumptions, has been Rho of Spearman as correlation
coefficient, and the hypotheses established are as follows:
• H0 , null hypothesis: there are no significant correlations between the variables.
• H1 , alternative hypothesis: there are significant correlations between the variables.
Once the data is analyzed using SPSS, if the level of significance obtained is lower than 0.05
(2-tailed), we can reject the null hypothesis and conclude that there are significant correlations between
those variables.
4. Results
4.1. Global Descriptive Statistics
First, the global descriptive statistics of the data have been analyzed, in order to have a global
view of the data collected in terms of the central tendency with the mean, median, and mode values for
the three variables in which we are interested: start level (START), asterisk level (ASTERISK), and final
level (FINAL).
Regarding to the start level (START), the results in Table 1 show an average value of 3.28,
that implies that the students are between levels 4A and 3A (writing numbers up to 50, 100, and
120, adding up to +1, +2, and +3) when they start to work with Kumon Mathematics. The average
value indicates that 50% of the students are below the level 4A (in the levels prior to this, the reading
of numbers is worked on, gradually increasing in difficulty until the sequence of numbers reaches
50) and 50% above 3A. Then, again, the mode and the results of the percentage of students in each
start level (START), shown in Figure 1, indicate that the level in which there are more students at the
beginning is 3A (writing numbers up to 100 and 120, adding up to +1, +2, and +3).
Table 1. Global descriptive statistics by start, asterisk, and final levels.
Global Descriptive Statistics. START ASTERISK FINAL
N valid 30,849 30,849 30,849
N lost 0 0 0
Mean 3.28 0.581 8.98
Standard error of the mean 0.015 0.0045 0.023
Median 3.00 0.000 9.00
Mode 4 0 10
In terms of the asterisk level (ASTERISK), Table 1 shows an average value of 0.58, which implies
that, globally, the students are between level 0 and level 1 of asterisk after 9 months of using this
method, that is, almost 6 months above the academic level they should have. Taking these data into
account, as well as the information related to the percentages per asterisk level (ASTERISK), which
appear in Figure 2, 43.2% of students have reached an asterisk level above 0, which is a very positive
result since it means that Kumon Mathematics Method has enhanced more than 40% of the students to
work at a certain level ahead of that corresponding to their actual school year.Mathematics 2019, 7, 109 10 of 17
Mathematics 2018, 6, x 10 of 18
Mathematics 2018, 6, x 11 of 18
Figure 1. Percentage of students in each start level (START).
Figure 1. Percentage of students in each start level (START).
In terms of the asterisk level (ASTERISK), Table 1 shows an average value of 0.58, which implies
that, globally, the students are between level 0 and level 1 of asterisk after 9 months of using this
method, that is, almost 6 months above the academic level they should have. Taking these data into
account, as well as the information related to the percentages per asterisk level (ASTERISK), which
appear in Figure 2, 43.2% of students have reached an asterisk level above 0, which is a very positive
result since it means that Kumon Mathematics Method has enhanced more than 40% of the students
to work at a certain level ahead of that corresponding to their actual school year.
Figure 2. Percentage of students in each asterisk level (ASTERISK).
Figure 2. Percentage of students in each asterisk level (ASTERISK).
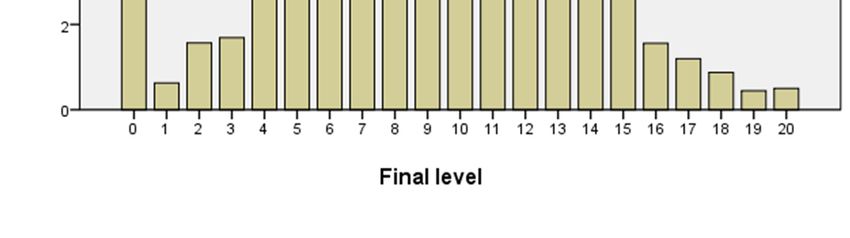
In relation to the final level, the values in Table 1 show an average value of 8.98, that indicates
that the students are in level D (multiplication, division, fractions) are almost reaching Level E
(operations with fractions—addition, subtraction, multiplication, division and mixed numbers—and
decimals). This result is also very important because it means that, after 9 months, students haveMathematics 2019, 7, 109 11 of 17
In relation to the final level, the values in Table 1 show an average value of 8.98, that indicates that
the students are in level D (multiplication, division, fractions) are almost reaching Level E (operations
with fractions—addition, subtraction, multiplication, division and mixed numbers—and decimals).
This result is also very important because it means that, after 9 months, students have managed to
increase their level from 3A to almost E, that is, 6 levels.
Moreover, from data of Table 1 and Figure 3, it can be seen that the three most repeated levels are
D, E, and F (fractions and decimals), with Level F being the most repeated one. Also, from Figure 3,
it can be observed that the distribution of the final level reached by the students is similar to a Gaussian
Mathematics 2018, 6, x 12 of 18
bell curve.
Figure 3. Percentages of students in each final level (FINAL).
4.2. Descriptive Statistics per School
Figure Grade of students in each final level (FINAL).
3. Percentages
Another aim of this work is to carry out a descriptive analysis per school grade, distinguishing
4.2.
them into the Statistics
Descriptive differentper Schoollevels.
asterisk Grade Figure 4 shows the results of the percentages of the levels
reached per academic
Another aim of thisyear.
workTheis tocourse
carry with
out athe highest percentage
descriptive analysis perinschool
level 0grade,
of thedistinguishing
asterisk is the
second
them intocourse of High asterisk
the different School Education
levels. Figure(Bach2), which
4 shows theisresults
understandable because it
of the percentages ofisthethelevels
most
advanced
reached percourse and,year.
academic therefore, there iswith
The course a lower probability
the highest for students
percentage to reach
in level 0 of thea level
asteriskabove the
is the
level that corresponds to them, due to the difficulty of the contents. The
second course of High School Education (Bach2), which is understandable because it is the most level 3 graph shows that
71.4% of students
advanced whotherefore,
course and, have started thereKumon Mathematics
is a lower in the
probability first
for year ofto
students Elementary Education
reach a level (P1)
above the
obtained a 3-year improvement in their school performance (level 3 of asterisk),
level that corresponds to them, due to the difficulty of the contents. The level 3 graph shows that which is also a very
important
71.4% result that
of students whoshows
have that almost
started Kumon3 outMathematics
of every 4 students in P1
in the first reached
year a level 3 years
of Elementary above
Education
the one
(P1) that corresponds
obtained to them according
a 3‐year improvement in their to their performance
school school grade.(level
Moreover, it can be which
3 of asterisk), seen that in the
is also a
first year of Elementary Education (P1), a dichotomy exists between Level 0 and
very important result that shows that almost 3 out of every 4 students in P1 reached a level 3 years Level 3, that means
that there
above is not
the one thatancorresponds
intermediate tovalue. Considering
them according that school
to their more than
grade.71% of the students
Moreover, it can be reach
seenLevel
that
3, the
in it means thatof
first year theElementary
sooner theEducation
students begin(P1), with the method,
a dichotomy the
exists greaterLevel
between is the 0possibility
and Levelto3,reachthat
means that there is not an intermediate value. Considering that more than 71% of the students reach
Level 3, it means that the sooner the students begin with the method, the greater is the possibility to
reach a higher mathematics level. Another important result is observed from the first course of
Primary Education (EPO1) to the third course of Secondary Education (ESO3) that shows that more
than 40% of the students in these levels obtained improvements, highlighted in EPO2, EPO3, andMathematics 2019, 7, 109 12 of 17
a higher mathematics level. Another important result is observed from the first course of Primary
Education (EPO1) to the third course of Secondary Education (ESO3) that shows that more than 40%
of the students in these levels obtained improvements, highlighted in EPO2, EPO3, and EPO4 (second,
third, and fourth courses of Primary Education), in which more than half of the students obtained the
desired improvement.
Mathematics 2018, 6, x 13 of 18
Level 0 Level 1
97.3
100 50 45.4
90 45
80 40
70 35
Percentage
Percentage
60 30
50 25
40 20
30 15
20 10
10 5
0 0
P1
P2
P3
P4
P5
EPO1
EPO2
EPO3
EPO4
EPO5
EPO6
BACH1
BACH2
ESO1
ESO2
ESO3
ESO4
EPO1
EPO2
EPO3
EPO4
EPO5
EPO6
P1
P2
P3
P4
P5
BACH1
BACH2
ESO1
ESO2
ESO3
ESO4
Grade Grade
Level 2 Level 3
14 80 71.4
11.6
12 70
60
10
Percentage
50
Percentaje
8
40
6
30
4
20
2 10
0 0
EPO1
EPO2
EPO3
EPO4
EPO5
EPO6
P1
P2
P3
P4
P5
BACH1
BACH2
ESO1
ESO2
ESO3
ESO4
EPO1
EPO2
EPO3
EPO4
EPO5
EPO6
BACH1
BACH2
ESO1
ESO2
ESO3
ESO4
P1
P2
P3
P4
P5
Grade Grade
Figure
Figure 4. Percentage
4. Percentage of of students
students inin eachschool
each schoolgrade
gradeper
perasterisk
asterisk level.
level.
4.3. 4.3.
Global Correlations
Global Correlations
As mentioned
As mentioned before,
before, when
when dealing
dealing with
with ordinalvariables,
ordinal variables,ititisisrequired
required toto make use
use ofofthe
theRho
Rho
of Spearman
of Spearman correlation
correlation coefficient,
coefficient, in in order
order toto proveour
prove ouralternative
alternativehypothesis,
hypothesis, which
which isisconsidered
considered
as follows:
as follows:
H1 , H 1, alternative hypothesis: there are significant correlations between the variables
alternative hypothesis: there are significant correlations between the variables
FirstFirst of all,
of all, we wecancan deduce,
deduce, from
from thethe first
first lineininTable
line Table2,2,that
thatthe
thecorrelation
correlation coefficient
coefficient between
between
the start level in Kumon (START) and the level of improvement obtained (ASTERISK) which,as
the start level in Kumon (START) and the level of improvement obtained (ASTERISK) which, assaid
said
before, was the most important correlation we wanted to demonstrate, is significant and negative
before, was the most important correlation we wanted to demonstrate, is significant and negative
(−0.258), so both variables are inversely related, which means that the lower the starting level in
(−0.258), so both variables are inversely related, which means that the lower the starting level in
Kumon, the higher the level of improvement obtained. Therefore, the sooner the students start in
Kumon, the higher the level of improvement obtained. Therefore, the sooner the students start in
Kumon, the better the results that they will have in the future. Although the coefficient is lower than
Kumon, the better the results that they will have in the future. Although the coefficient is lower than
0.3, in absolute value, and the fact that the relation between those variables is low, we wanted to find
0.3, in absolute value, and the fact that the relation between those variables is low, we wanted to find
out whether the relation exists, which has now been demonstrated.
out whetherNow, the
if relation exists,
we observe thewhich
secondhas linenow been 2,
of Table demonstrated.
it is clear that a correlation exists between the
Now, if we observe the second line
starting Kumon level (START) and final Kumon level of Table 2, it (FINAL),
is clear that
which a correlation exists and
is also significant between the
positive
starting Kumon
(0.133), so both level (START)
variables are and finalrelated,
directly Kumon levelmeans
which (FINAL), which
that the is also
higher significant
the starting leveland positive
in Kumon,
the higher the level they finally reach. These data seem to be opposite to that obtained in the previous
point, however, it is necessary to clarify that the level they reach in Kumon (FINAL) and the level of
improvement (ASTERISK) are not comparable magnitudes, since one measures the level of Kumon
that they reach, and the other the level of improvement with respect to the level that they should have
if they did not follow the Kumon methodology. Again, the coefficient is low but the relation betweenMathematics 2019, 7, 109 13 of 17
(0.133), so both variables are directly related, which means that the higher the starting level in Kumon,
the higher the level they finally reach. These data seem to be opposite to that obtained in the previous
point, however, it is necessary to clarify that the level they reach in Kumon (FINAL) and the level of
improvement (ASTERISK) are not comparable magnitudes, since one measures the level of Kumon
that they reach, and the other the level of improvement with respect to the level that they should have
if they did not follow the Kumon methodology. Again, the coefficient is low but the relation between
the variables exists.
Finally, again from the study, the correlation between the final Kumon level (FINAL) and the
level of improvement obtained (ASTERISK) was significant and positive (0.421), so both variables are
directly related, which means that the higher the level they reach in Kumon (FINAL), the higher the
level of improvement with respect to the level they would obtain if they did not follow the Kumon
methodology (ASTERISK). This fact seems clear, but we also needed to show it.
After carrying out this study, we can conclude that the alternative hypothesis was proven since
we have seen that there exist correlations between the 3 variables.
Table 2. Global correlations between variables.
Variables Correlation Coefficient (Rho Of Spearman) Significance Level (2-Tailed)
START-ASTERISK −0.258 0.000
START-FINAL 0.133 0.000
ASTERISK-FINAL 0.421 0.000
4.4. Correlation per School Grade
Another are of interest for us was to find the relations between the variables distinguishing the
school grade so, according to data in Table 3, the correlations per school grade are different, both in
significance and in value. On the one hand, it is observed that the significant values obtained are
lower than 0.05, which allows us to reject the null hypothesis and conclude that there are significant
correlations, which was set as the alternative hypothesis. Taking this fact into account, we can conclude,
from data in Table 3 and Figure 5, that there is a significant correlation between the start Kumon level
(START) and the level of improvement obtained (ASTERISK), which is present from the fourth course
of Elementary Education (P4) to the fourth course of Secondary Education (ESO4) and in the last
grade of High School Education (BACH2). Then, it is observed that from the first course of Primary
Education (EPO1) to the fourth course of secondary Education (ESO4), the correlation is negative,
having its highest value in the fourth course of Primary Education (EPO4). The negative correlation
led us to conclude that the lower the Kumon level in which students start, the higher the level of
improvement obtained.
According to the correlation between the final Kumon level (FINAL) and the level of improvement
obtained (ASTERISK), (this data can be seen in both Table 3 and Figure 6) we can state that there is a
significant correlation between them from the third course of Elementary Education (P3) to the first
course of High School Education (BACH1). Next, it is observed how, from the first course of Primary
Education (EPO1) to the first course of High School Education (BACH1), the correlation is negative,
having its highest value also in the fourth course of Primary Education (EPO4). The fact of having the
negative correlation implies that the lower the final Kumon level the students start in, the higher the
level of improvement they will obtain, so, in the light of the results obtained, we can state that from
the first course of Primary Education (EPO1) to the first course of High School Education (BACH1),
it is better to begin as soon as possible with the Kumon Method.Mathematics 2019, 7, 109 14 of 17
Table 3. Correlations between variables per school grade.
Sign Sign Sign
Grade Start-Asterisk Asterisk-Final Start-Final
(2-Tailed) (2-Tailed) (2-Tailed)
P1 −0.4 0.374 0.083 0.860 0.746 0.054
P2 0.107 0.319 0.174 0.104 0.569 0.000
P3 0.004 0.942 0.089 0.086 0.577 0.000
P4 2018, 6, x
Mathematics 0.166 0.000 0.231 0.000 0.749 0.000
15 of 18
P5 0.091 0.000 0.139 0.000 0.791 0.000
EPO1 −0.135 0.000 −0.102 0.000 0.836 0.000
EPO2 −0.269 0.000 −0.235 0.000 0.847 0.000
Correlations Start‐Asterisk
EPO3 −0.314 0.000 −0.296 0.000 0.841 0.000
EPO4 −0.398 0.3 0.000 −0.377 0.000 0.865 0.000
EPO5 −0.349 0.2
0.000 −0.352 0.000 0.861 0.000
EPO6 −0.32 0.000 −0.309 0.000 0.88 0.000
Correlation coefficient
ESO1 −0.345 0.1 0.000 −0.337 0.000 0.868 0.000
ESO2 −0.249 0 0.000 −0.284 0.000 0.857 0.000
ESO3 −0.162 ‐0.1 0.000 −0.215 0.000 0.839 0.000
ESO4 −0.088 0.012 −0.211 0.000 0.637 0.000
BACH1 −0.049 ‐0.2 0.308 −0.134 0.006 0.657 0.000
BACH2 0.172 ‐0.3 0.019 −0.106 0.151 0.277 0.000
BEYOND - ‐0.4 - - - −0.024 0.553
Mathematics 2018, 6, x 15 of 18
‐0.5
Grade
Correlations Start‐Asterisk
0.35. Start level–asterisk level correlation per school grade.
Figure
0.2
According to the correlation between the final Kumon level (FINAL) and the level of
Correlation coefficient
0.1
improvement obtained (ASTERISK),
0 (this data can be seen in both Table 3 and Figure 6) we can state
that there is a significant correlation between them from the third course of Elementary Education
‐0.1
(P3) to the first course of High School Education (BACH1). Next, it is observed how, from the first
‐0.2
course of Primary Education (EPO1) to the first course of High School Education (BACH1), the
‐0.3
correlation is negative, having its highest value also in the fourth course of Primary Education
‐0.4
(EPO4). The fact of having the negative correlation implies that the lower the final Kumon level the
‐0.5the level of improvement they will obtain, so, in the light of the results
students start in, the higher Grade
obtained, we can state that from the first course of Primary Education (EPO1) to the first course of
High School Education (BACH1), it is better to begin as soon as possible with the Kumon Method.
Start level–asterisk
Figure 5. Start level–asterisk level correlation per school grade.
According to the correlation between the final Kumon level (FINAL) and the level of
Correlations Asterisk‐ Final
improvement obtained (ASTERISK), (this data can be seen in both Table 3 and Figure 6) we can state
0.4correlation between them from the third course of Elementary Education
that there is a significant
Correlation coefficient
(P3) to the first course of
0.2High School Education (BACH1). Next, it is observed how, from the first
course of Primary Education (EPO1) to the first course of High School Education (BACH1), the
0
correlation is negative, having its highest value also in the fourth course of Primary Education
‐0.2 the negative correlation implies that the lower the final Kumon level the
(EPO4). The fact of having
students start in, the higher
‐0.4 the level of improvement they will obtain, so, in the light of the results
obtained, we can state that from the first course of Primary Education (EPO1) to the first course of
‐0.6
High School Education (BACH1), it is better to beginGrade
as soon as possible with the Kumon Method.
Figure 6. Correlation between the asterisk level and the final level per school grade.
Figure 6. Correlation between the asteriskAsterisk‐
Correlations level andFinal
the final level per school grade.
Finally, the last study
0.4 we wanted to perform was to find the relation between the starting Kumon
Finally, the last study we wanted to perform was to find the relation between the starting Kumon
level and the final Kumon level obtained by students. It is easy to see (in Table 3 and in Figure 7),
Correlation coefficient
level and the final Kumon 0.2 level obtained by students. It is easy to see (in Table 3 and in Figure 7), that
the correlations between0the initial Kumon level (START) and the final Kumon level (FINAL) are
significant and are present from the second course of Elementary Education (P2) to the last course of
‐0.2
the High School Education (BACH2). We see how the values of the correlations are positive and very
high, therefore, the data show that the final level they reach is related to the initial one they have.
‐0.4Mathematics 2019, 7, 109 15 of 17
that the correlations between the initial Kumon level (START) and the final Kumon level (FINAL) are
significant and are present from the second course of Elementary Education (P2) to the last course of
the High School Education (BACH2). We see how the values of the correlations are positive and very
Mathematics
high, 2018, 6,the
therefore, x data show that the final level they reach is related to the initial one they have.
16 of 18
Correlations Start‐Final
1
0.9
0.8
Correlation coefficient
0.7
0.6
0.5
0.4
0.3
0.2
0.1
0
Grade
Figure 7.
Figure Correlation between
7. Correlation between the
the start
start level
level and
and the
the final
final level
level per
per school
school grade.
grade.
5. Conclusions
5. Conclusions
In conclusion, it can be said that the objective stated in the work, according to which it was
In conclusion, it can be said that the objective stated in the work, according to which it was
intended to demonstrate, empirically, that the students of the study sample have improved their
intended to demonstrate, empirically, that the students of the study sample have improved their
learning with the Kumon Method, has been fulfilled.
learning with the Kumon Method, has been fulfilled.
In global terms, the results show that after nine months of application of the Kumon Method, 43.2%
In global terms, the results show that after nine months of application of the Kumon Method,
of the students are 6 months above their school level, having advanced 6 Kumon levels. In relation to
43.2% of the students are 6 months above their school level, having advanced 6 Kumon levels. In
the results by academic year, it should be mentioned that 71.4% of the students who have started in the
relation to the results by academic year, it should be mentioned that 71.4% of the students who have
first year of Elementary Education have reached 3 years above the level they should have according to
started in the first year of Elementary Education have reached 3 years above the level they should
their course.
have according to their course.
By contrast, the correlation data, both the global results and the results per academic year, give
By contrast, the correlation data, both the global results and the results per academic year, give
us the information that there is a significant and negative correlation between the level at which the
us the information that there is a significant and negative correlation between the level at which the
students started and the level they reached after the nine months the experience has lasts. For this
students started and the level they reached after the nine months the experience has lasts. For this
reason, it can be said that the learning of mathematics, with the Kumon Method, improves as soon as
reason, it can be said that the learning of mathematics, with the Kumon Method, improves as soon as
we begin to use this method. This information is evident through the use of the method itself and the
we begin to use this method. This information is evident through the use of the method itself and the
analyses, as well as the assessment made of it.
analyses, as well as the assessment made of it.
The number of students and the information analyzed gives validity and reliability to the research
The number of students and the information analyzed gives validity and reliability to the
as it has been proven throughout the work. The information gathered is extensive and reflects the fact
research as it has been proven throughout the work. The information gathered is extensive and
that the study of mathematics through the Kumon Method fosters mathematical learning of a high
reflects the fact that the study of mathematics through the Kumon Method fosters mathematical
quality, notably improving the academic results of students.
learning of a high quality, notably improving the academic results of students.
Although we do not add results in this paper, it has been possible to probe the goals established by
Although we do not add results in this paper, it has been possible to probe the goals established
the Kumon Method, such as self-learning, self-confidence, motivation, habit of study, and concentration.
by the Kumon Method, such as self‐learning, self‐confidence, motivation, habit of study, and
Moreover, some of the objectives of the method have also been corroborated, due to the fact that it
concentration. Moreover, some of the objectives of the method have also been corroborated, due to
has been possible to discover the learning potential of each student of the sample, which has been so
the fact that it has been possible to discover the learning potential of each student of the sample,
large, with this fact also allowing us to cover the objective of the Kumon Method “to provide as many
which has been so large, with this fact also allowing us to cover the objective of the Kumon Method
students as possible the opportunity to learn with the Kumon Method, taking into account that its
“to provide as many students as possible the opportunity to learn with the Kumon Method, taking
dissemination can contribute widely to the society”.
into account that its dissemination can contribute widely to the society”.
All of this makes the study of Mathematics through this method highly recommended for the
students and that the sooner it is applied and monitored, the better the results are obtained.
In short, the suitability, effectiveness, and efficiency of the method for learning Kumon
Mathematics is objectively reflected in scientific evidence.You can also read