Metabolic Profiling of Nine Mentha Species and Prediction of Their Antioxidant Properties Using Chemometrics - MDPI
←
→
Page content transcription
If your browser does not render page correctly, please read the page content below
molecules
Article
Metabolic Profiling of Nine Mentha Species and
Prediction of Their Antioxidant Properties
Using Chemometrics
Yun Ji Park 1,† , Seung-A Baek 2,† , Yongsoo Choi 3 , Jae Kwang Kim 2, *         and Sang Un Park 1, *
 1   Department of Crop Science, Chungnam National University, 99 Daehak-ro, Yuseong-gu, Daejeon 34134,
     Korea; yunji0825@hanmail.net
 2   Division of Life Sciences and Convergence Research Center for Insect Vectors, Incheon National University,
     Incheon 22012, Korea; bsa1103@inu.ac.kr
 3   Systems Biotechnology Research Center, Korea Institute of Science and Technology (KIST),
     Gangneung 25451, Korea; yongsoo.choi@kist.re.kr
 *   Correspondence: kjkpj@inu.ac.kr (J.K.K.); supark@cnu.ac.kr (S.U.P.);
     Tel.: +82-32-835-8241 (J.K.K.); +82-42-821-5730 (S.U.P.)
 †   These authors contributed equally to this paper.

 Academic Editor: Benoît Schoefs

 Received: 19 December 2018; Accepted: 8 January 2019; Published: 11 January 2019

 Abstract: Mentha species are well recognized for their medicinal and aromatic properties. The
 comprehensive metabolite profiles of nine Mentha species have been determined. The extracts of these
 Mentha species were also screened for antioxidant and free radical scavenging activities. Forty-seven
 hydrophilic and seventeen lipophilic compounds were identified and quantified from the selected
 Mentha species. Also, eleven phenolic compounds, riboflavin and eight carotenoids were present, and
 their composition and content varied among the various Mentha species. The different Mentha species
 exhibited a range of antioxidant potencies. Horse mint especially exhibited the strongest antioxidant
 capacities (1,1-diphenyl-2-picryl-hydrazyl (DPPH), hydrogen peroxide, and reducing power assay)
 among the nine Mentha species. A difference between different samples from the same species was
 not observed by multivariate analysis. A high correlation between metabolites involved in closely
 linked biosynthetic pathways has been indicated. The projection to latent structure method, using
 the partial least squares (PLS) method, was applied to predict antioxidant capacities based on the
 metabolite profiles of Mentha leaves. According to the PLS analysis, several carotenoid contents, such
 as E-β-carotene, 9Z-β-carotene, 13Z-β-carotene and lutein, as well as phenolic compounds, showed
 a positive relationship in reducing the power of Mentha extracts. Horse mint is a good candidate
 because of its high antioxidant efficacy among the nine Mentha species included in the study.

 Keywords: Mentha; metabolite analysis; multivariate analysis; mint plant; antioxidant activity

1. Introduction
     The genus Mentha (Lamiaceae), which is commonly known as mint, has been recognized for
its medicinal, therapeutic and aromatic properties since ancient times [1]. There are approximately
25–30 species of Mentha [2]. These plants are of great economic importance because the aerial parts
of these plants are used in cooking and in the production of aromatic products, daily items and
pharmaceuticals [3]. Mentha species have antidiarrheal, antimicrobial, antioxidant and anti-inflammatory
properties, in addition to their therapeutic potential in the cardiovascular field of medicine [4].
     Human cells are affected by the reactive oxygen species produced during metabolism under
physiological conditions. Antioxidants neutralize the free radicals, which destroy lipids, proteins, and
nucleic acids. Several human disorders such as atherosclerosis, arthritis, ischemia, gastritis, cancer and

Molecules 2019, 24, 258; doi:10.3390/molecules24020258                        www.mdpi.com/journal/molecules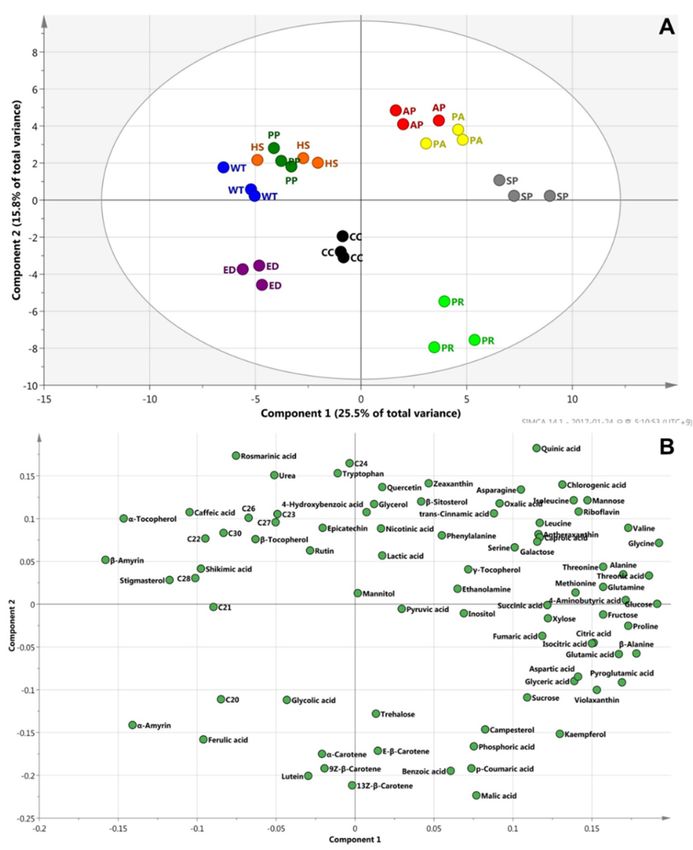
Molecules 2019, 24, 258 2 of 15
Molecules 2019, 24, x FOR PEER REVIEW 2 of 16
many tissueHuman injuries, such
cells are as a central
affected by thenervous
reactive system injury, result
oxygen species produced from the destructive
during metabolismactionunderof free
radicals
physiological conditions. Antioxidants neutralize the free radicals, which destroy lipids, proteins,which
[5]. Non-enzymatic compounds, including ascorbic acid, tocopherol and β-carotene,
inhibit
andthe formation
nucleic acids. of free radicals,
Several human can also be
disorders used
such asas antioxidants. arthritis,
atherosclerosis, Antioxidants,
ischemia,which possess the
gastritis,
ability to prevent
cancer and many damage caused such
tissue injuries, by free
as aradical-induced oxidative
central nervous system injury,stress,
resultare critical
from for the survival
the destructive
action of free
of organisms [6]. radicals [5]. Non-enzymatic compounds, including ascorbic acid, tocopherol and
β-carotene, which inhibit
Plant metabolites, the formation
including of free organic
carbohydrates, radicals, and
can amino
also be acids,
used as antioxidants.
vitamins, hormones,
Antioxidants, which possess the ability to prevent damage caused
flavonoids, phenols and glucosinolates, are fundamental for plant development, stretch by free radical-induced oxidative
adjustment
stress, are critical for the survival of organisms [6].
and protection. Apart from the importance of these compounds for the plant itself, they determine
Plant metabolites, including carbohydrates, organic and amino acids, vitamins, hormones,
the nutrition value, color, taste, smell, antioxidative, anticarcinogenic, antihypertensive, calming,
flavonoids, phenols and glucosinolates, are fundamental for plant development, stretch adjustment
antimicrobial,
and protection. immunostimulating and cholesterol
Apart from the importance lowering properties
of these compounds for the plantofitself,
the they
various plant parts.
determine
A considerable
the nutritionamount of research
value, color, taste, has already
smell, gone intoanticarcinogenic,
antioxidative, the identification, biochemical characterization,
antihypertensive, calming,
localization and health
antimicrobial, benefits of plant
immunostimulating andmetabolites [7]. Making
cholesterol lowering use of the
properties recent
of the variousadvances in metabolite
plant parts. A
profiling will increase our understanding of metabolic systems by
considerable amount of research has already gone into the identification, biochemical recognizing the interrelationships
characterization,
between localization[8].
various metabolites andInhealth
rice, itbenefits of plantusing
was studied metabolites
metabolic[7]. Making
profiling usethat
of the
therecent
flavonoids
had advances
a positivein metabolite
correlation withprofiling will increase
carotenoids our understanding
[9]. Moreover, the carotenoids ofshowed
metabolic systemscorrelation
a positive by
recognizing the interrelationships between various metabolites [8]. In rice,
with glucosinolates in Chinese cabbage [10]. However, there are few studies on the relationship between it was studied using
metabolic profiling that the flavonoids had a positive correlation with carotenoids [9]. Moreover,
metabolites in Mentha species.
the carotenoids showed a positive correlation with glucosinolates in Chinese cabbage [10]. However,
In plants, the building blocks of secondary metabolites are derived from primary metabolism.
there are few studies on the relationship between metabolites in Mentha species.
The objective of the
In plants, thecurrent
building study was
blocks to analyzemetabolites
of secondary 84 metabolites, including
are derived fromthe primary
primary and secondary
metabolism.
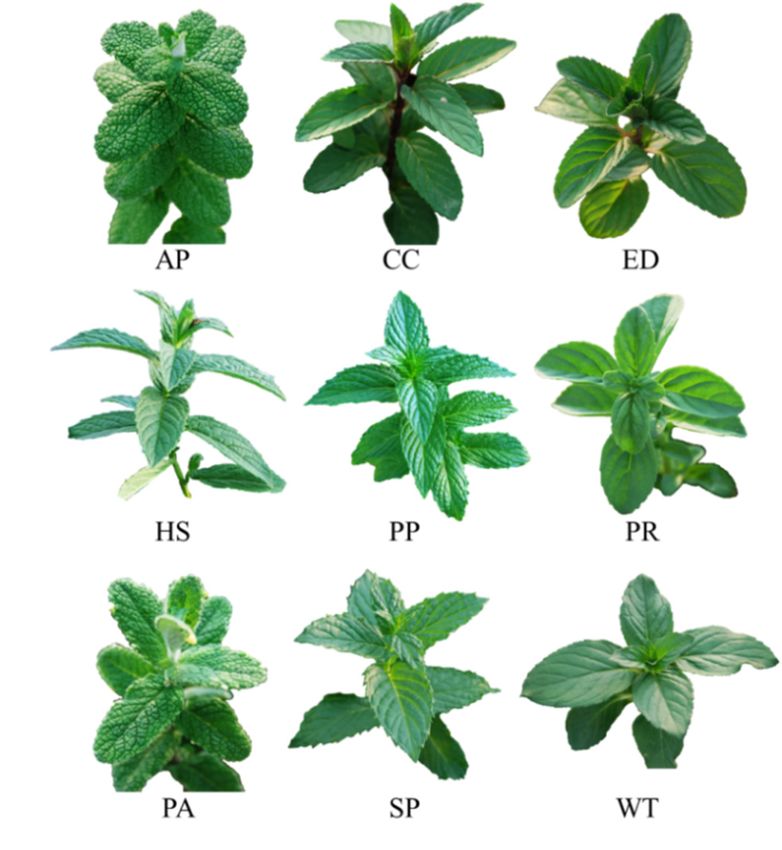
metabolites, nine Mentha species: Peppermint (Mentha × piperita),
The objective of the current study was to analyze 84 metabolites, including the primary and apple
of water mint (M. aquatica),
(M. suaveolens),
mintsecondary spearmint
metabolites, of nine(M. spicata),
Mentha chocolate
species: mint (M.
Peppermint piperita
(Mentha ‘Chocolate’),
× piperita), water pineapple
mint (M. mint
suaveolens
(M. aquatica), ‘Variegata’),
apple mint (M. suaveolens), (M. longifolia),
horse mintspearmint eau de
(M. spicata), cologne
chocolate mint
mint (M.(M. piperita
piperita f. citrata) and
‘Chocolate’),
pineapple
pennyroyal mint(M.
mint (M.pulegium)
suaveolens (Figure
‘Variegata’),
1). Wehorse
havemint (M.
also longifolia),
assessed theeau de cologneactivity
antioxidant mint (M.ofpiperita
the extracts
f. citrata) and pennyroyal mint (M. pulegium) (Figure 1). We have
of these Mentha species and examined the relationship between the metabolite composition and also assessed the antioxidant
activity ofactivity
antioxidant the extracts
using of chemometrics.
these Mentha species and examined the relationship between the metabolite
composition and antioxidant activity using chemometrics.
Figure 1. Nine
Figure Mentha
1. Nine species.
Mentha AP,
species. apple
AP, mint;
apple CC,
mint; CC,chocolate
chocolatemint;
mint;ED,
ED,eau
eau de
de cologne
cologne mint; HS, horse
mint; HS,
mint; PP, peppermint; PR, pennyroyal mint; PA, pineapple mint; SP, spearmint; WT, water
horse mint; PP, peppermint; PR, pennyroyal mint; PA, pineapple mint; SP, spearmint; WT, water mint.
mint.
2. Results
2.1. Metabolic Profiling of Nine Mentha spp. on the Basis of GC-MS Database
Hydrophilic metabolites in the nine Mentha spp. were identified by gas chromatography-mass
spectrometry (GC-MS). Peaks were identified using an in-house library and quantified using the peak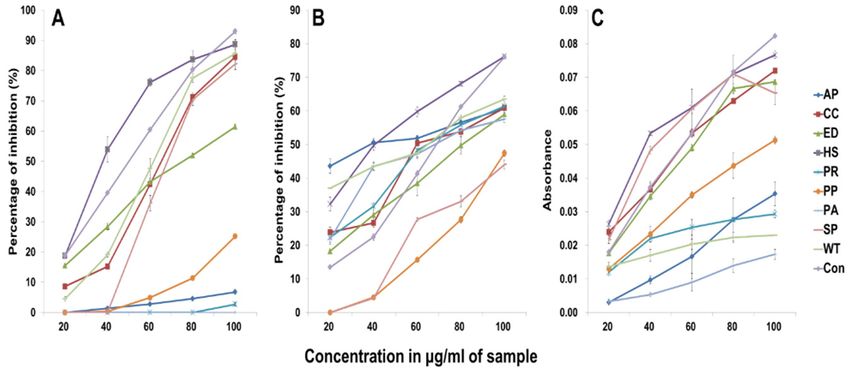
Molecules 2019, 24, 258                                                                              3 of 15

area ratios relative to the internal standard (IS). In total, 47 hydrophilic metabolites, including 18 amino
acids, 18 organic acids, 7 sugars, 3 sugar alcohols and 1 amine were detected (Table S1 and Figure S1).
     Our analysis detected 17 lipophilic metabolites, including 9 policosanols, 3 sterols, 3 tocopherols
and 2 amyrins (Figures S2, S3 and Table S2). C30 (triacontanol, 12.04–90.54 µg/g dry weight
(DW)), β-sitosterol (585.25–986.15 µg/g DW) and α-tocopherol (71.79–141.58 µg/g DW) were the
predominant policosanol, sterol and tocopherol, respectively, in all samples. Water mint had the
highest content of total policosanol (169.97 µg/g DW). The highest content of total sterol, tocopherol
and amyrin was found in apple mint (1234.07 µg/g DW), horse mint (145.87 µg/g DW) and water
mint (402.68 µg/g DW), respectively.

2.2. Secondary Metabolite Profiling in the Nine Mentha spp.
     The composition and content of the phenolic compounds in the nine Mentha species was
determined by high performance liquid chromatography (HPLC) analysis. In total, 11 phenolic
compounds (including rosmarinic acid, chlorogenic acid, caffeic acid, epicatechin, p-coumaric acid,
ferulic acid, benzoic acid, rutin, trans-cinnamic acid, quercetin and kaempferol) were detected
(Table 1 and Figure S4). The amount of each constituent varied between the given Mentha species
studied. Rosmarinic acid constituted the largest component among the 11 phenolic compounds.
The concentration of rosmarinic acid was the highest in peppermint. The rosmarinic acid content
was 16-fold higher in peppermint than that in pennyroyal mint, which contained the lowest level
of the constituent. Most of the hydroxycinnamic acids, such as chlorogenic acid, caffeic acid and
ferulic acid, exhibited similar patterns. However, the level of p-coumaric acid in pennyroyal mint was
approximately 100 times higher than that in others. The highest concentration of benzoic acid was
detected in pennyroyal mint. It was not detected in chocolate mint. The trans-cinnamic acid content
was significant in all the species studied. The highest amounts of trans-cinnamic acid were found in
pineapple mint, peppermint and spearmint. The horse mint predominantly contained rutin. Chocolate
mint, spearmint, apple mint and water mint also had large amounts of rutin. Among the flavonols,
quercetin was predominant in apple mint and peppermint, whereas pennyroyal mint and spearmint
contained high levels of kaempferol. Epicatechin, a flavan-3-ol, was present at similar levels.
     From the time of their discovery, phenolic compounds have been a distinguishable trait of plants.
These compounds are crucial for the organoleptic and nutritive quality of fruits, including the color,
taste, aroma, flavor and astringency [11]. Phenolic compounds have been demonstrated to vary
between cultivars and due to other factors, including the maturity stage and amount of light exposure.
The profiling of phenolic compounds has been a useful parameter to discriminate fruit parts [12].
Interest in polar compounds such as phenolic acids and flavonoids has spiked recently because of their
stability during boiling and storage. Many studies have already isolated and identified a wide range
of phenolic compounds from different Mentha species, including M. spicata, M. aquatica, M. citrate and
others [13]. For instance, the genus Mentha contains caffeic acid derivatives, flavones, flavanones and
their glycosidic forms. Accordingly, rosmarinic acid was indicated as the major component [3]. These
findings are consistent with the results of the present study. Various polypheonols were identified and
quantified in the M. pulegium extracts. However, the content of rosmarinic acid (0.287 mg/g) was lower
than in our findings [14]. Chemical profiling of the Mentha species has also been used as an additional
marker for confirming the parental origin of hybrids of naturally occurring and cultivated species [15].
     Riboflavin was quantitated by HPLC analysis (Figure S5). Table 2 shows the riboflavin content in
the nine different Mentha species. The highest concentration, 25.40 µg/g DW, was found in spearmint.
Pineapple mint and apple mint also contained high levels of riboflavin. Peppermint contained the
lowest amount of riboflavin at 15.96 µg/g DW. The difference in riboflavin content between spearmint
and peppermint was indicated as a 1.59-fold change.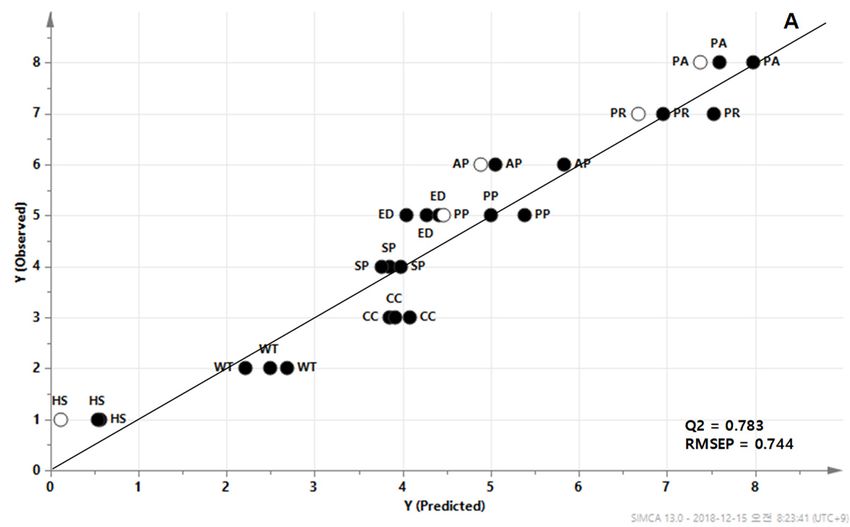
Molecules 2019, 24, 258                                                                                                                                                                                        4 of 15

                                             Table 1. Composition and content of phenolic compounds in different Mentha species (µg/g DW).

    Mentha      Chlorogenic                                         p-Coumaric                                                                trans-Cinnamic                                          Rosmarinic
                                 Caffeic Acid     Epicatechin                       Ferulic Acid      Benzoic Acid             Rutin                              Quercetin        Kaempferol
     spp.         Acid 1                                               Acid                                                                        Acid                                                  Acid
      AP        290.70 ± 64.18   51.65 ± 12.24   131.35 ± 56.70     4.40 ± 0.38      29.55 ± 1.82     109.25 ± 86.71       1920.90 ± 45.16      8.25 ± 0.65    9485.89 ± 224.06    160.35 ± 24.10     27.73 ± 5.61
      CC         168.50 ± 1.96    35.45 ± 2.68   101.70 ± 11.24     6.80 ± 2.05      42.71 ± 7.76          n.d. 2         3470.10 ± 165.59     46.55 ± 6.18      397.10 ± 48.51     14.50 ± 5.38      19.85 ± 3.53
      ED         168.95 ± 0.77    40.85 ± 5.95     86.85 ± 3.13     4.65 ± 0.45      77.65 ± 9.41     210.10 ± 46.39       140.65 ± 17.21      14.66 ± 0.71     558.56 ± 134.59      9.50 ± 0.09      14.94 ± 0.58
      HS         170.90 ± 7.75   58.50 ± 13.39   224.15 ± 44.48     6.15 ± 0.98      38.70 ± 3.74      25.84 ± 3.15      11,659.20 ± 408.36     6.50 ± 2.26    347.25 ± 139.14      14.35 ± 0.62      18.68 ± 2.15
      PP         174.38 ± 6.22   42.10 ± 15.22   232.3 ± 39.64       3.95 ± 1.39     25.90 ± 2.61       8.40 ± 3.00         57.75 ± 14.92     207.20 ± 74.86   5092.24 ± 269.96     65.40 ± 9.83      42.44 ± 3.80
      PR         190.15 ± 6.98   30.60 ± 1.33     108.40 ± 4.31    396.95 ± 82.69    61.20 ± 7.30    2277.19 ± 107.36       70.05 ± 21.27       4.25 ± 0.88     121.54 ± 29.74    749.80 ± 112.07     2.53 ± 0.18
      PA        352.30 ± 11.78    45.65 ± 3.32    95.90 ± 11.78      7.00 ± 1.11     26.05 ± 4.07      28.09 ± 3.86         37.65 ± 5.40      441.15 ± 51.90    177.60 ± 37.87     104.05 ± 9.61      18.89 ± 0.81
      SP         238.90 ± 7.73   40.90 ± 6.81     177.70 ± 2.93     14.55 ± 0.98     27.45 ± 3.13       0.79 ± 0.26       3126.90 ± 127.85    196.80 ± 11.86   1071.10 ± 121.53   259.40 ± 16.29      26.47 ± 2.99
      WT        177.60 ± 11.44    94.55 ± 4.58   103.70 ± 16.63     7.30 ± 2.34     77.90 ± 14.56     152.93 ± 62.03      1059.95 ± 189.02     8.55 ± 2.85        18.00 ± 6.00      10.75 ± 1.50      37.74 ± 2.08
      1The data are presented in this table as mean ± standard deviation of three biological replicates (n = 3). 2 n.d., not detectable. AP, apple mint; CC, chocolate mint; ED, eau de cologne mint;
      HS, horse mint; PP, peppermint; PR, pennyroyal mint; PA, pineapple mint; SP, spearmint; WT, water mint.

                                           Table 2. Composition and content of carotenoids and riboflavin in different Mentha species (µg/g DW).

                                                                                                                        Carotenoids
   Mentha spp.            Riboflavin
                                           Violaxanthin    1      Antheraxanthin            Lutein            Zeaxanthin        13Z-β-Carotene         α-Carotene          E-β-Carotene         9Z-β-Carotene
          AP          23.48 ± 0.04     1    19.64 ± 0.17            3.90 ± 0.04          248.49 ± 0.10       13.25 ± 0.09         40.95 ± 1.88          2.94 ± 0.14        221.65 ± 7.77            33.92 ± 0.73
          CC           20.39 ± 0.47         19.13 ± 0.21            4.23 ± 0.04          314.69 ± 6.84       13.79 ± 0.24         56.17 ± 0.46          3.94 ± 0.04       272.28 ± 15.16            41.80 ± 1.53
          ED           17.67 ± 1.54         16.42 ± 1.03            3.23 ± 0.22         306.35 ± 15.61       11.63 ± 0.22         62.57 ± 3.64          4.64 ± 0.28        267.33 ± 7.50            42.62 ± 1.63
          HS           21.65 ± 2.02         17.61 ± 0.22            4.06 ± 0.09          277.40 ± 3.87       12.57 ± 0.07         54.93 ± 0.24          4.43 ± 0.07        222.53 ± 1.70            37.24 ± 0.95
          PP           15.96 ± 1.14         16.48 ± 0.41            5.78 ± 0.17         241.22 ± 10.60       15.12 ± 0.50         47.30 ± 2.05          4.30 ± 0.12        185.83 ± 7.59            34.80 ± 1.60
          PR           19.20 ± 0.38         21.28 ± 1.30            3.60 ± 0.29         283.43 ± 11.25       9.15 ± 0.13          59.98 ± 2.21          4.68 ± 0.54       239.28 ± 11.99            38.52 ± 3.15
          PA           25.33 ± 0.87         16.51 ± 0.32           5.92 ± 0.11          248.98 ± 4.08        14.00 ± 0.23         40.38 ± 2.13          3.74 ± 0.11       165.30 ± 2.00             31.03 ± 0.34
          SP           25.40 ± 2.13         20.77 ± 0.45           10.14 ± 0.16          269.17 ± 5.42       19.17 ± 0.30         57.43 ± 3.89          4.53 ± 0.22        236.92 ± 9.81            37.64 ± 2.15
          WT           18.25 ± 4.18         15.88 ± 0.16            4.94 ± 0.08         257.31 ± 9.84        15.20 ± 0.32         42.51 ± 0.74          3.97 ± 0.06       171.88 ± 9.86             32.12 ± 1.93
      1 The data are presented in this table as mean ± standard deviation of three biological replicates (n = 3). AP, apple mint; CC, chocolate mint; ED, eau de cologne mint; HS, horse mint; PP,

      peppermint; PR, pennyroyal mint; PA, pineapple mint; SP, spearmint; WT, water mint.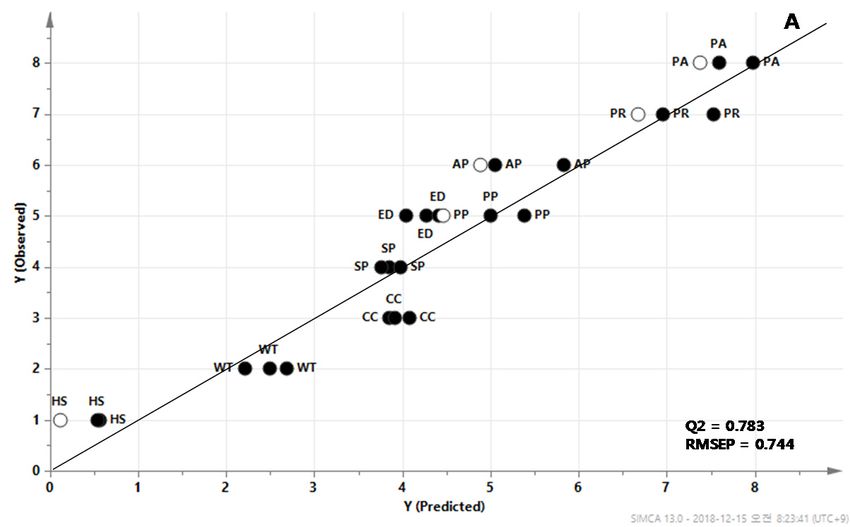
Molecules 2019, 24, 258 5 of 15
Four types of carotenes (α-carotene, E-β-carotene, 9Z-β-carotene and 13Z-β-carotene) and
four types of xanthophylls (antheraxanthin, lutein, violaxanthin and zeaxanthin) were isolated and
Molecules 2019, 24, x FOR
quantified byPEER
HPLCREVIEW
analysis from the Mentha species included in the study (Table 2 and Figure S6). 7 of 16
Of these, lutein and E-β-carotene were the major carotenoids that were present in large quantities.
The reducing
The patternpower of the
of individual nine Mentha
carotenes species
was similar was compared
in all species. Eau de cologneto mint,
that pennyroyal
of ascorbic acid (Figure
mint,
chocolate mint and spearmint all contained large amounts of carotenes, whereas
2C). All the extracts showed good reducing power, as indicated by the absorbance measurements of apple mint, pineapple
mint and water mint contained lower quantities of carotenes. The levels of total xanthophylls and the
the reaction mixtures at the end of the incubation period. The presence of reducing agents causes the
amounts of each of the individual constituents varied among the different Mentha species. Spearmint
conversionhad ofhigher
the Fe 3+/ferricyanide complex used in this method to the ferrous form. The reducing
levels of antheraxanthin than that of other species. The highest zeaxanthin concentration
capacity of an extract may serve
was found in spearmint, as atherelevant
whereas lowest levelindicator of its
was observed in antioxidant
pennyroyal mint.potential. Among the
In contrast,
pennyroyal mint showed the highest concentration of violaxanthin, followed
Mentha species studied, horse mint displayed higher reducing activity, followed by chocolate mint, by spearmint, apple
mint, chocolate mint, horse mint, pineapple mint, peppermint, eau de cologne mint and water mint.
eau de cologne mint, spearmint, peppermint, apple mint, pennyroyal mint, water mint and
The levels of lutein were similar in all the nine Mentha species.
pineapple mint. Carotenoids are natural pigments, usually of yellow, orange or red color, and play crucial roles
An earlier study has photoprotection,
in photosynthesis, shown that extracts of different
development, as stress Mentha
hormonesspecies are good
and as signaling sources
molecules in of natural
plants [16,17]. Moreover, certain carotenoids are known as precursors of vitamin A, great antioxidants
antioxidants but vary in the degree of their antioxidant potential [3]. It has been shown that water
and to be essential for human health [17]. Straumite et al. (2015) [18] have reported that the highest
extract of M. pulegium
contents is comparable
of carotenoids in M. spicatatowere
the observed
synthetic antioxidant,
in the leaf and stem.butylated
In addition,hydroxytoluene
several Mentha (BHT),
and can bevarieties,
considered
includingas aM.suitable
suaveolens,alternative
M. suaveolensfor BHT [19].
‘Variegata’ andNickavar et al. (2010)
M. piperita ‘Bavarian’) havereported
shown that the
significantly
ethanol extract of M.higher concentrations
piperita of carotenoids
has the strongest DPPH [18]. scavenging activity among five Mentha species
(M. piperita,
2.3.M. pulegium,
In Vitro M. rotundifolia,
Antioxidant Assays M. spicata and M. longifolia) [20]. This result is in contrast to
our findings. According to our study, the highest DPPH scavenging activity was detected in horse
1,1-Diphenyl-2-picryl-hydrazyl (DPPH) radical scavenging activity is one of the most efficient
mint, otherwise
methodsknown as M.
for screening longifolia.activity
the antioxidant Manyof studies have
plant extracts. reported
The theanalysis
results of the chemical composition of
of the DPPH
plant extracts and their
free radical antioxidant
scavenging activity.
activity in the various However,
Mentha crudeit is very
extracts complicated
are shown Figure 2A.toTheinterpret
activity the data
of these extracts was concentration dependent and was comparable to that of the
because of differences in methods which are based on different mechanisms used for the evaluation ascorbic acid standard.
Horse mint extract, at a concentration of 100 µL/mL, showed an 88.6% activity compared to the 93.03%
of the antioxidant activity. The results of the antioxidant activity analysis of the same plant can vary
activity of the ascorbic acid standard at a concentration of 100 µL/mL. Horse mint was followed by
significantly depending
water on the
mint, chocolate mint,method
spearmint, used [21].
eau de Therefore,
cologne it is important
mint, peppermint and appleto evaluate
mint. Pennyroyaland compare
the antioxidant
mint andactivities
pineappleof thehad
mint different species,
no antioxidant measured using similar approaches.
activity.
Figure 2. Antioxidant activity of different Mentha extracts. Ascorbic acid was used as the control.
Figure 2. Antioxidant activity of different Mentha extracts. Ascorbic acid was used as the control. (A)
(A) 1,1-diphenyl-2-picryl-hydrazyl (DPPH) assay; (B) hydrogen peroxide assay; (C) reducing power
1,1-diphenyl-2-picryl-hydrazyl (DPPH)mint;
assay. AP, apple mint; CC, chocolate assay; (B)dehydrogen
ED, eau peroxide
cologne mint; HS, horse assay;
mint; PP,(C) reducing power
peppermint;
assay. AP,PR,
apple mint; CC,
pennyroyal mint;chocolate mint;
PA, pineapple mint;ED, eau de cologne
SP, spearmint; mint;
WT, water mint. HS, horse mint; PP, peppermint;
PR, pennyroyal mint; PA, pineapple mint; SP, spearmint; WT, water mint.
2.4. PCA, HCA, and PLS
Principal component analysis (PCA) was used to confirm the differences between samples and
the contribution of the metabolites to clustering. Figure 3 shows that there was no difference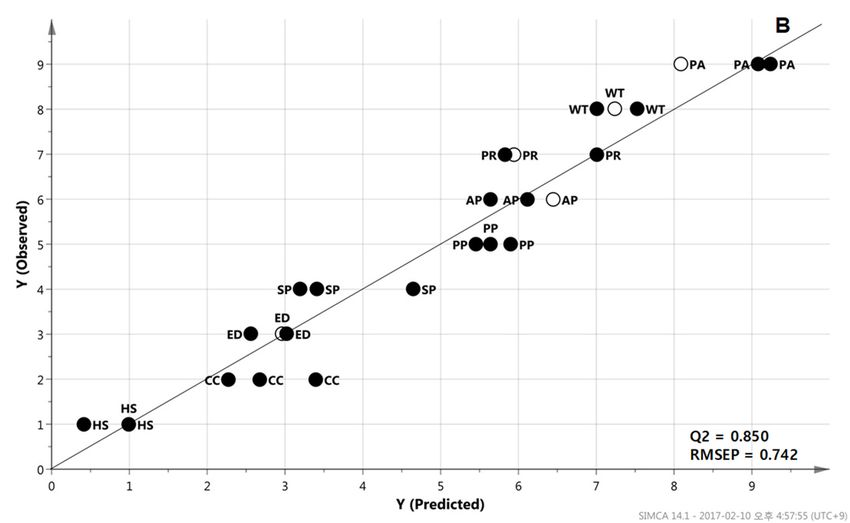
Molecules 2019, 24, 258                                                                               6 of 15

      Additionally, the results for hydrogen peroxide radical scavenging activity are depicted in
Figure 2B. Hydrogen peroxide can easily cross cell membranes. Once inside the cell, H2 O2 can react
with Fe2+ and possibly Cu2+ ions to form hydroxyl radicals, which may be the reason for many of
its toxic effects. The hydrogen peroxide radical scavenging activity was concentration dependent.
It was highest (76.2%) in a 100 µL/mL concentration of horse mint crude ethanol extract, compared
to the 76.1% of 100 µL/mL ascorbic acid. Horse mint was followed by water mint, pennyroyal mint,
chocolate mint, apple mint, eau de cologne mint, pineapple mint and peppermint. Spearmint exhibited
the lowest hydrogen peroxide radical scavenging activity compared to that of the other species.
      The reducing power of the nine Mentha species was compared to that of ascorbic acid (Figure 2C).
All the extracts showed good reducing power, as indicated by the absorbance measurements of the
reaction mixtures at the end of the incubation period. The presence of reducing agents causes the
conversion of the Fe3+ /ferricyanide complex used in this method to the ferrous form. The reducing
capacity of an extract may serve as a relevant indicator of its antioxidant potential. Among the Mentha
species studied, horse mint displayed higher reducing activity, followed by chocolate mint, eau de
cologne mint, spearmint, peppermint, apple mint, pennyroyal mint, water mint and pineapple mint.
      An earlier study has shown that extracts of different Mentha species are good sources of natural
antioxidants but vary in the degree of their antioxidant potential [3]. It has been shown that water
extract of M. pulegium is comparable to the synthetic antioxidant, butylated hydroxytoluene (BHT),
and can be considered as a suitable alternative for BHT [19]. Nickavar et al. (2010) reported that the
ethanol extract of M. piperita has the strongest DPPH scavenging activity among five Mentha species
(M. piperita, M. pulegium, M. rotundifolia, M. spicata and M. longifolia) [20]. This result is in contrast to
our findings. According to our study, the highest DPPH scavenging activity was detected in horse
mint, otherwise known as M. longifolia. Many studies have reported the chemical composition of
plant extracts and their antioxidant activity. However, it is very complicated to interpret the data
because of differences in methods which are based on different mechanisms used for the evaluation
of the antioxidant activity. The results of the antioxidant activity analysis of the same plant can vary
significantly depending on the method used [21]. Therefore, it is important to evaluate and compare
the antioxidant activities of the different species, measured using similar approaches.

2.4. PCA, HCA, and PLS
     Principal component analysis (PCA) was used to confirm the differences between samples and
the contribution of the metabolites to clustering. Figure 3 shows that there was no difference between
different samples from the same species. A large separation among samples indicates a distinct
difference. According to the loading plot, the metabolites responsible for the highest contribution
to the cluster of three species (horse mint, peppermint and water mint) were policosanols. Benzoic
acid, p-coumaric acid and malic acid contributed to the separation of pennyroyal mint from the other
samples. This means that pennyroyal mint has a lot of benzoic acid, p-coumaric acid and malic acid,
compared to that of the other samples.
     Hierarchical clustering analysis (HCA) was performed using Pearson’s correlation and average
linkage to examine relationships between the concentrations of the 84 metabolites. In HCA, when
metabolites are located close to each other, this indicates a high correlation (Figure 4). For example,
isocitric acid, an intermediate in the citric acid cycle, was located next to citric acid (r = 0.9967;
p < 0.0001). Benzoic acid and p-coumaric acid (r = 0.9897; p < 0.0001) are related to salt tolerance in
plants [22]. The carotenoids were also clustered in HCA.
Molecules 2019, 24, 258                                                                              7 of 15
Molecules 2019, 24, x FOR PEER REVIEW                                                                                            8 of 16

     Figure 3. Principal
                 Figure 3. component       analysis
                            Principal component       (PCA)
                                                  analysis      analysis
                                                            (PCA)  analysisof
                                                                            of the  metabolite
                                                                                the metabolite     profiles.
                                                                                               profiles.      (A) plot;
                                                                                                         (A) Score  Score plot; (B)
                 (B) loading plot. AP, apple mint; CC, chocolate mint; ED, eau de cologne mint; HS, horse mint;
     loading plot. AP, apple mint; CC, chocolate mint; ED, eau de cologne mint; HS, horse mint; PP,
                 PP, peppermint; PR, pennyroyal mint; PA, pineapple mint; SP, spearmint; WT, water mint; C20,
     peppermint;eicosanol;
                   PR, pennyroyal         mint;
                            C21, heneicosanol; C22,PA,    pineapple
                                                   docosanol;            mint;C24,
                                                               C23, tricosanol;   SP,   spearmint;
                                                                                    tetracosanol;       WT, water
                                                                                                  C26, hexacosanol; C27,mint; C20,
     eicosanol; C21,  heneicosanol;
                 heptacosanol;           C22, docosanol;
                                C28, octacosanol;               C23, tricosanol; C24, tetracosanol; C26, hexacosanol;
                                                  C30, triacontanol.
     C27, heptacosanol; C28, octacosanol; C30, triacontanol.

      Hierarchical clustering analysis (HCA) was performed using Pearson’s correlation and average
linkage to examine relationships between the concentrations of the 84 metabolites. In HCA, when
metabolites are located close to each other, this indicates a high correlation (Figure 4). For example,
isocitric acid, an intermediate in the citric acid cycle, was located next to citric acid (r = 0.9967; p <
0.0001). Benzoic acid and p-coumaric acid (r = 0.9897; p < 0.0001) are related to salt tolerance in plants
[22]. The carotenoids were also clustered in HCA.
Molecules 2019, 24, 258 8 of 15
Molecules 2019, 24, x FOR PEER REVIEW 9 of 16
Figure 4. Hierarchical
Figure clustering
4. Hierarchical clusteringanalysis
analysis(HCA)
(HCA) of of compound
compounddata data from
from thethe nine
nine Mentha
Mentha spp. spp.
EachEach
square indicates
square thethe
indicates Pearson’s
Pearson’scorrelation
correlation coefficient of aapair
coefficient of pairofofcompounds
compounds andand
the the value
value of the
of the
correlation coefficient
correlation is represented
coefficient is representedbybythe
the intensity ofblue
intensity of blueororred
red colors,
colors, as indicated
as indicated on color
on the the color
scale.scale.
C20,C20, eicosanol;
eicosanol; C21,C21, heneicosanol;C22,
heneicosanol; C22, docosanol;
docosanol; C23,C23,tricosanol; C24,
tricosanol; tetracosanol;
C24, C26, C26,
tetracosanol;
hexacosanol; C27, heptacosanol; C28, octacosanol; C30, triacontanol.
hexacosanol; C27, heptacosanol; C28, octacosanol; C30, triacontanol.
In the partial least squares (PLS) method, the ranking of antioxidant capacity (including DPPH
In the partial least squares (PLS) method, the ranking of antioxidant capacity (including DPPH
free radical scavenging activity and reducing power) and the metabolite quantities were used as
free the
radical scavenging activity and reducing power) and the metabolite quantities were used as the
dependent (y) and independent (x) variables, respectively. The 84 metabolites from the nine
dependent
Mentha (y)spp.and
wereindependent
divided into(x)
22 variables,
training setrespectively.
samples and 5The test84
setmetabolites from5).the
samples (Figure In nine Mentha
the PLS
spp. prediction
were divided intoa 22
model, training set samples
cross-validated and
correlation 5 test set(Q2)
coefficient samples
> 0.5(Figure 5).aIn
indicates the model
good PLS prediction
[23].
model, a cross-validated correlation coefficient (Q2) > 0.5 indicates a good model
In these prediction models, Q2 was 0.78 and the root mean squared error of prediction (RMSEP) was [23]. In these
prediction
0.74. Themodels, Q2important
variables was 0.78 inand
thethe root mean
projection (VIP)squared
indicateerror of prediction
the contribution (RMSEP)
of each was
variable to 0.74.
the projection. Metabolites with a VIP value greater than 1 had a strong impact
The variables important in the projection (VIP) indicate the contribution of each variable to theon the prediction
model [24].
projection. Shikimic acid
Metabolites withwas indicated
a VIP valueto be the most
greater than important contributor
1 had a strong impactto predicting the ranking
on the prediction model
of DPPH free radical scavenging activity and the reducing power of the Mentha species.
[24]. Shikimic acid was indicated to be the most important contributor to predicting the ranking of Additionally,
carotenoids (E-β-carotene, 9Z-β-carotene, 13Z-β-carotene and lutein) as well as phenylpropanoids
DPPH free radical scavenging activity and the reducing power of the Mentha species. Additionally,
(rutin and chlorogenic acid) were important to predicting the reducing power of the samples (Figure 6).
carotenoids (E-β-carotene, 9Z-β-carotene, 13Z-β-carotene and lutein) as well as phenylpropanoids
(rutin and chlorogenic acid) were important to predicting the reducing power of the samples
(Figure 6).Molecules 2019, 24, 258 9 of 15
Molecules 2019, 24, x FOR PEER REVIEW 10 of 16
Molecules 2019, 24, x FOR PEER REVIEW 10 of 16
.
Figure
Figure 5. The
5. The partial
partial least squares
least (PLS) predictivemodels
modelsconstructed
constructed from the nine Mentha spp. asas
Figure 5. The partial leastsquares
squares(PLS)
(PLS) predictive
predictive models constructed from
from thethe nine
nine Mentha
Mentha spp.spp.
as a
a training
a training set (filled circle) for predicting the ranking of DPPH free radical scavenging activity (A)
trainingsetset (filled circle) for
(filled circle) forpredicting
predicting thethe ranking
ranking of DPPH
of DPPH free free radical
radical scavenging
scavenging activity
activity (A)
(A) and
and
andreducingreducing
reducing power
power (B) (B) based
based onon metabolite
metabolite profiles
profiles from
from the
the Mentha
Mentha samples.
samples. A
A predicted
predicted result
result
power (B) based on metabolite profiles from the Mentha samples. A predicted result after five
after five samples of test sets (open circle) was projected on to the model. AP, apple mint; CC,
after five samples
samples of test setsof (open
test sets (open
circle) was circle)
projected wasonprojected on to
to the model. AP,the model.
apple mint;AP,
CC, apple mint;
chocolate CC,
mint;
chocolate mint; ED, eau de cologne mint; HS, horse mint; PP, peppermint; PR, pennyroyal mint; PA,
ED, eaumint;
chocolate de cologne
ED, eau mint; HS, horse
de cologne mint;HS,
mint; PP,horse
peppermint; PR,peppermint;
mint; PP, pennyroyal mint; PA, pineapple
PR, pennyroyal mint;
mint; PA,
pineapple
SP, mint;
spearmint; WT,SP,water
spearmint;
mint. WT, water mint.
pineapple mint; SP, spearmint; WT, water mint.
Figure 6.6.The
Figure Theinfluence
influence of variables usedused
of variables to create DPPHDPPH
to create free radical scavenging
free radical (A) and the
scavenging (A) reducing
and the
power (B)power
reducing predictor
(B) for Menthafor
predictor spp. C26, hexacosanol;
Mentha C28, octacosanol;
spp. C26, hexacosanol; C30, triacontanol.
C28, octacosanol; C30, triacontanol.
Figure 6. The influence of variables used to create DPPH free radical scavenging (A) and the
reducing power (B) predictor for Mentha spp. C26, hexacosanol; C28, octacosanol; C30, triacontanol.
3. Discussion
3. DiscussionMolecules 2019, 24, 258 10 of 15
3. Discussion
Secondary metabolites such as phenolic compounds, ascorbic acid and carotenoids have an effect
on the antioxidant properties of a medicinal plant [25]. For instance, a high correlation is observed
between the DPPH scavenging activity and the total phenolic content (R2 > 0.989) [19]. Phenolic
compounds act as scavengers of chain-breaking peroxyl-radicals, thus inhibiting lipid peroxidation [26].
Metabolomics can assist in dissecting the mechanism that regulates the conversion of primary
metabolites into secondary metabolites in plants. In our results, shikimic acid and phenylalanine,
precursors used in the phenylpropanoid biosynthetic pathway, were important for creating the
prediction models of antioxidant capacities (Figures 5 and 6). Shikimic acid and phenylalanine were
shown to have a high degree of correlation each other (r = 0.5935; p < 0.001). Rutin was also shown
to have a high correlation with shikimic acid and phenylalanine (r = 0.8460; p < 0.0001 and r = 0.8417;
p < 0.0001), respectively. Riboflavin can be used as a natural antioxidant to protect the human body
against oxidative stress, especially from lipid peroxidation [27]. The antioxidant capacity of food
carotenoids is involved in quenching singlet oxygen and free radical scavenging [28]. The results of
our present study indicate a positive correlation between the total carotenoid content and the reducing
power of Mentha extracts (Figure S7). The correlation coefficient (R2) was determined to be 0.7913.
These results suggest that 79% of reducing power is due to the contribution of carotenoid compounds.
This relationship was also confirmed by the PLS prediction model and VIP values (Figures 4 and 5).
However, there was no apparent association between the antioxidant potential and other secondary
metabolites, such as riboflavin. Variability in the biological effectiveness is related to the chemical
composition, genotype and cultivar of Mentha [13]. Even though numerous studies have already shown
the potential of plant extracts as natural antioxidants, it has been difficult to interpret the relationship
between the components and their antioxidant potential because of their chemical complexity [21].
There has been considerable interest in recent times in the role of plant-derived antioxidants
in human health. Because of increasing consumer demand for natural and organic products rather
than synthetic antioxidants, many research groups have focused on edible medicinal plants as natural
sources of harmless and effective antioxidants in the food industry. There have been reports on the
protective effect of natural antioxidants against oxidative stress [4]. Slowing down of the progression of
chronic diseases in humans can be correlated to the intake of natural antioxidants [29]. The significant
free radical scavenging capacity of crude extracts of aromatic plants has been well documented [21].
For instance, it has been determined that mint, beet and ginger have excellent antioxidant capabilities,
comparable to that of synthetic agents [4]. It is known that a relationship between phenylpropanoids
and antioxidant potential exists. Our results have provided the possibility of using a PLS prediction
model for selecting plants with high antioxidant potential using metabolic profiling.
4. Materials and Methods
4.1. Plant Materials
Young seedlings of the nine Mentha species were obtained from the Seed Mall Co. (Seoul, Korea).
The Mentha plants were grown in a greenhouse at the experimental farm of Chungnam National
University (Daejeon, Korea). The plants were exposed to outdoor conditions during a period spanning
March 2016 to June 2016. During cultivation, the average temperature was 16.45 ◦ C, the relative
humidity was 63.5% and the average precipitation was 85.7 mm, according to the data obtained from
the Korea Meteorological Administration (http://web.kma.go.kr). The temperature and illumination
were not controlled any further. Aerial parts of the plants that included leaves and stems were harvested
and all samples were collected as three biological replicates. The samples were freeze-dried at −80 ◦ C
for 3 days (Ilshin Lab Co., Ltd., Dongducheon, Korea) and the dried plants were powdered finely using
mortars and pestles.Molecules 2019, 24, 258 11 of 15
4.2. Analysis of Hydrophilic and Lipophilic Metabolites using GC-MS
Hydrophilic metabolites were extracted by the method described by Kim et al. (2017) [30]. Ribitol
was used as an internal standard (IS). The derivatization of hydrophilic compounds was carried
out with methoxyamine hydrochloride and N-methyl-N-trimethylsilyl trifluoroacetamide (MSTFA).
The GCMS-QP2010 Ultra system (Shimadzu, Kyoto, Japan) was used with a DB-5 column (30 m
length, 0.25 mm inner diameter and 1 µm film thickness; Agilent, CA, USA). The split ratio was set to
1:10 and the flow rate of helium as the carrier gas was 1.1 mL/min. The injection temperature was
280 ◦ C. The column temperature was held at 100 ◦ C for 4 min and then raised to 320 ◦ C at the rate of
10 ◦ C/min, then held for 11 min at 320 ◦ C. The ion source and interface temperatures were 200 ◦ C and
280 ◦ C, respectively. The scanned mass range was 45–600 m/z. Peak identification and analysis was
performed using the LabSolutions GCMS solution software, version 4.11 (Shimadzu). A series of linear
alkanes ranging from C6 to C26 were analyzed for retention indices (RI). To compare the retention time
(RT), RI and mass spectra with analytes in the samples, the respective standards and Wiley9, NIST11
and OA TMS DB5 (Shimadzu) libraries were used (Table S1). Quantification was based on the peak
area ratios relative to the IS peak area.
The extraction and GC-MS analysis of lipophilic metabolites was performed according to the
method described by Kim et al. (2015) [31] with slight modifications. 5α-Cholestane was used as the
IS. The derivatization of lipophilic compounds was also carried out with MSTFA. The GCMS-QP2010
Ultra system with a Rtx-5MS column (30 m length, 0.25 mm inner diameter and 0.25 µm film thickness;
Agilent, CA, USA) was used to separate the lipophilic compounds. Helium was used as the carrier
gas at a flow rate of 1 mL/min. The split ratio was set to 1:10. The injection temperature was 290 ◦ C
and the column temperature was 150 ◦ C. The oven temperature program consisted of a hold period
of 2 min at 150 ◦ C, increasing at the rate of 15 ◦ C/min to 320 ◦ C and a final hold period of 10 min at
320 ◦ C. The ion source and interface temperatures were 230 ◦ C and 280 ◦ C, respectively. The scanned
mass range was 85–600 m/z. Peak identification was performed by comparing with RT and mass
spectra of standards. Standards of policosanols were obtained from Sigma (St. Louis, MO, USA).
Amyrins, phytosterols and tocopherols were obtained from Merck (Darmstadt, Germany). Standard
calibration curves were used for quantification. Quantification was performed using selected ions, as
described in Figure S3. The calibration curve range of standard was from 0.25 to 5.0 µg.
4.3. HPLC Analysis
4.3.1. Phenolic Compounds
Phenolic compound standards were purchased from Sigma-Aldrich (St. Louis, MO, USA). Twenty
milligrams of dried sample was extracted with 3 mL of 80% methanol (v/v). The crude mixture was
ultrasonicated for 1 h at room temperature and then centrifuged at 12,000 rpm for 10 min. The final
extract was filtered using a 0.45 µm Acrodisc syringe filter (Pall Corp.; Port Washington, NY, USA).
The flow rate was maintained at 1 mL/min and a 280-nm wavelength was used for detection. Elution
was performed using a binary gradient of mobile phase A (0.15% of acetic acid in H2 O, v/v) and
mobile phase B (methanol). The volume of the sample injected was 20 µL and column temperature
was maintained at 30 ◦ C for detection. The individual compounds were separated and identified in
the Futecs model NS-4000 HPLC apparatus (Daejeon, Korea).
4.3.2. Riboflavin
Standard stock solutions of riboflavin (Sigma, St. Louis, MO, USA) were prepared in 0.01 M HCl.
Quantification was performed using calibration curves ranging from 0.01 to 1.00 µg/mL. Riboflavin
was extracted from 10 mg of the freeze-dried sample suspended in 1 mL of H2 O. After incubating at
78 ◦ C for 20 min, the sample was placed on ice for 3 min and then centrifuged at 15,000 rpm and 4 ◦ C
for 10 min. The supernatant was filtered using a 0.2 µm filter (Advantec, Tokyo, Japan) and 20 µL of the
filtrate was injected into a Waters e2695 separation module system (Waters Corporation, Milford, MA,Molecules 2019, 24, 258 12 of 15
USA) equipped with a Waters 2475 fluorescence detector (Waters Corporation, Milford, MA, USA) and
a C18 column (250 mm length, 4.6 mm inner diameter, 5 µm pore size; Waters Corporation, Milford,
MA, USA). Elution was performed using a binary gradient of mobile phase A (0.1% formic acid in
H2 O) and mobile phase B (0.1% formic acid in acetonitrile). The flow rate was 1 mL/min and the
column temperature was 40 ◦ C. Peaks were identified and quantified using the Empower 3 software
(Waters Corporation).
4.3.3. Carotenoids
Carotenoids were extracted and analyzed as described by Park et al. (2014) with several
modifications [32]. An HPLC series 1100 system (Agilent, Germany) with a YMC Carotenoid S-3µm
column (250 mm length, 4.6 mm inner diameter; YMC separation technology, Kyoto, Japan) was
used for separation. The injection volume was 20 µL and flow rate was maintained at 1 mL/min for
detection. The column temperature was set to 40 ◦ C. Data were analyzed using ChemStation for LC
3D software, Rev. A. 10.02 (Agilent Technologies). Peak identification was performed by standard
solutions. Quantification was performed using calibration curves ranging from 0.16 to 5.00 µg/mL.
The carotenoid standards were obtained from Extrasynthese (Genay, France).
4.4. Antioxidant Activity
4.4.1. Extraction
Ten grams of the powdered sample was soaked in 50 mL of ethanol for one day and the extracts
were filtered using filter paper. The filtrates were evaporated using a rotary vacuum evaporator and
the dried samples were stored at 4 ◦ C for subsequent experiments.
4.4.2. DPPH Assay
We prepared 0.15% DPPH in ice cold methanol. The reaction mixture contained 1.6 mL of
methanol and various amounts of extracts (20, 40, 60, 80 and 100 µL) which were added to a 200 µL
DPPH solution. The reaction mixture was incubated at 25 ◦ C for 30 min in dark. The absorbance was
then measured at 517 nm. Vitamin C was used as the standard. The DPPH radical scavenging activity
was determined using the following formula. DPPH radical scavenging activity (%) = [(A0 − A1 /A0 )
× 100], where A0 is the absorbance of the control and A1 is the absorbance of the sample.
4.4.3. Hydrogen Peroxide Scavenging Activity
A solution of hydrogen peroxide (40 mM) was prepared in phosphate buffer (pH 7.4). The reaction
mixture contained different amounts of extracts (20, 40, 60, 80 and 100 µL) in 1 mL of distilled water.
The reaction mixtures were incubated at 25 ◦ C for 10 min after the addition of 0.6 mL of H2 O2 .
The absorbance was then measured at 560 nm. Ascorbic acid was used as the standard. The hydrogen
peroxide scavenging activity of the extracts was calculated using the following formula. Hydrogen
peroxide radical scavenging activity (%) = [(A0 − A1 /A0 ) × 100], where A0 is the absorbance of the
control and A1 is the absorbance of the sample.
4.4.4. Reducing Power Analysis
Different volumes of the extracts (20, 40, 60, 80 and 100 µL) were mixed with a 2.5 mL 0.2 M
phosphate buffer (pH = 6.6). Subsequently, 2.5 mL of 1% K3 Fe(CN)6 was added and the mixture was
incubated at 50 ◦ C for 20 min. Next, 2.5 mL of 10% trichloroacetic acid was added to the mixture which
was then centrifuged at 3000 rpm for 10 min. The supernatant (2.5 mL) was mixed with an equal
volume of distilled water, to which 0.5 mL of 1% FeCl2 was added and the absorbance was measured
at 700 nm. The optical density values increased with increasing sample concentrations, indicating an
increase in the reducing power. Vitamin C was used as the standard. A standard vitamin C solution of
1 mg/mL concentration was prepared as the stock solution for all experiments.Molecules 2019, 24, 258 13 of 15
4.5. Statistical Analysis
The content of hydrophilic compounds, lipophilic compounds, phenolic compounds, riboflavin
and carotenoids in the nine Mentha species were determined by PCA using the SIMCA software
(version 14.1; MKS Umetrics AB, Umeå, Sweden). PCA is a clustering method that assesses the
relationships among the samples. The score plot shows reciprocal contrast and the loading plot
explains the cluster separation. Using the SAS software package (version 9.4; SAS Institute, Cary, NC,
USA), Pearson’s correlation coefficients were calculated and HCA was performed using the software
Multi-Experiment Viewer version 4.9.0 (http://www.tm4.org/mev/). Projection to latent structure
using PLS was performed using the SIMCA software. Quantitative data was used as independent
variable (x) and ranking of DPPH scavenging activity and reducing power were used as dependent
variable (y). All experiments were carried out for three biological replicates. Each result is presented as
the mean ± standard deviation.
5. Conclusions
To summarize, we have determined the primary and secondary metabolite profiles, including
those of phenolic compounds, riboflavin, and carotenoids to determine the diversity among the
phytochemicals and to analyze the relationships among their contents. Additionally, we screened the
antioxidant and free radical scavenging properties of nine Mentha species. Cirlini et al. (2016) have
reported the phenolic and volatile composition of a spearmint extract developed utilizing selective
breeding to yield high amounts of rosmarinic acid [33]. However, few studies have reported on
the variation in the characterization of carotenoids in different Mentha species [18]. Eleven phenolic
compounds and eight carotenoids were identified and quantified through HPLC analysis. Forty-seven
hydrophilic and seventeen lipophilic metabolites were identified using GC-MS. The composition of
the various constituents and their antioxidant potential varied among the extracts of the different
Mentha species. We developed good prediction models of antioxidant capacity from metabolic profiling
using PLS, indicating that metabolomics should be a useful tool to predict plant quality. Our results
suggest that Mentha species can be used as natural food preservatives, pharmaceuticals and cosmetic
industry resources because of their strong antioxidant potential. Horse mint (M. longifolia) especially
displayed the highest antioxidant efficacy, appearing to be a great variety amongst the nine Mentha
species studied. Further research is required to establish a safe and effective method of mass producing
antioxidant-rich Mentha species, which are of value to various industries.
Supplementary Materials: The following are available online.
Author Contributions: Y.J.P. performed HPLC analysis. S.-A.B. performed GC-MS analysis. Y.C. analyzed the
data. Y.J.P. and S.-A.B. wrote the manuscript. S.U.P. and J.K.K. designed the experiments.
Funding: This work was supported by the funds from the Incheon National University Research grant in 2017
and a grant from the Next-generation BioGreen 21 Program (PJ01334604), Republic of Korea.
Conflicts of Interest: The authors declare no conflict of interest.
References
1. Kumar, P.; Mishra, S.; Malik, A.; Satya, S. Insecticidal properties of Mentha species: A review. Ind. Crop. Prod.
2011, 34, 802–817. [CrossRef]
2. Ali, M.S.; Saleem, M.; Ahmad, W.; Parvez, M.; Yamdagni, R. A chlorinated monoterpene ketone, acylated
β-sitosterol glycosides and a flavanone glycoside from Mentha longifolia (Lamiaceae). Phytochemistry 2002, 59,
889–895.
3. Dorman, H.D.; Kosar, M.; Kahlos, K.; Holm, Y.; Hiltunen, R. Antioxidant properties and composition of
aqueous extracts from Mentha species, hybrids, varieties, and cultivars. J. Agric. Food Chem. 2003, 51,
4563–4569. [CrossRef] [PubMed]Molecules 2019, 24, 258 14 of 15
4. Shaikh, S.; Yaacob, H.B.; Rahim, Z.H.A. Prospective role in treatment of major illnesses and potential benefits
as a safe insecticide and natural food preservative of mint (Mentha spp.): A review. Asian. J. Biomed.
Pharm. Sci. 2014, 4, 1–12. [CrossRef]
5. Pourmorad, F.; Hosseinimehr, S.; Shahabimajd, N. Antioxidant activity, phenol and flavonoid contents of
some selected Iranian medicinal plants. Afr. J. Biotechnol. 2006, 5, 1142–1145.
6. Canadanovic-Brunet, J.M.; Djilas, S.M.; Cetkovic, G.S.; Tumbas, V.T. Free-radical scavenging activity of
wormwood (Artemisia absinthium L.) extracts. J. Sci. Food Agric. 2005, 85, 265–272. [CrossRef]
7. Hounsome, N.; Hounsome, B.; Tomos, D.; Edwards-Jones, G. Plant metabolites and nutritional quality of
vegetables. J. Food Sci. 2008, 73, R48–R65. [CrossRef]
8. Trethewey, R.N. Metabolite profiling as an aid to metabolic engineering in plants. Curr. Opin. Plant Biol.
2004, 7, 196–201. [CrossRef] [PubMed]
9. Kim, J.K.; Lee, S.T.; Chu, S.M.; Lim, S.-H.; Suh, S.-C.; Lee, Y.-T.; Cho, H.S.; Ha, S.-H. Variation and correlation
analysis of flavonoids and carotenoids in Korea pigmented rice (Oryza sativa L.) cultivar. J. Agric. Food 2010,
58, 12804–12809. [CrossRef] [PubMed]
10. Baek, S.-A.; Jung, Y.-H.; Lim, S.-H.; Park, S.U.; Kim, J.K. Metabolic profiling in Chinese cabbage (Brassica rapa
L. subsp. pekinensis) cultivars reveals that glucosinolate content is correlated with carotenoid content. J. Agric.
Food Chem. 2016, 64, 4426–4434. [CrossRef] [PubMed]
11. Serrano, M.; Zapata, P.J.; Castillo, S.; Guillén, F.; Martínez-Romero, D.; Valero, D. Antioxidant and nutritive
constituents during sweet pepper development and ripening are enhanced by nitrophenolate treatments.
Food Chem. 2010, 118, 497–503. [CrossRef]
12. Ferreres, F.; Gomes, D.; Valentão, P.; Gonçalves, R.; Pio, R.; Chagas, E.A.; Seabra, R.M.; Andrade, P.B.
Improved loquat (Eriobotrya japonica Lindl.) cultivars: Variation of phenolics and antioxidative potential.
Food Chem. 2009, 114, 1019–1027. [CrossRef]
13. Mimica-Dukic, N.; Bozin, B. Mentha L. species (Lamiaceae) as promising sources of bioactive secondary
metabolites. Curr. Pharm. Des. 2008, 14, 3141–3150. [CrossRef]
14. Aires, A.; Marrinhas, E.; Carvalho, R.; Dias, C.; Saavedra, M.J. Phytochemical composition and
antibacterial activity of hydroalcoholic extracts of Pterospartum tridentatum and Mentha pulegium against
Staphylococcus aureus isolates. BioMed. Res. Int. 2016, 2016, 11. [CrossRef] [PubMed]
15. Voirin, B.; Bayet, C.; Faure, O.; Jullien, F. Free flavonoid aglycones as markers of parentage in Mentha aquatica,
M. citrata, M. spicata and M. x piperita. Phytochemistry 1999, 50, 1189–1193. [CrossRef]
16. Cazzonelli, C.I. Carotenoids in nature: Insights from plants and beyond. Funct. Plant Biol. 2011, 38, 833–847.
[CrossRef]
17. Shumskaya, M.; Wurtzel, E.T. The carotenoid biosynthetic pathway: Thinking in all dimensions. Plant Sci.
2013, 208, 58–63. [CrossRef]
18. Straumite, E.; Kruma, Z.; Galoburda, R. Pigments in mint leaves and stems. Agron. Res. 2015, 13, 1104–1111.
19. Kamkar, A.; Javan, A.J.; Asadi, F.; Kamalinejad, M. The antioxidative effect of Iranian Mentha pulegium
extracts and essential oil in sunflower oil. Food Chem. Toxicol. 2010, 48, 1796–1800. [CrossRef]
20. Nickavar, B.; Alinaghi, A.; Kamalinejad, M. Evaluation of the antioxidant properties of five Mentha species.
Iran J. Pharm. Res. 2010, 7, 203–209.
21. Miguel, M.G. Antioxidant activity of medicinal and aromatic plants. a review. Flavour. Frag. J. 2010, 25,
291–312. [CrossRef]
22. Lilia, E.; Salah, R.; Hajer, S.A.; Abderrazak, D.; Majida, E.H.; Ismail, E.H. Effect of salt treatment on the
expression of phenolics and peroxidase activity assessed in two barley cultivars Acsad 1230 and Arig 8.
J. Agron. 2005, 4, 196–202.
23. Eriksson, L.; Johansson, E.; Kettaneh-Wold, N.; Wold, S. Multi-and Megavariate Data Analysis, Principles and
Applications, 3rd ed.; Umetrics Academy: Umea, Sweden, 2001; pp. 328–331.
24. Jumtee, K.; Bamba, T.; Fukusaki, E. Fast GC-FID based metabolic fingerprinting of Japanese green tea leaf for
its quality ranking prediction. J. Sep. Sci. 2009, 32, 2296–2304. [CrossRef]
25. Zhang, D.; Hamauzu, Y. Phenolics, ascorbic acid, carotenoids and antioxidant activity of broccoli and their
changes during conventional and microwave cooking. Food Chem. 2004, 88, 503–509. [CrossRef]
26. Halliwell, B.; Gutteridge, J.M. Free Radicals in Biology and Medicine, 5th ed.; Oxford University Press: Oxford,
UK, 2015; pp. 173–179.Molecules 2019, 24, 258 15 of 15
27. Ashoori, M.; Saedisomeolia, A. Riboflavin (vitamin B2 ) and oxidative stress: A review. Br. J. Nutr. 2014, 111,
1985–1991. [CrossRef] [PubMed]
28. Rodriguez-Amaya, D.B. Quantitative analysis, in vitro assessment of bioavailability and antioxidant activity
of food carotenoids—A review. J. Food Comp. Anal. 2010, 23, 726–740. [CrossRef]
29. Zheng, W.; Wang, S.Y. Antioxidant activity and phenolic compounds in selected herbs. J. Agric. Food Chem.
2001, 49, 5165–5170. [CrossRef]
30. Kim, T.J.; Choi, J.; Kim, K.W.; Ahn, S.K.; Ha, S.-H.; Choi, Y.; Park, N.I.; Kim, J.K. Metabolite prpfiling of
peppers of various colors reveals relationships between tocopherol, carotenoid, and phytosterol content.
J. Food Sci. 2017, 82, 2885–2893. [CrossRef] [PubMed]
31. Kim, T.J.; Lee, K.B.; Baek, S.-A.; Choi, J.; Ha, S.-H.; Lim, S.-H.; Park, S.-Y.; Yeo, Y.; Park, S.U.; Kim, J.K.
Determination of lipophilic metabolites for species discrimination and quality assessment of nine leafy
vegetables. J. Korean Soc. Appl. Biol. Chem. 2015, 58, 909–918. [CrossRef]
32. Park, S.-Y.; Choi, S.R.; Lim, S.-H.; Yeo, Y.; Kweon, S.J.; Bae, Y.-S.; Kim, K.W.; Im, K.-H.; Ahn, S.K.; Ha, S.-H.
Identification and quantification of carotenoids in paprika fruits and cabbage, kale, and lettuce leaves.
J. Korean Soc. Appl. Biol. Chem. 2014, 57, 355–358. [CrossRef]
33. Cirlini, M.; Mena, P.; Tassotti, M.; Herrlinger, K.A.; Nieman, K.M.; Dall’Asta, C.; Del Rio, D. Phenolic and
volatile composition of a dry spearmint (Mentha spicata L.) extract. Molecules 2016, 21, 1007. [CrossRef]
[PubMed]
Sample Availability: Not available.
© 2019 by the authors. Licensee MDPI, Basel, Switzerland. This article is an open access
article distributed under the terms and conditions of the Creative Commons Attribution
(CC BY) license (http://creativecommons.org/licenses/by/4.0/).You can also read


