Daily Dynamics of an Ant Community in a Mountaintop Ecosystem - AntWiki
←
→
Page content transcription
If your browser does not render page correctly, please read the page content below
Environmental Entomology, XX(XX), 2020, 1–8
                                                                                                                  doi: 10.1093/ee/nvaa011
Community Eccology                                                                                                              Research

Daily Dynamics of an Ant Community in a Mountaintop
Ecosystem
Eloá Gonçalves Calazans,1 Fernanda Vieira da Costa,1 Maykon Passos Cristiano,1,2, and
Danon Clemes Cardoso1,2,3,

1
 Programa de Pós-graduação em Ecologia de Biomas Tropicais, Universidade Federal de Ouro Preto, Ouro Preto, MG 35400-000,
Brazil, 2Departamento do Biodiversidade, Evolução e Meio Ambiente, Universidade Federal de Ouro Preto, Ouro Preto, MG 35400-
000, Brazil, and 3Corresponding author, e-mail: danon@ufop.edu.br

Subject Editor: Jason Schmidt

Received 12 November 2019; Editorial decision 22 January 2020

Abstract
Abiotic conditions have a great influence on the structure of biological communities, especially considering
ectothermic organisms, such as ants. In this study, we tested whether the daily temporal dynamics of an ant
community in a tropical mountainous ecosystem is driven by daily fluctuations of abiotic factors, such as
temperature and humidity. We also investigated whether the strong oscillation in daily temperature leads to high
heterogeneity in ant species thermal responses. We have found that air and soil temperatures positively influenced
the richness and frequency of foraging ants, while air humidity caused the opposite effect. Ant activity followed
daily temperature fluctuations, which resulted in subtle differences in foraging patterns featured by heat-tolerant
and heat-intolerant species. Moreover, the studied ant community exhibited broad and highly overlapped thermal
responses, suggesting a likely resilience under temperature oscillations. Lastly, identifying how species traits are
linked to oscillations in abiotic conditions is a necessary step to predict the effects of future climatic changes on
biological community dynamics and ecosystem functioning.

Key words: Campo rupestre, climate change, temperature, thermal niches, thermal responses

The evaluation of ecological processes involved in the structure                        different foraging strategies (Cros 1997, Cerdá et al. 1998). For in-
and dynamics of biological communities is still considered one of                       stance, to avoid stressful temperatures, the activity of some ant spe-
the great challenges of contemporary ecology (McGill et al. 2006,                       cies may be restricted to specific periods of the year or day which
Laliberte et al. 2009, Wittman et al. 2010). A pivotal goal of ecology                  are thermally suitable (Narendra et al. 2010, Jayatilaka et al. 2011,
is to predict changes in community abundance and richness in re-                        Fitzpatrick et al. 2014). In fact, the thermal response of ants under
sponse to environmental changes, such as climate change and global                      climatic fluctuations has been explored (e.g., Cerdá et al. 1998,
warming (Kaspari et al. 2019). Recent evidence has revealed the im-                     Lessard et al. 2009, Kaspari et al. 2015). However, most studies have
portance of abiotic variables as drivers that modulate the structure                    been conducted in temperate regions, in which seasonal patterns
and dynamics of biodiversity at different spatial and temporal scales                   strongly differ from those of tropical environments (e.g., Pie 2016),
(Lessard et al. 2009, Bishop et al. 2014, Cardoso and Schoereder                        where still there is little evidence (but see Fagundes et al. 2015, Costa
2014). For example, the influences of abiotic factors in the daily and                  et al. 2018). Furthermore, most studies are based on predictions of
seasonal activity patterns of thermally constrained species such as                     theoretical data modeling (e.g., Dunn et al. 2009, Gibb et al. 2015),
ants are well documented (Calosi et al. 2007, Hoffmann et al. 2013,                     while empirical evidence is still scarce.
Diamond et al. 2016). In fact, temperature (Cerdá et al. 1998, Lessard                      Mountainous ecosystems can be ‘natural laboratories’ to test the
et al. 2009, Arnan et al. 2015), humidity (Kaspari and Weser 2000,                      influence of abiotic factors on the structure and dynamics of bio-
Nondillo et al. 2014), and precipitation (Kaspari 1993) are among                       logical communities (Sanders et al. 2007, Sundqvist et al. 2013). In
the main predictors of ant diversity and activity, on both local (e.g.,                 general, the daily climatic conditions in montaintop environments
Bujan et al. 2016) and global scales (e.g., Gibb et al. 2015).                          fluctuate widely in a relatively small geographic area (Körner 2007),
    Considering the strong dependence of ants on the environmental                      allowing extrapolations to different spatial and/or temporal scales
temperature, it is known that different species have specific thermal                   (Bishop et al. 2014). The campo rupestre is a mountainous tropical
responses and tolerances to temperature fluctuations (e.g., Arnan                       ecosystem that is thermally stressful in terms of a high incidence
et al. 2015, Boulay et al. 2017). This thermal specificity may reflect                  of UV light, strong daily and seasonal temperature variations, and

© The Author(s) 2020. Published by Oxford University Press on behalf of Entomological Society of America.
All rights reserved. For permissions, please e-mail: journals.permissions@oup.com.
                                                                                                                                                               1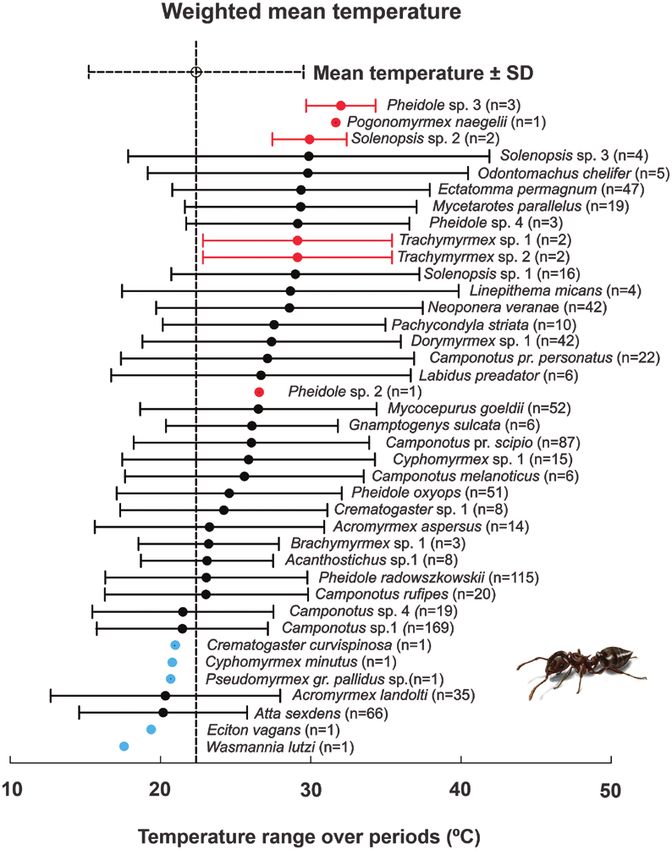
                                                                                      Environmental Entomology, 2020, Vol. XX, No. XX

heavy winds (Giulietti et al. 1997, Fernandes et al. 2016, Silveira      This preliminary pilot experiment indicated that the abiotic condi-
et al. 2016). It is an extremely diverse ecosystem with a high en-       tions in the study area significantly changed in intervals of 3 h. So,
demism and diversity of plants (Fernandes et al. 2016), as well a        in each sampling day (i.e., 24 h continuous), the pitfalls were moni-
great ant diversity (Costa et al. 2015). However, the campo rupes-       tored eight times in intervals spaced by 3 h, as it represents periods of
tre has been subjected to several anthropogenic pressures and over-      significant abiotic conditions changes (according to the pilot experi-
looked by public policies related to its conservation (Silveira et al.   ment). In each sampling period, every pitfall was collected, stored,
2016), and the threatening of habit loss is magnified due to their       tagged, and replaced with a new killing solution. Hence, to evaluate
restrict geographical range size. Furthermore, climatic predictions      the influence of abiotic variables fluctuation on richness and forag-
estimate that by the end of the century, these rocky environments        ing activity of ants, we sampled each area three times on three dif-
will lose up to 95% of their total area (Fernandes et al. 2016).         ferent days (spaced by a minimum interval of 15 d and a maximum
    Here, we assessed how the daily temporal dynamics of an epi-         of 26 d, all of them during the rainy season).
gean ant community is affected by daily fluctuations of abiotic con-         Thus, pitfall exchange and abiotic variables were monitored from
ditions of campo rupestre. First, we tested whether the daily (i.e.,     09:00 h (a.m.) to 06:00 h (a.m.) of the following day in eight periods
24 h) fluctuations in air temperature, soil surface temperature, and     spaced by 3 h (i.e., 09:00, 12:00, 15:00, 18:00, 21:00, 00:00, 03:00,
relative air humidity affect the richness and foraging activity of ant   and 06:00 h). Ants were identified to the lowest taxonomic level as
fauna, as they are considered good predictors of ant diversity and       possible using taxonomic keys and genera review articles (compiled
distribution (Kaspari and Weser 2000, Kaspari et al. 2015). Then, we     in Baccaro et al. 2015). Species identification was confirmed by the
tested whether the daily temperature oscillations predict the thermal    taxonomist Dr. Rodrigo Feitosa from the Universidade Federal do
variability of epigean ant species, as ecosystems with high thermal      Paraná (UFPR), and specimens were deposited in the Laboratório de
amplitudes might provide distinct thermal niches for species with        Genética Evolutiva e de Populações of the Universidade Federal de
different thermal preferences (Arnan et al. 2015, Bishop et al. 2017).   Ouro Preto (UFOP), Brazil. All permissions for collecting biological
                                                                         data were authorized by the Instituto Estadual de Florestas (IEF—
                                                                         License #079-2017, SISBIO 59834-1).
Methods
Study Site                                                               Data Analysis
We conducted the study in areas of campo rupestre located at the         To evaluate whether the daily oscillation of abiotic conditions influ-
Serra de Ouro Branco State Park (20°31′S, 43°41′W) in Minas              ences ant species richness and foraging activity, we built generalized
Gerais State, southeastern Brazil. The Brazilian campo rupestre is       linear mixed‐effects models (GLMMs), using ‘glmmer’ package for
a megadiverse tropical ecosystem that occurs at altitudes above          non-normal data and ‘lmer’ package for normal data. We considered
900–2,000 m (Alves et al. 2014). It is characterized by a mosaic         air temperature, soil temperature, and relative air humidity as pre-
of vegetation (Silveira et al. 2016) composed mostly of grasslands       dictor variables of fixed effects and the transect varying on the inter-
and shrubs associated with quartzite rock outcrops, poor nutrients,      cept as the random effect (1 | transect). We used the mean records
and sandstone soil (Silveira et al. 2016). Additionally, this environ-   of abiotic conditions registered during each sampling period (spaced
ment in considered a fire-prone ecosystem, wherein the ant fauna         by 3-h interval) in each sampling day. Therefore, we evaluated the
nests in natural cavities of exposed rocks and plants (Fagundes et al.   effect of each abiotic variable in separate models due to their high
2015, Costa et al. 2018). The climate regime is mesothermic (Cwb)        correlation (Supp Table 1 [online only]). As response variables, we
according to Köppen’s classification, with humid summers and dry         considered the accumulated ants’ species richness and frequency
winters (Alvares et al. 2013). The warmest month is February and         sampled in each transect (taking 10 pitfall traps as sample unit) in
the coldest is July. The average annual temperature is 20.7°C and        each sampling period. Thus, the complete data set consisted of nine
rainfall is around 1,188 mm (data provided by Gerdau-Açominas            transects (three per area), monitored at 8 day-periods, in three dis-
weather station, placed at 15 km from the studied area).                 tinct days, totaling 216 records.
                                                                             Additionally, we evaluated whether the studied ant species were
Sample Design                                                            good indicators of abiotic conditions registered in the day-period in
We selected three areas of campo rupestre (20°50′S, 43°65′W;             which they were sampled. For this, we used the method of species
20°49′S, 43°66′W; 20°49′S, 43°67′W) that are similar to each other       Indicator Value (IndVal) (Dufrêne and Legendre 1997). To determine
in terms of its vegetational structure (composed mostly by grasses,      if a species can be a good indicator, we built an occurrence matrix
shrubs, and forbs) and altitude (from 1,250 to 1,350 m a.s.l.). The      of each ant species sampled in every day-period. The IndVal ranges
minimum distance between areas was 1.5 km and the maximum was            from 0 (no indication | specificity) to 1 (high indication | specificity).
5 km. We sampled each area three times during the rainy season,          Thus, species with IndVal above 70% were considered with high
from February to April 2018.                                             specificity, species with IndVal between 45 and 70% were considered
    We sampled the epigean ant fauna using unbaited pitfall traps.       detector species, and species with values below 45% were considered
The pitfall consisted of a plastic recipient of 77 cm in height and      species without any specificity for the climatic conditions during the
119 cm in diameter, partially filled with a killing solution comprised   day-periods they were sampled. Detector species were those that
of salt, water, and detergent (Cardoso et al. 2010). In each sampling    could forage in any other day-period if there was any change in abi-
area, we delimited three transects of 100 m, distant from each other     otic conditions (McGeoch et al. 2002).
by 50 m. In each transect, we installed 10 pitfalls placed at 10 m           Finally, to assess whether daily temperature fluctuations predict
apart, totaling 30 pitfalls per sampling area.                           the variability of ant thermal responses, we built a thermal niche
    Before starting our monitoring, over 24 h, we measured the air       model (Kühsel and Blüthgen 2015). In this analysis, we considered
temperature and humidity with a datalogger (mod. 171-DT) posi-           the frequency of occurrence of each species (per transect) and asso-
tioned 1 m aboveground. The soil temperature was recorded by a           ciated these frequencies with the mean air temperature of the period
chemical thermometer (Incoterm 5005) buried 5 cm belowground.            in which they occurred. This weighted approach accounted for the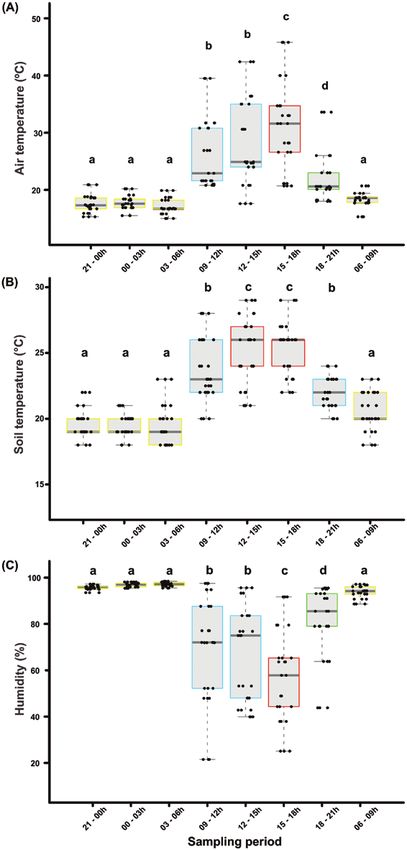
                                                                                                                                                      3

relative temperature preferences, such as the accuracy (number of
observations per temperature), to characterize each species’ thermal
niche. Hence, the thermal optimum of each species was computed
from the weighted average temperature of each species occurrence
(i.e., the temperature recorded during the day-period of sampling).
To determine the thermal niche breadth of each species, we calcu-
lated the weighted standard deviation of the mean temperature. To
test whether the foraging activity of each species corresponded to the
air temperature in which they were observed, we implemented a null
model to estimate the expected thermal response for each species at
random temperatures to determine whether it could occur on every
transect with the same likelihood in all periods, regardless of the
temperature. From the observed optimum thermal and the estimated
optimum, we observed whether the species foraging activity signifi-
cantly deviated from the field sampling conditions. Thus, we per-
formed 1,000 randomizations to calculate how often the expected
thermal niche was larger or smaller than the observed temperature
for each species activity (α = 5%) (see Costa et al. 2018 for a com-
parable approach under seasonal variations in temperature).
     All statistical analyses were performed using the statistical pro-
gram R (R Development Team 2018).

Results
We sampled 39 ant species from 24 genera and seven subfam-
ilies (Fig. 2). The most representative subfamily was Myrmicinae
with 51% species, followed by Formicinae (23%), Dorylineae and
Ponerinae (6.9%), Dolichoderinae and Ectatomminae (4.6%), and
Pseudomyrmicinae (2.3%). The richest genus was Camponotus
Mayr (Hymenoptera: Formicidae) (six species), followed by
Pheidole Westwood (Hymenoptera: Formicidae) (four species).
Eciton Latreille (Hymenoptera: Formicidae), Pseudomyrmex Lund
(Hymenoptera: Formicidae), and Pogonomyrmex Mayr (Hymenoptera:
Formicidae) were the less sampled genus, with only one species each.
     The mean air temperature registered during the study was 22.6°C,
ranging from a minimum of 15°C to a maximum of 45°C. The ob-
served mean soil temperature was 21.6°C (minimum 11°C, max-
imum 29°C). For air humidity, we recorded a mean of 81.8% with
a minimum of 21.5% and a maximum of 98.4%. Air temperature
(F = 35.06, df = 7, P < 0.001), soil temperature (F = 43.13, df = 7,
P < 0.001), and relative air humidity (F = 34.11, df = 7, P < 0.001)
significantly fluctuated throughout the sampling periods (24 h con-
tinuously). The variation of abiotic conditions per day-period and
statistically different groups are show in the Fig. 1.
     We have found that the studied abiotic conditions affected the        Fig. 1. Abiotic factors measured during the sampling periods. The horizontal
daily temporal dynamics of the epigean ant community. Increases in         line in the box represents the median (±SD) values of the air temperature (A),
air temperature positively influenced ant species richness (F = 75.11,     soil surface temperature (B), and relative air humidity (C) for each sampling
df = 1, P < 0.001) and species frequency (F = 20.178, df = 1,              period. Different letters above bars and colors indicate similar statistically
P < 0.001) (Fig. 1). Similarly, soil surface temperature positively af-    day-period for abiotic conditions evaluated. (For interpretation of the
                                                                           references to color in this figure legend, the reader is referred to the web
fected species richness (F = 66.091, df = 1, P < 0.001) and species
                                                                           version of this article).
frequency (F = 18.077, df = 1, P < 0.001). In contrast, the relative air
humidity negatively affected the richness (F = 85.8, df = 1, P < 0.001)
and frequency of ants (F = 24.273, df = 1, P < 0.001) (Fig. 2).            Dorymyrmex sp. 1 Mayr (Hymenoptera: Formicidae), and Pheidole
     The IndVal analyses showed that most ant species (83.7%) were         radoszkowskii Mayr (Hymenoptera: Formicidae) (Fig. 3).
not specific to the sampling period in which they mostly occurred (i.e.,      Altogether, the studied ant community exhibited an thermal
IndVal < 45%) (Fig. 3). Only two species (4.6%) exhibited high speci-      optimum of 22.4°C and a niche breadth that ranged from 18°C
ficity for a particular day-period: Camponotus sp. 1 and Camponotus        (Wasmannia lutzi Forel [Hymenoptera: Formicidae]) to 45°C
pr. scipio Forel (Hymenoptera: Formicidae) (Fig. 3). Five species          (Pheidole sp. 3) (SD ± 7.14°C) (Fig. 4, indicated by vertical and hori-
(11.6%) were identified as detector species (i.e., IndVal equal to or      zontal dashed lines, respectively). Most species (74.4%) had thermal
greater than 45%): Ectatomma permagnum Forel (Hymenoptera:                 responses that corresponded to the average thermal niche of all
Formicidae), Mycocepurus goeldii Forel (Hymenoptera: Formicidae),          species sampled (Fig. 4, horizontal dashed line), indicating that the
Camponotus pr. personatus Emery (Hymenoptera: Formicidae),                 studied community has broad thermal responses with a high level of
Environmental Entomology, 2020, Vol. XX, No. XX
Fig. 2. Relationship between abiotic factors and the richness and frequency of ant species from campo rupestre. The points represent the local mean values in
each sampling period. The gray curves are the confidence intervals of the dependent variables. The curves were fitted with parameters from GLMM models.
overlap. Five ant species (11.6%) were more active at lower temper- Discussion
atures than the community average (Fig. 4, blue points in left part of
In this study, we demonstrated the direct effect of climatic condi-
vertical dashed line), and six species (13.90%) were more active at
tions on the daily dynamics of an ant community present in a moun-
higher temperatures, i.e., above the community average (Fig. 4, red
tainous tropical ecosystem. We have found that increases in air and
points in the right part of vertical dashed line).
soil temperature positively affected the richness and foraging activity 5
Fig. 3. Indicator value results showing ant species specificity according to day-period in which they occurred. The color intensity indicates the degree of ant
specificity in each day-period. White represents no specificity for the sampling period. Light gray indicates a low specificity for the sampling period (IndVal <
45%). Dark gray represents ‘detection’ for the sampling period (IndVal values between 45 and 70%), and black suggests high specificity for the sampling period
(IndVal > 70%).
of ants, while the humidity had an opposite effect. Our results sug- Here, we have observed that local climatic conditions vary strongly
gest that despite the strong daily amplitude of abiotic conditions in over a day, a similar pattern already registered for other regions in
the campo rupestre (see Fig. 1), the studied ant community exhib- the same ecosystem (Fernandes et al. 2016, Costa et al. 2018). In
ited broad and highly overlapping thermal responses, indicating a fact, the maximum daytime air temperature and the minimum night-
likely tolerance of this ant community under climatic fluctuations. time air temperature ranged by approximately 30°C. Likewise, we
Furthermore, the studied ant community presented low specificity registered large daily amplitudes for soil temperature (ca. 18°C) and
for the daytime period, indicating that the daily amplitude of abi- air humidity (ca. 77%). These findings reaffirm the stressful condi-
otic conditions in the campo rupestre does not restrict ant species tions imposed by local climatic factors that may impose differences
occurrence. in the physiological responses and foraging strategies of associated
In the tropics, seasonal temperatures vary slightly but widely fluc- organisms (Sheriff et al. 2012, Sunday et al. 2014, García-Robledo
tuate throughout the day (Ghalambor et al. 2006, Esch et al. 2017). et al. 2018). Environmental Entomology, 2020, Vol. XX, No. XX
Fig. 4. Thermal response of the ant community from the campo rupestre. The points indicate the thermal optimum where each species occurred, i.e., the mean
temperature in which each species occurred. The horizontal dashed lines represent the weighted standard deviations of temperature in which each species
occurred (niche breadth). Species in red are more heat tolerant, while species in blue prefer lower temperatures than the average sampled during the study. The
numbers after species names (n) represent the number of different temperatures in which each species was sampled, i.e., occurrence in transects monitored at
distinct temperatures. (For interpretation of the references to color in this figure legend, the reader is referred to the web version of this article).
Indeed, the high daily range of climatic conditions in the stud- We have found low variability in ant fauna thermal responses, as
ied campo rupestre influenced the richness and foraging activity pat- most species exhibited broad and highly overlapping thermal niches.
terns of epigeic ant species. The community showed greater richness This low variability of thermal responses suggests that this diverse
and foraging activity in daytime periods that coincided with periods ant community has similar physiological performances, being able
of highest temperature, followed by decreased activity after twilight to forage in a broad spectrum of temperature throughout the day.
and nighttime. This positive effect of temperature may indicate some The thermal niche of organisms may determine their susceptibility
tolerance of ants to handle higher temperatures. Moreover, our re- to climate warming (Diamond et al. 2012, Nelson et al. 2018). The
sults indicate that the studied ant fauna do not show preferences broad and overlapped thermal response of campo rupestre ants, as-
for foraging in specific periods during the day (see Fig. 3). Thus, sociated with the positive effect of temperature on ant diversity sug-
despite the high daily amplitude of abiotic conditions in the campo gests that this community is likely able to track certain temperature
rupestre, temperature ranges did not constrain the occurrence and increases (Arnan et al. 2015, Kaspari et al. 2019). A recent study
activity of ground foraging ants. The inclined tolerance of ants under found similar results wherein ants’ activity tracked temperature sea-
climatic fluctuations has already been documented for ants foraging sonality variation, likely being able to endure climatic fluctuations
on the vegetation throughout seasonal oscillations in abiotic condi- (Costa et al. 2018). Combined, these findings indicate that campo
tions (Costa et al. 2018). It is worth mentioning that the increased rupestre ants’ paths in a warming scenario are somewhat predict-
activity of ants under temperature and precipitation enhances may able. Alternatively, we must consider a thermal performance limit
have a maximum tolerance limit that once achieved, may prompt to that might predicts nonlinear increases in ants’ diversity, followed
descendent physiological performances reducing ants’ growth and by declined performances after to a certain point of heating (Kaspari
survival (Kaspari et al. 2019). et al. 2019). 7
Overall, our study points that daily variations in abiotic conditions the Maloti Drakensberg Mountains of southern Africa. J. Biogeogr. 41:
in a mountainous tropical ecosystem shape the temporal dynamics 2256–2268.
of an epigenic ant community. Daily fluctuations in air temperature, Bishop, T. R., M. P. Robertson, B. J. Van Rensburg, and C. L. Parr. 2017.
Coping with the cold: minimum temperatures and thermal tolerances
soil temperature, and humidity in the campo rupestre modulated the
dominate the ecology of mountain ants. Ecol. Entomol. 42: 105–114.
richness and foraging activity of ants. As already known, climatic
Boulay, R., S. Aron, X. Cerdá, C. Doums, P. Graham, A. Hefetz, and T. Monnin.
conditions can be considered determinant factors that drive the dis-
2017. Social life in arid environments: the case study of Cataglyphis ants.
tribution and dynamics of organisms (Gibb et al. 2015 and references Annu. Rev. Entomol. 62: 305–321.
therein). Our study provides evidence that the studied ant commu- Bujan, J., S. P. Yanoviak, and M. Kaspari. 2016. Desiccation resistance in trop-
nity can be widely tolerant with respect to temperature, corrobor- ical insects: causes and mechanisms underlying variability in a Panama ant
ating other studies that suggest a potential resilience of ants under community. Ecol. Evol. 6: 6282–6291.
environmental changes (see Costa et al. 2018, for temperature and Calosi, P., D. T. Bilton, and J. I. Spicer. 2007. Thermal tolerance, acclima-
fire, and Kaspari et al. 2019, for temperature). But it is important to tory capacity and vulnerability to global climate change. Biol. Lett. 4:
note that we tested the thermal responses of ants with respect to local 99–102.
Cardoso, D. C., and J. H. Schoereder. 2014. Biotic and abiotic factors shaping
air and soil temperature in a controlled altitudinal range (i.e., 100 m).
ant hymenoptera: formicidae assemblages in Brazilian coastal sand dunes:
As follows, we must be careful to infer on the tolerance, resilience,
the case of Restinga in Santa Catarina. Fla. Entomol. 97: 1443–1450.
and adaptability of ants to environmental heating, processes that
Cardoso, D. C., T. G. Sobrinho, and J. H. Schoereder. 2010. Ant community
would be even stronger in altitudinal shifts (Kinzner et al. 2019). The composition and its relationship with phytophysiognomies in a Brazilian
understanding of climate influence on organisms’ distribution has Restinga. Insect. Soc. 57: 293–301.
important implications for species persistence in a warming world. Cerdá, X., J. Retana, and S. Cros. 1998. Critical thermal limits in Mediterranean
In this context, further assessments of species thermal tolerances are ant societies: trade-off between mortality risk and foraging performance.
fundamental, as they allow the comprehension of organisms adapt- Funct. Ecol. 12: 45–55.
ability toward climate change, the consequences for the services they Costa, F. V., R. Mello, T. C. T. C. Lana, and F. S. F. D. S. Neves. 2015. Ant
provide and subsequent ecosystem functioning. fauna in megadiverse mountains: a checklist for the rocky grasslands.
Sociobiology. 62: 228–245.
Costa, F. V., N. Blüthgen, A. B. Viana-Junior, T. J. Guerra, L. Di Spirito, and
Supplementary Data F. S. Neves. 2018. Resilience to fire and climate seasonality drive the tem-
poral dynamics of ant-plant interactions in a fire-prone ecosystem. Ecol.
Supplementary data are available at Environmental Entomology Indic. 93: 247–255.
online. Cros, S., X. Cerdá, and J. Retana. 1997. Spatial and temporal variations in
the activity patterns of Mediterranean ant communities. Ecoscience. 4:
269–278.
Acknowledgments Diamond, S. E., D. M. Sorger, J. Hulcr, S. L. Pelini, I. D. Toro, C. Hirsch,
We are grateful to the many people that made this work possible. We E. Oberg, and R. Dunn. 2012. Who likes it hot? A global analysis of the
thank all of our colleagues at the Lab and Research Group of Genetics and climatic, ecological, and evolutionary determinants of warming tolerance
Evolution of Ants (GEF-UFOP) for their help with data, especially Vanessa in ants. Glob. Chang. Biol. 18: 448–456.
Diniz for her help on field work. The authors thank Rodrigo Feitosa from Diamond, S. E., L. M. Nichols, S. L. Pelini, C. A. Penick, G. W. Barber,
Universidade Federal do Paraná that confirmed ants’ identification. This S. H. Cahan, R. R. Dunn, A. M. Ellison, N. J. Sanders, and N. J. Gotelli.
study was financed in part by the Coordenação de Aperfeiçoamento de 2016. Climatic warming destabilizes forest ant communities. Sci. Adv. 2:
Pessoal de Nível Superior—Brasil (CAPES)—Finance Code 001. E.G.C. and e1600842.
F.V.C. also thank CAPES for the fellowship. D.C.C. thanks the Fundação Dufrêne, M., and P. Legendre. 1997. Species assemblages and indicator spe-
de Amparo à Pesquisa do Estado de Minas Gerais—FAPEMIG (PPM0199- cies: the need for a flexible asymmetrical approach. Ecol. Monogr. 67:
18) for the financial support. M.P.C. also thanks Conselho Nacional de 345–366.
Desenvolvimento Científico e Tecnológico (CNPq) for the research fellow- Dunn, R. R., D. Agosti, A. N. Andersen, X. Arnan, C. A. Bruhl, X. Cerdá,
ship (309579/2018-0). Funding agencies had no role in the design, collec- A. M. Ellison, B. L. Fisher, M. C. Fitzpatrick, H. Gibb, et al. 2009.
tion, analysis, and interpretations of data in the present study. E.G.C. and Climatic drivers of hemispheric asymmetry in global patterns of ant spe-
D.C.C. initiated the project idealization. E.G.C. carried out the sampling cies richness. Ecol. Lett. 12: 324–333.
fields. E.G.C., F.V.C., and D.C.C. analyzed the data. E.G.C., F.V.C., D.C.C., Esch, C., J. P. Jimenez, C. Peretz, H. Uno, and S. O’Donnell. 2017. Thermal
and M.P.C. wrote the manuscript and approved the final version. All authors tolerances differ between diurnal and nocturnal foragers in the ant
affirm that there are no potential conflicts of interest. Ectatomma ruidum. Insect. Soc. 64: 439–444.
Fagundes, R., D. V. Anjos, R. Carvalho, and K. Del-Claro. 2015. Availability
of food and nesting-sites as regulatory mechanisms for the recovery of ant
References Cited diversity after fire disturbance. Sociobiology. 62: 1–9.
Alvares, C. A. L., P. C. Sentelhas, J. L. de Moraes Gonçalves, and G. Sparovek. Fernandes, G. W., H. A. Almeida, C. A. Nunes, J. H. A. Xavier, N. S. Cobb,
2013. Köppen’s climate classification map for Brazil. Meteorol. Z. 22: M. A. A. Carneiro, T. Cornelissen, F. S. Neves, S. P. Ribeiro, Y. R. F. Nunes,
711–728. et al. 2016. Cerrado to rupestrian grasslands: patterns of species distribu-
Alves, R. J. V., N. G. Silva, J. A. Oliveira, and D. Medeiros. 2014. Circumscribing tion and the forces shaping them along an altitudinal gradient, pp. 345–
campo rupestre - megadiverse Brazilian rocky montane savanas. Braz. J. 377. In G. W. Fernandes (ed.), Ecology and conservation of mountaintop
Biol. 74: 355–362. grasslands in Brazil. Springer, Cham.
Arnan, X., N. Blüthgen, R. Molowny-Horas, and J. Retana. 2015. Thermal Fitzpatrick, G., M. C. Lanan, and J. L. Bronstein. 2014. Thermal toler-
characterization of European ant communities along thermal gradients ance affects mutualist attendance in an ant-plant protection mutualism.
and its implications for community resilience to temperature variability. Oecologia. 176: 129–138.
Front. Ecol. Evol. 3: 138. García-Robledo, C., H. Chuquillanqui, E. K. Kuprewicz, and F. Escobar‐Sarria.
Baccaro, F. B., R. M. Feitosa, F. Fernandez, I. O. Fernandes, T. J. Izzo, 2018. Lower thermal tolerance in nocturnal than in diurnal ants: a challenge
J. L. P. Souza, and R. Solar. 2015. Guia para os gêneros de formigas do for nocturnal ectotherms facing global warming. Ecol. Entomol. 43: 162–167.
Brasil. Editora INPA, Manaus, Brazil. 388 pp. Ghalambor, C. K., R. B. Huey, P. R. Martin, J. J. Tewksbury, and G. Wang.
Bishop, T. R., M. P. Robertson, B. J. van Rensburg, and C. L. Parr. 2014. 2006. Are mountain passes higher in the tropics? Janzen’s hypothesis re-
Elevation–diversity patterns through space and time: ant communities of visited. Integr. Comp. Biol. 46: 5–17. Environmental Entomology, 2020, Vol. XX, No. XX
Gibb, H., N. J. Sanders, R. R. Dunn, S. Watson, M. Photakis, S. Abril, McGill, B. J., B. J. Enquist, E. Weiher, and M. Westoby. 2006. Rebuilding com-
A. N. Andersen, E. Angulo, I. Armbrecht, X. Arnan, et al. 2015. Climate munity ecology from functional traits. Trends Ecol. Evol. 21: 178–185.
mediates the effects of disturbance on ant assemblage structure. Proc. Biol. Narendra, A., S. F. Reid, and J. M. Hemmi. 2010. The twilight zone: am-
Sci. 282: 20150418. bient light levels trigger activity in primitive ants. Proc. Biol. Sci. 277:
Giulietti, A. M., J. R. Pirani, and R. M. Harley. 1997. Espinhaço range 1531–1538.
region-eastern Brazil, pp. 397–404. In S. D. Davis, V. H. Heywood, Nelson, A. S., T. Scott, M. Barczyk, T. P. McGlynn, A. Avalos, E. Clifton, and
O. Herrera-Mac Bryde, J. Villa-Lobos, and A. C. Hamilton (eds.), Centers S. Pahlke. 2018. Day/night upper thermal limits differ within Ectatomma
of plant diversity: a guide and strategy for their conservation. Oxford, ruidum ant colonies. Insect. Soc. 65: 183–189.
Information Press, Oxford, UK. Nondillo, A., L. Ferrari, S. Lerin, O. C. Bueno, and M. Bottona. 2014.
Hoffmann, A. A., S. L. Chown, and S. Clusella-Trullas. 2013. Upper thermal limits Foraging activity and seasonal food preference of Linepithema micans
in terrestrial ectotherms: how constrained are they? Funct. Ecol. 27: 934–949. (Hymenoptera: Formicidae), a species associated with the spread of
Jayatilaka, P., A. Narendra, S. F. Reid, P. Cooper, and J. Zeil. 2011. Different ef- Eurhizococcus brasiliensis (Hemiptera: Margarodidae). J. Econ. Entomol.
fects of temperature on foraging activity schedules in sympatric Myrmecia 107: 1385–1391.
ants. J. Exp. Biol. 214: 2730–2738. Pie, M. R. 2016. The macroevolution of climatic niches and its role in ant di-
Kaspari, M. 1993. Body size and microclimate use in Neotropical granivorous versification. Ecol. Entomol. 41: 301–307.
ants. Oecologia. 96: 500–507. R Development Team. 2018. R: language and environment for statistical com-
Kaspari, M., and M. D. Weiser. 2000. Ant activity along moisture gradients in puting. R Foundation for Statistical Computing, Vienna, Austria. http://
a neotropical forest. Biotropica. 32: 703–711. www.R-project.org/.
Kaspari, M., N. A. Clay, J. Lucas, S. P. Yanoviak, and A. Kay. 2015. Thermal Sanders, N. J., J. P. Lessard, M. C. Fitzpatrick, and R. R. Dunn. 2007.
adaptation generates a diversity of thermal limits in a rainforest ant com- Temperature, but not productivity or geometry, predicts elevational di-
munity. Glob. Chang. Biol. 21: 1092–1102. versity gradients in ants across spatial grains. Glob. Ecol. Biogeogr. 16:
Kaspari, M., J. Bujan, K. A. Roeder, K. de Beurs, and M. D. Weiser. 2019. 640–649.
Species energy and thermal performance theory predict 20-yr changes in Sheriff, M. J., H. Wheeler, S. A. Donker, C. J. Krebs, R. Palme, D. S. Hik, and
ant community abundance and richness. Ecology. 100: e02888. R. Boonstra. 2012. Mountaintop and valley bottom experiences: the stress
Kinzner, M. C., A. Gamisch, A. A. Hoffmann, B. Seifert, M. Haider, axis as an integrator of environmental variability in arctic ground squirrel
W. Arthofer, B. C. Schlick-Steiner, and F. M. Steiner. 2019. Major range populations. J. Zool. 287: 65–75.
loss predicted from lack of heat adaptability in an alpine Drosophila spe- Silveira, F. A. O., D. Negreiros, N. P. U. Barbosa, E. Buisson, F. F. Carmo,
cies. Sci. Total Environ. 695: 133753. D. W. Carstensen, A. A. Conceição, T. G. Cornelissen, L. Echternacht,
Körner, C. 2007. The use of ‘altitude’ in ecological research. Trends Ecol. Evol. G. W. Fernandes, et al. 2016. Ecology and evolution of plant diversity in
22: 569–574. the endangered campo rupestre: a neglected conservation priority. Plant
Kühsel, S., and N. Blüthgen. 2015. High diversity stabilizes the thermal resili- Soil. 403: 129–152.
ence of pollinator communities in intensively managed grasslands. Nat. Sunday, J. M., A. E. Bates, M. R. Kearney, R. K. Colwell, N. K. Dulvy,
Commun. 6: 79–89. J. T. Longino, and R. B. Huey. 2014. Thermal-safety margins and the ne-
Laliberté, E., A. Paquette, P. Legendre, and A. Bouchard. 2009. Assessing the cessity of thermoregulatory behavior across latitude and elevation. Proc.
scale-specific importance of niches and other spatial processes on beta di- Natl. Acad. Sci. USA. 111: 5610–5615.
versity: a case study from a temperate forest. Oecologia. 159: 377–388. Sundqvist, M. K., N. J. Sanders, and D. A. Wardle. 2013. Community and
Lessard, J. P., R. R. Dunn, and N. J. Sanders. 2009. Temperature-mediated ecosystem responses to elevational gradients: processes, mechanisms, and
coexistence in temperate forest ant communities. Insect. Soc. 56: 149–156. insights for global change. Annu. Rev. Ecol. Evol. Syst. 44: 261–280.
McGeoch, M. A., B. J. Van Rensburg, and A. Botes. 2002. The verification Wittman, S. E., N. J. Sanders, A. M. Ellison, E. S. Jules, J. S. Ratchford, and
and application of bioindicators: a case study of dung beetles in a savanna N. J. Gotelli. 2010. Species interactions and thermal constraints on ant
ecosystem. J. Appl. Ecol. 39: 661–672. community structure. Oikos. 119: 551–559.You can also read