Thermal Bridging Through Branches of Snow-Covered Shrubs Cool Down Permafrost in Winter
←
→
Page content transcription
If your browser does not render page correctly, please read the page content below
Thermal Bridging Through Branches of Snow-Covered
Shrubs Cool Down Permafrost in Winter
Florent Domine ( florent.domine@gmail.com )
Université Laval https://orcid.org/0000-0001-6438-6879
Kevin Fourteau
Météo France https://orcid.org/0000-0002-9905-2446
Ghislain Picard
Université Grenoble-Alpes
Georg Lackner
Université Laval https://orcid.org/0000-0002-5390-8034
Denis Sarrazin
Université Laval
Mathilde Poirier
Université Laval
Article
Keywords: Arctic tundra, permafrost, shrub branches
DOI: https://doi.org/10.21203/rs.3.rs-679013/v1
License: This work is licensed under a Creative Commons Attribution 4.0 International License. Read
Full License
Page 1/20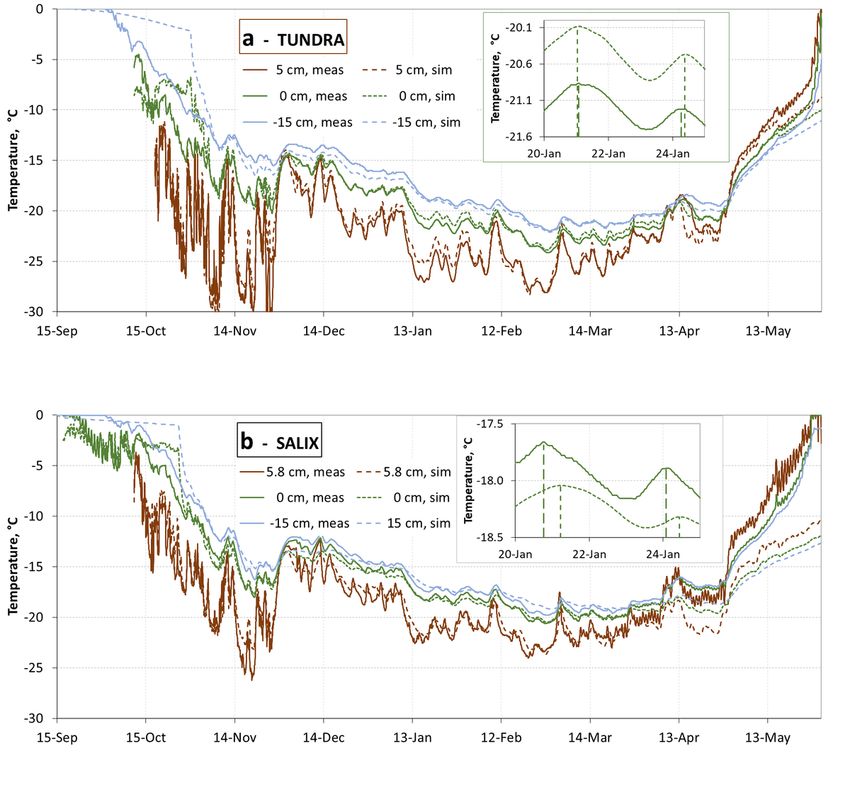
Abstract
Warming-induced shrub expansion on Arctic tundra (Arctic greening) is thought to warm up permafrost by
several degrees, as shrubs trap blowing snow and increase snowpack thermal insulation, limiting permafrost
winter cooling and facilitating its thaw. At Bylot Island, (Canadian high Arctic, 73°N) we monitored permafrost
temperature at nearby unmanipulated herb tundra and shrub tundra sites and unexpectedly observed that low
shrubs cool permafrost by 1.21°C over the November-February period. This is despite a snowpack twice as
insulating in shrubs. Using heat transfer models and finite-element simulations, we show that this winter
cooling is caused by thermal bridging through frozen shrub branches. This effect largely compensates the
warming effect induced by the more insulating snow in shrubs. The cooling is partly canceled in spring when
shrub branches under snow absorb solar radiation and accelerate permafrost warming. The overall effect is
expected to depend on snow and shrub characteristics and terrain aspect. These significant perturbations of
the permafrost thermal regime by shrub branches should be considered in projections of permafrost thawing,
nutrient recycling and greenhouse gas emissions.

Introduction
Permafrost stores about 1400 Pg of frozen carbon mostly in the form of decomposing vegetal material1.
Permafrost thaw accelerates the metabolism of soil microbes, increasing the release of the greenhouse gases
(GHG) CO2 and CH4 (Ref.2). The rate of thawing is affected by little-understood feedbacks. Shrub expansion in
the Arctic, a.k.a. Arctic greening3, is suspected of accelerating permafrost thaw by increasing snow
accumulation4,5, which insulates permafrost from the cold winter air. Reduced winter cooling facilitates
permafrost thaw. Furthermore, shrubs enhance snowpack insulation in the high Arctic by favoring the
formation of depth hoar, a highly insulating snow type, at the expense of more conductive wind slabs that
prevail over wind-swept herb tundra5,6.

Several Arctic field observations and manipulations indicate that shrub expansion leads to permafrost winter
warming. Sturm et al.5 observed that in shrubs, the snow was 60% more insulating at shrubs sites than at
tussock tundra sites, resulting in 3°C warmer soils. Myers-Smith and Hik7 placed dead shrubs on open tundra,
resulting in topsoil warming by 4 to 5°C in January. Grünberg et al.8 measured March temperatures about
2.5°C and 5°C warmer under dwarf shrubs and tall shrubs, respectively, than under lichen. In these three
studies, snow at shrub sites was thicker than in the absence of shrubs.

At Bylot Island (73°N) Domine et al.6 observed a greater proportion of depth hoar in willow shrubs (Salix
richardsonii) and measured mean snow thermal conductivities 29% lower in willows than on herb tundra.
They however did not note thicker snow in willows. They modeled the permafrost thermal regime under
willows and under herb tundra, accounting for snow differences, and concluded that minimum winter
permafrost temperature should be 7 to 13°C warmer under willows. This large shrub-induced warming
motivated the installation of instruments at shrub and tundra sites to test these model predictions. Three
years of monitoring, reported here, contradict predictions and show that shrubs lead to permafrost cooling in
winter. Here, we propose a new process, currently not considered in permafrost process studies and models9,
to explain these novel observations. We propose that at Bylot Island frozen shrub branches, which extend to or

                                                   Page 2/20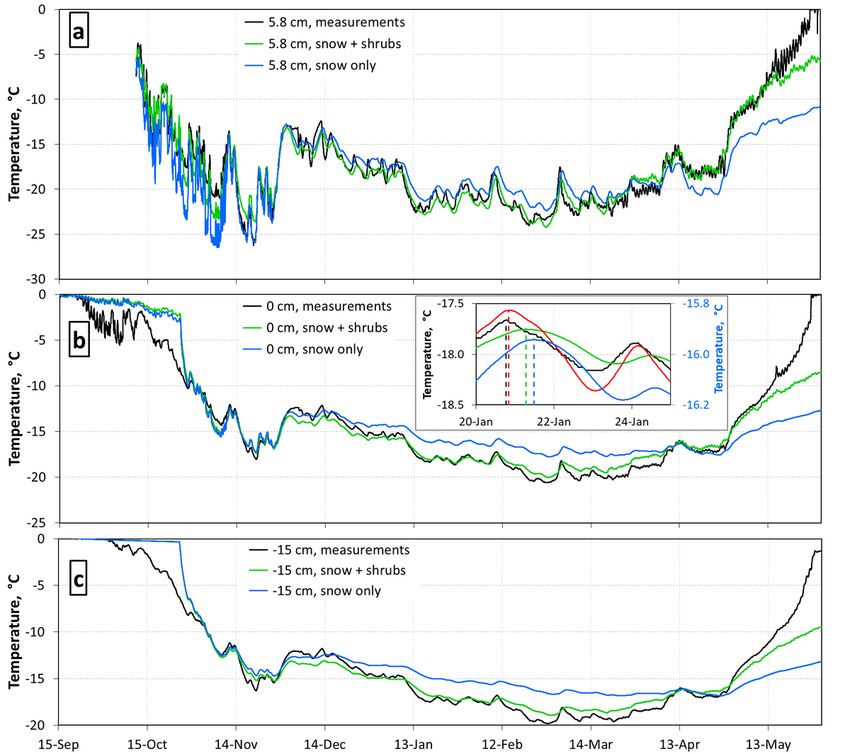
near the snowpack surface and which conduct heat about 20 times better than snow (see Methods) act as
highly conducting thermal bridges that enhance permafrost cooling in winter, overriding the effect of the more
insulating snowpack. In spring, a second novel process is detected: buried branches absorb solar radiation
under the snow and conduct heat to the ground, accelerating soil spring warming. Figure 1 Illustrates these
new processes. In current models, the omission of conduction through, and radiation absorption by branches
underestimates cooling in winter and underestimates warming in spring. The reality of the permafrost thermal
regime under shrubs is not captured, with consequence on permafrost temperature9, nutrient recycling10–12,
plant development13, GHG winter emissions14–16, geomorphological changes17, resulting in the inaccurate
quantification of the Arctic greening-permafrost-climate feedback5.

Study Site And Environment
We worked in Qarlikturvik valley, Bylot Island, north of Baffin Island in the Canadian high Arctic (Fig. S1 and S2
and additional details in Supplementary Material). We selected a herb tundra site and a shrub site with 35 to
40 cm-high willows, 9 km apart. The shrub site (called SALIX) is up-valley relative to the herb site (called
TUNDRA). TUNDRA is at the bottom of the valley while SALIX is up on a bank about 5 m higher than the bed
of the braided glacial river. TUNDRA is near the middle of a low-center polygon. The general topography is
almost flat, with a slope of about 1° with NNW aspect. SALIX, on a slope of about 3° with N aspect, is downhill
of an alluvial fan with flow channels active during melt and heavy rains, a few meters from SALIX.

Field Results
Between 2016 and 2019, we obtained three years of meteorological, snow and soil data including snow and
soil thermal conductivity and temperature, and soil liquid water content, all of these variables at several
heights or depths. Field measurements of snow properties were made in mid-May 2017, 2018 and 2019. Field
measurements of soil thermal conductivity and density were performed in summer 2016 and 2017 and soil
granulometric analyses were performed in the laboratory (Fig. S3). This paper details data from the 2018-
2019 snow season, as other years revealed similar processes. Fig. 2 shows the evolution of snow depth,
revealing no major difference between both sites. The air temperature drops below -40°C every winter. It is
colder at TUNDRA in winter, by up to 5.44°C for weekly mean temperature (Fig. 3a). The hourly wind speed
averaged over the study was 1.98 m s-1 at TUNDRA and 1.43 m s-1 at SALIX, with values seldom exceeding 10
m s-1.

Fig. 3b reports the evolution of the snowpack thermal insulance RT, (also sometimes called thermal
resistance) calculated (see Methods) using the thermal conductivity profiles shown in Fig. S4. In these
calculations, the thermal effects of shrubs are not included when we consider snowpack insulance. Given the
much greater thermal insulance at SALIX, the temperature of the ground is expected to be much higher at
SALIX, as simulated earlier6, and observed elsewhere by others5. Fig. 3c shows the ground temperature at 15
cm depth at both sites. Between 1 November 2018 and 1 April 2019, the ground temperature is on average
1.97°C warmer at SALIX. However, over this period the air temperature at SALIX is 2.56°C warmer than at
TUNDRA (Fig. 3a), meaning that for an equal air temperature, the ground temperature is 0.59°C colder at
SALIX (Fig. 3d), despite the much more insulating snowpack. The presence of shrubs therefore cools the

                                                    Page 3/20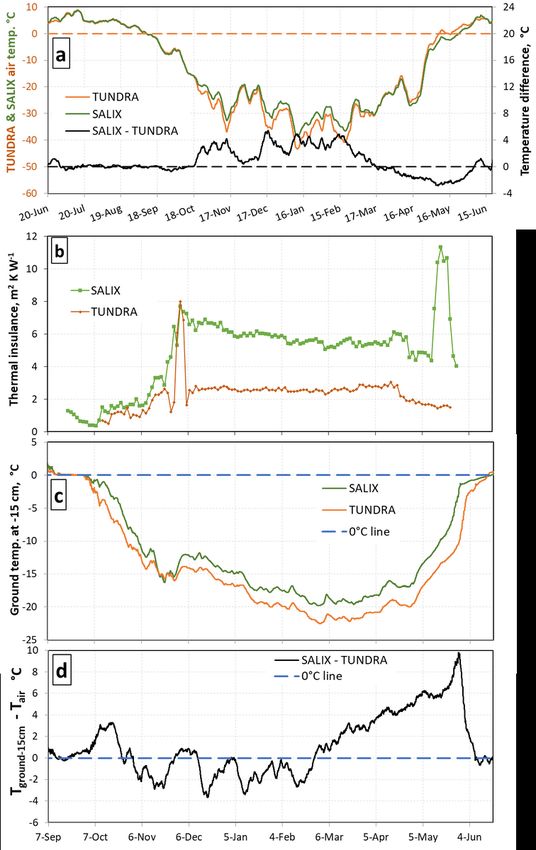
ground. Fig. 3d shows that between 24 October 2018 and 24 February 2019, the air-ground temperature
difference is lower at SALIX, implying more efficient ground cooling there. On 18 December 2018, the ground
cooling is 3.66°C more efficient at SALIX than at TUNDRA. Fig 3c reveals that between 13 October and 21
November, the ground cools much faster at SALIX than at TUNDRA, with a decrease of 15.2°C at SALIX vs
only 11.9°C at TUNDRA, again despite the greater snow depth and thermal insulance at SALIX. Fig. S5
presents similar data for the snow-ground interface, with similar conclusions. The first line of Table 1 sums up
ground temperature differences between SALIX and TUNDRA for various time periods.

Soil properties affect the permafrost thermal regime9 and were investigated. Ground thermal conductivities
(Fig. S6) showed essentially one value when thawed and one value when frozen. Field measurements of the
soil were made in July 2016 and 2017 at SALIX and TUNDRA (see Supplementary Material). Briefly, density
profiles from several pits at both sites revealed similar density values in the range 1000 to 1850 kg m-3,
increasing with depth down to the freezing level. Thermal conductivities values increased from 0.25 to 1.7 W
m-1 K-1 at 25 cm depth. Soil granulometry (Fig. S3) identified sandy silt and silty sand with fairly similar size
distributions at both sites. In summary, given variations between nearby spots at each site, there does not
appear to be any significant difference in soil density, thermal conductivity and granulometry between
TUNDRA and SALIX.

Field observations of snow were made near both sites in mid-May 2019. Density profiles from two pits at each
site are shown in Fig. S7. The average density of the SALIX pits was 267 kg m-3 vs 317 kg m-3 at TUNDRA,
19% greater than SALIX, similar to earlier observations18,19. Since density and thermal conductivity are
positively correlated20-23, the greater density observed at TUNDRA is consistent with monitored thermal
conductivities. All pits had a basal depth hoar layer 10 to 25 cm thick, slightly denser and with smaller grains
at TUNDRA than at SALIX. Upper layers at SALIX were mostly faceted crystals with an occasional thin top
wind-packed layer. At TUNDRA, the upper snowpack was mostly a wind slab. Photographs of the May 2019
snowpits are not available. Instead Fig. S8 shows photographs of May 2015 snowpits, when snow conditions
were similar18.

Additional indications of a heat transfer process other than conduction through snow are provided. Fig. S9a
(and additional details in Supplementary Material) shows that diurnal temperature variations in spring are
propagated through the snowpack to the snow-ground interface much faster at SALIX than TUNDRA, again
despite the much more insulating SALIX snowpack. Fig. S9b shows that the heat flux F through the basal
layer of the TUNDRA snowpack, calculated as F=-ÑT x keff, where ÑT is the temperature gradient and keff the
thermal conductivity of the snow layer shown in Fig. S4c, is almost always much greater at TUNDRA than at
SALIX between 11 October and 22 November. Despite this greater heat flux, the snowpack cools more slowly
at TUNDRA than at SALIX. These considerations lead to the conclusion that conductive heat fluxes through
snow only cannot explain observations and that another process comes into play at SALIX.

We hypothesized that heat conduction through frozen shrub branches could explain our observations and
performed simulations to test this. In a first approach, we simulated heat transfer through snow only, to verify
that it could explain the temperature data at TUNDRA but not at SALIX. In a second stage we performed finite
element simulations of heat transfer through both snow and shrubs at SALIX.

                                                     Page 4/20
Heat Transfer Simulations
The thermal regime of the snow and ground at TUNDRA was simulated with the MFM model24,25 using
measured values of thermal variables (Table S1). Snow thermal conductivity values were multiplied by 1.2 to
account for the underestimation of the needle probe method26. The model simulates the snow and ground
temperatures mostly within less than 1°C and always within less than 2°C (Fig. 4a), except during ground
freezing in September, as the model does not simulate the water phase change. An artificially high ground
heat capacity was used until freezing completion (Table S1). Once the resulting perturbation is over,
simulations reproduce data well. Furthermore, the phase of the temperature changes is reproduced within a
few hours (Fig. 4a, inset). The simulations are excellent in spring until about mid-May, when snowmelt
dramatically modifies all snow properties, which is not simulated.
At SALIX, to satisfactorily reproduce temperature data (Fig. 4b), measured keff values had to be multiplied by
1.4 for the period until 31 December and then by 1.7. Furthermore, thermal waves are propagated about 12
hours later in simulations than in measurements at the snow-ground interface. This confirms that a heat
transfer process other than conduction in snow is taking place.
Faster cooling can be simulated by lowering the soil density and/or heat capacity or increasing the soil
thermal conductivity9 by over 60%, which is inconsistent with field measurements. Furthermore, thermal
waves were still propagated 12 hours late. It is thus reasonable to propose heat transfer through shrub
branches, rather than soil properties very different from measured values, as an extra involved process.
Starting around mid-April, simulated temperatures are much lower than measured ones at SALIX: 3.5°C lower
at 15 cm depth on 10 May, before the onset of melting on 12 May. Another heat transfer process therefore
now warms up the snow and the ground. Since branches do not protrude above the snow until 12 May, as
revealed by time-lapse images (Fig. S10), processes such as decreased albedo, evidenced for tall shrubs and
which accelerate snowmelt27,28, do not operate efficiently here. We instead propose that solar radiation
transmitted through the snow heats up buried branches, and this heat diffuses to the ground through the
branches. Starting on 18 April, daily radiation maxima exceed 500 W m-2 and 24-h averages reach 200 W m-2
(Ref.29). The e-folding depth for visible radiation in Arctic snow is in the 5 to 15 cm range30. Over 50% of
incident radiation energy is in the visible, meaning that a daily average radiative flux of about 50 W m-2 is
likely in snow at SALIX at 10 cm depth. Arctic shrub branches have an albedo < 0.1 in the visible31,32, so that
shrubs likely absorb significant energy.
We therefore performed finite-element simulations of heat transfer through the (snow + shrubs) system,
considering heat conduction through branches and radiation absorption by buried branches in spring. Figure 5
shows results with the data for the (snow + shrubs) calculation made for a spot halfway between two shrubs
(green dot, Fig. S11). Comparing simulations with and without shrubs shows that the maximum shrub cooling
effect of the ground at 15 cm depth is 2.29°C on 27 February (Fig. S12). For the snow-ground interface, the
maximum cooling is 2.30°C, also on 27 February. In spring, however, shrubs warm the ground, by 1.91°C on 10
May (Fig. S12). Beyond that date, simulations and measurements start diverging because snow temperature
is close to or reaches 0°C and our simulations do not consider melting.
Page 5/20Regarding the phase of the temperature changes (inset of Fig. 5b), simulations which include just snow lag
measurements by 16 h. Simulations with both snow and shrubs still show a lag of 12 h. However, simulations
for a spot in the middle of a shrub rather that half-way between two shrubs (respectively red and green dots in
Fig. S11) reduced the lag to 1 to 2 h. Since our interface temperature sensor is quite close from the middle of
a shrub (about 10 cm), we conclude that our measurements are well simulated by including conduction
through frozen shrub branches.
The simulated cooling effect of shrubs on the ground at 15 cm depth lasts until 20 April (Figs. 5c and S12).
Between 1 December and 20 April, the average cooling effect of shrubs is 1.40°C. Between 20 April and 10
May, the average warming is 1.02°C. These values are summed up in the second line of Table 1. Overall,
between 24 October (when the effect of shrubs starts to manifest itself, Fig. S12) and 10 May, the average
effect of shrubs is a cooling of 0.95°C. However, since our model does not consider snow melt, we cannot
perform simulations beyond that date. Simulating warming due to protruding branches and their shading
effect would also be required. In any case, we demonstrate that shrubs significantly modify the yearly
evolution of the ground temperature, with significant cooling in winter and significant warming in spring. It is
noteworthy that despite the warming effect of shrubs, meltout at SALIX and TUNDRA were nearly
simultaneous: 7 June at TUNDRA and 9 June at SALIX, suggesting that cooling effects such as branch
shading may also take place in spring.
Discussion
In this study, we have detected two novel processes involving shrubs: one that cools the ground in winter by
thermal bridging through frozen branches, and one that warms the ground in spring by transmitting heat from
solar radiation. Most previous studies of Arctic ground temperature as a function of vegetation cover5,7,8,33−35
limited their physical measurements to ground temperature and snow depth, making the detection of these
effects very difficult. Most manipulations were not designed for this detection either. For example, adding
dead shrubs7, of much lower thermal conductivity than live shrubs, could not produce the effects observed
here. The 3°C warming under shrubs observed by Sturm et al.5 in winter in fact does not negate the cooling
impact of shrubs, which in their case induced a thicker and much more insulating snowpack. That snowpack
should lead to a much greater warming than 3°C (Ref.6), which was mitigated by the ground heat loss through
shrub branches.
The accelerated early winter cooling by shrubs blocks nutrients recycling and favors carbon accumulation36,
while the opposite effect is expected in spring. The balance between winter and spring effects is expected to
be highly variable depending on the site and on shrub properties. For example, sites with northern aspect will
be less affected by spring radiative heating, especially given the low sun angles in the Arctic, and branch
densities will impact the magnitude of shrub effects.
Microbial respiration occurs down to about − 20°C14–16, resulting in GHG emissions. Based on a compilation
of winter CO2 fluxes15 as a function of soil temperature, a 5°C temperature drop in winter due to shrubs, from
− 15 to -20°C, would reduce the CO2 flux from 0.1 to 0.055 g C m-2 d-1. For a shrub-covered area of 5 million
km2, over the November-February period, this amounts to a total flux reduced by 27 Tg C. On the contrary, a
Page 6/205°C temperature increase in April-May from − 10 to -5°C, with fluxes increasing from 0.165 to 0.265 g C m-2 d-1,
would increase the CO2 flux by 30 TgC. This latter figure is 1.9% of the estimated emissions due to land use
change at the planetary scale37. Considering these order-of-magnitude estimates and the context of shrub
expansion in the Arctic, shrub thermal bridging and radiative heating under snow deserves consideration for
inclusion in models of permafrost evolution and Arctic carbon cycling.
Materials And Methods
At TUNDRA, we monitored standard meteorological data (air temperature and relative humidity at 2.3 m
height, wind speed, long wave and short-wave radiation fluxes with a CNR4/CNF4 instrument from Kipp &
Zonen), snow depth with an ultrasonic gauge, snow surface temperature using an IR sensor, snow
temperature with thermistors and snow thermal conductivity with TP08 heated needle probes from Hukseflux.
Soil temperature, volume water content and thermal conductivity were also measured at several depths29. At
SALIX, similar instruments were deployed, except snow surface temperature, which was not monitored.
Regarding radiation, only downwelling short-wave was measured there. In snow, the TP08 needles were
placed on a vertical post at 2, 12 and 22 cm heights at TUNDRA and at 3, 13 and 26 cm heights at SALIX. The
heights were a bit greater at SALIX because in May 2015, a year prior to the installation of SALIX in July 2016,
we observed that the snowpack at SALIX was a bit thicker6 and we wanted to probe equivalent layers. At
SALIX, we ensured that the TP08 needles were not in direct contact with shrubs branches. At TUNDRA, another
vertical post about 2 m from the TP08 post held thermistors at 0, 5, 15, 25 and 35 cm heights. At SALIX,
thermistors were placed on the TP08 post at 0 and 5.8 cm heights. In the ground, TP08 needles were placed at
10 cm depth at TUNDRA and 5 and 15 cm depth at SALIX. Ground temperature and volume water content
sensors were placed at 5, 15 and 30 cm depth at SALIX and at 2, 5, 10, 15 and 21 cm depth at TUNDRA. The
shallower thawed layer at TUNDRA prevented the installation of deeper sensors. Note that the thicker thawed
layer at SALIX is not necessarily an indication of greater heat conduction in summer, as SALIX is at the base
of an alluvial fan with significant water flow that may contribute to summer ground thaw by heat advection.
Time lapse cameras taking several pictures a day were placed at both sites with the TP08 posts in their field
of view. Photographs of both sites showing the posts are included in Fig. S2. Field observations of snow
stratigraphy and measurements of vertical density profiles were performed near the TUNDRA and SALIX sites
in mid-May in 2017, 2018 and 2019. Density profiles were measured with a 3-cm vertical resolution by
weighing snow samples taken with a 100 cm3 density cutter. Field observations of soil density, thermal
conductivity and liquid water content were performed at various locations around both study sites in early
July 2016 and 2017. Soil samples were brought back to Laval University for granulometric analysis using a
laser particle size counter. Soil properties at TUNDRA are detailed in Domine et al.29.
Thermal conductivity, keff, was measured by heating the TP08 needle during 100 s and by monitoring the
temperature rise, as detailed in Domine et al.38. Briefly, the plot of the temperature rise as a function of
log(time), after a transition period of about 15 s, yields a straight line whose slope is inversely proportional to
keff. One measurement is performed every two days to minimize the energy input to the snow and because keff
variations are usually slow. Since the measurement requires heating, it is disabled if the snow temperature is
above -2.5°C to avoid melting and irreversible modification of the snow structure. Measurements are therefore
Page 7/20often not available in late spring. Measurements were discarded when the quality of the plot was insufficient,
as detailed in Domine et al.38. This was infrequent for snow but was frequent for the ground, especially when
frozen, because the same heating power for snow and ground had to be used with our setup, and this power
was optimized for snow. Frozen ground often has a thermal conductivity around 2 W m-1 K-1, so that the
heating of the needle is low and the quality of the plot not as good as for less conductive media such as
snow.
The thermal insulation properties of the snowpack are best summed up by its thermal insulance RT 25, with
units of m2 K W-1. RT simply relates the heat flux through the snowpack F to the temperature difference
between its surface and its base, Ttop-Tbase:
For a plane-parallel layered medium, RT is defined as:
where hi and ki are the height and thermal conductivity of layer i.
RT time series were calculated using the thermal conductivity data. The snowpack was divided into three
layers according to stratigraphies observed in May, with layer boundaries close to 10 and 20 cm heights. The
thermal conductivity of each layer was assumed homogeneous.
Simulations of the snow and ground temperature evolutions were performed with the Minimal Firn Model
(MFM) detailed in Picard et al.24, which uses a Crank-Nicholson scheme to calculate heat propagation through
the snow and soil. The model driving data were hourly measurements of snow surface temperature at
TUNDRA. At SALIX, snow surface temperature was not available. We used TUNDRA surface temperature
corrected by the difference in air temperature between both sites. The snowpack was divided into three
homogeneous layers between 0-10, 10-20 and 20-38 cm heights. The ground was divided into two layers
between 0-10 and 10-500 cm depths. Ground densities rg were measured at several spots close to our study
sites using a cylindrical density cutter. In MFM simulations, rg values were adjusted within the measured
ranges to optimize the fits (Table S1). Specific heat Cp values were likewise adjusted around values following
the data of Inaba39. Ground thermal conductivities kg were based on measurements. It is important to note
that the rate of cooling of the ground depends on its thermal diffusivity ag=kg /(rg Cp) so that different
combinations producing the same ag values yield similar fits. Measured snow depth evolutions were used,
simplified by using a step-wise function with seven time-intervals over the season at TUNDRA and eight
intervals at SALIX. It has been proposed that snow thermal conductivity ks measurements using heated needle
probes may show a systematic negative bias of 10 to 50%, depending on snow type26. We therefore used our
measured snow thermal conductivity values multiplied by 1.2. MFM does not simulate water phase changes
Page 8/20and thus cannot simulate the ground zero-curtain period, i.e. the period during which the ground remains at
0°C while its water freezes. Instead, we tested that using a ground specific heat value of 600 kJ kg-1 K-1 during
the zero-curtain period reproduced measurements well.
Modeling of heat transfer through shrub branches was done by finite-element simulations using the open
source ElmerFEM software40. The shrub geometry used is illustrated in Fig. S11. It attempted to reasonably
mimic observations (Fig. S2). Three levels of branches were used, with diameters 3 cm, 2.3 cm, and 1.36 cm.
The branches extend to a height of 38 cm and the center of both shrubs are 64 cm apart.
The Finite Element mesh was generated using the gmsh software41. The simulation was run with an hourly
time-step and forced with snow surface temperature, similarly to the MFM simulations. In the simulation, the
absorption of solar radiation by the shrub branches was simulated by adding a heat source in the upper
branches. The heat source was chosen so that the total energy absorbed by the shrubs equals 0.25% of the
total downwelling short-wave flux over the snow surface. This 0.25% fraction was adjusted in order to
reproduce the snow and ground warming in spring.
These simulations required to specify a value for the thermal conductivity of shrub branches. There does not
appear to be any measurement of the thermal conductivity of live or fresh wood at subfreezing temperatures.
Faouel et al.42 measured the thermal conductivity and diffusivity of samples from temperate and tropical
wood species, wet or dry. They found that the axial thermal properties were much larger than radial and
tangential ones. For ash (Fraximus), the one temperate species studied, they measured k=0.9 W m-1 K-1
and a=7.1x10⁻⁷ m2 s-1. Other studies all found that axial conductivity was greatest and measured axial
conductivity values between 0.5 and 1 W m-1 K-1 for wet wood43-45. Since ice thermal conductivity is 4 times
that of water, branch freezing is likely to lead to an increase in thermal conductivity. Supercooling does take
place in shrub branches but not does not seem to reach -20°C 46,47, to which the shrubs of interest here are
exposed. Cold-exposed shrubs have developed adaptations where freezing of water takes place in the
extracellular space 46,47, but ice does form so that an increase in shrub thermal conductivity upon freezing is
likely and we thus tested the impact of shrubs whose branches have thermal conductivity values of 1 and 2 W
m-1 K-1. For the shrub geometry used, best results were obtained for a value of 2 W m-1 K-1. In comparison,
data obtained here on snow thermal conductivity show all winter values to be < 0.1 W m-1 K-1 (Fig. S4). Even if
a multiplicative factor of 1.2 is applied to account for the underestimation by the needle probe method, it
appears that shrub branches have a thermal conductivity about 20 times as large as that of snow. It is
possible that frozen wood thermal conductivity is even higher than 2 W m-1 K-1, in which case thinner
branches could be used to simulate the same thermal effects. We used a wood specific heat value of 1200 J
kg-1 K-1 48, but tested that a value of 2000 did not produce any detectable change in the simulation. The wood
density used was 900 kg m-3, but changing this value had no impact on simulations either.
Declarations
Data and materials availability
Page 9/20All meteorological, snow and soil data for the TUNDRA site are detailed in Domine et al.29 and the data files
are available at https://doi.org/10.5885/45693CE-02685A5200DD4C38. A paper and data files for the SALIX
site are being prepared. A paper will be submitted to Earth System Science Data, with indication of the
repository where files can be accessed. Until then, SALIX data will be supplied by the corresponding author
upon request. The MFM code is available at http://github.com/ghislainp/mfm. The specific driver to perform
the simulations presented here will be made available at https://github.com/ghislainp/mfm-bylot upon
publication.
Acknowledgments
This work was funded by the Natural Sciences and Engineering Research Council of Canada (Discovery Grant
and Northern Research supplement programs), the BNP-Paribas foundation (APT project), the French Polar
Institute (IPEV, program 1042), the European Commission (INTAROS project). Logistical support was provided
by the Polar Continental Shelf Program and by Sirmilik National Park. We thank Mikael Gagnon for the soil
density measurements and granulometric analyses. Maé Picard kindly drafted Fig. 1. We are grateful to Gilles
Gauthier and Marie-Christine Cadieux for their decades-long efforts to build and maintain the research base of
the Centre d’Études Nordiques at Bylot Island. We thank Parks Canada and the community of Mittimatalik
(Pond Inlet) for permission to perform the research.
Author contributions
FD designed research and obtained funding. DS and FD deployed and maintained instruments. GL analyzed
the thermal conductivity data and performed exploratory heat transfer calculations. KF set up and performed
the finite-element calculations. GP set up the MFM heat transfer code and FD performed simulations. MP and
FD performed the field work. FD analyzed the data and wrote the paper with inputs from KF and GP. All
authors commented on the manuscript.
Competing interests
All authors declare they have no competing interests.
References
1. Hugelius, G. et al. Estimated stocks of circumpolar permafrost carbon with quantified uncertainty ranges
and identified data gaps. Biogeosciences 11, 6573–6593, doi:10.5194/bg-11-6573-2014 (2014).
2. Schuur, E. A. G. et al. Climate change and the permafrost carbon feedback. Nature 520, 171–179,
doi:10.1038/nature14338 (2015).
3. Ju, J. C. & Masek, J. G. The vegetation greenness trend in Canada and US Alaska from 1984–2012
Landsat data. Remote Sens. Environ. 176, 1–16, doi:10.1016/j.rse.2016.01.001 (2016).
4. Sturm, M. et al. Winter biological processes could help convert arctic tundra to shrubland. Bioscience 55,
17–26 (2005).
5. Sturm, M. et al. Snow-shrub interactions in Arctic tundra: A hypothesis with climatic implications. J. Clim.
14, 336–344, doi:10.1175/1520-0442(2001)0142.0.co;2 (2001).
Page 10/206. Domine, F., Barrere, M. & Morin, S. The growth of shrubs on high Arctic tundra at Bylot Island: impact on
snow physical properties and permafrost thermal regime. Biogeosciences 13, 6471–6486,
doi:10.5194/bg-13-6471-2016 (2016).
7. Myers-Smith, I. H. & Hik, D. S. Shrub canopies influence soil temperatures but not nutrient dynamics: An
experimental test of tundra snow-shrub interactions. Ecology and Evolution 3, 3683–3700,
doi:10.1002/ece3.710 (2013).
8. Grünberg, I., Wilcox, E. J., Zwieback, S., Marsh, P. & Boike, J. Linking tundra vegetation, snow, soil
temperature, and permafrost. Biogeosciences 17, 4261–4279, doi:10.5194/bg-17-4261-2020 (2020).
9. Loranty, M. M. et al. Reviews and syntheses: Changing ecosystem influences on soil thermal regimes in
northern high-latitude permafrost regions. Biogeosciences 15, 5287–5313, doi:10.5194/bg-15-5287-2018
(2018).
10. Saccone, P. et al. The effects of snowpack properties and plant strategies on litter decomposition during
winter in subalpine meadows. Plant and Soil 363, 215–229, doi:10.1007/s11104-012-1307-3 (2013).
11. Morison, M. Q., Macrae, M. L., Petrone, R. M. & Fishback, L. Climate-induced changes in nutrient
transformations across landscape units in a thermokarst subarctic peatland. Arct. Antarct. Alp. Res. 50,
doi:10.1080/15230430.2018.1519366 (2018).
12. Mack, M. C., Schuur, E. A. G., Bret-Harte, M. S., Shaver, G. R. & Chapin, F. S. Ecosystem carbon storage in
arctic tundra reduced by long-term nutrient fertilization. Nature 431, 440–443, doi:10.1038/nature02887
(2004).
13. Buckeridge, K. M. & Grogan, P. Deepened snow alters soil microbial nutrient limitations in arctic birch
hummock tundra. Applied Soil Ecology 39, 210–222, doi:10.1016/j.apsoil.2007.12.010 (2008).
14. Zona, D. et al. Cold season emissions dominate the Arctic tundra methane budget. Proc. Nat. Acad. Sci.
U.S.A. 113, 40–45 (2016).
15. Natali, S. M. et al. Large loss of CO2 in winter observed across the northern permafrost region. Nature
Climate Change 9, 852–857, doi:10.1038/s41558-019-0592-8 (2019).
16. Elberling, B. & Brandt, K. K. Uncoupling of microbial CO2 production and release in frozen soil and its
implications for field studies of arctic C cycling. Soil Biology & Biochemistry 35, 263–272,
doi:10.1016/s0038-0717(02)00258-4 (2003).
17. Costard, F. et al. Retrogressive Thaw Slumps on Ice-Rich Permafrost Under Degradation: Results From a
Large-Scale Laboratory Simulation. Geophys. Res. Lett. 48, e2020GL091070,
doi:https://doi.org/10.1029/2020GL091070 (2021).
18. Domine, F., Barrere, M. & Sarrazin, D. Seasonal evolution of the effective thermal conductivity of the snow
and the soil in high Arctic herb tundra at Bylot Island, Canada. The Cryosphere 10, 2573–2588,
doi:10.5194/tc-10-2573-2016 (2016).
19. Domine, F. et al. Soil moisture, wind speed and depth hoar formation in the Arctic snowpack. J. Glaciol.
64, 990–1002, doi:10.1017/jog.2018.89 (2018).
20. Sturm, M., Holmgren, J., Konig, M. & Morris, K. The thermal conductivity of seasonal snow. J. Glaciol. 43,
26–41 (1997).
Page 11/2021. Yen, Y.-C. Review of thermal properties of snow, ice, and sea ice. Report No. CRREL Report 81 – 10, 1–27
(United States Army Corps of Engineers, Hanover, N.H., USA, 1981).
22. Domine, F., Bock, J., Morin, S. & Giraud, G. Linking the effective thermal conductivity of snow to its shear
strength and its density. J. Geophys. Res. 116, F04027, doi:doi:10.1029/2011JF002000, (2011).
23. Fourteau, K., Domine, F. & Hagenmuller, P. Impact of water vapor diffusion and latent heat on the effective
thermal conductivity of snow. The Cryosphere 15, 2739–2755, doi:10.5194/tc-15-2739-2021 (2021).
24. Picard, G., Brucker, L., Fily, M., Gallee, H. & Krinner, G. Modeling time series of microwave brightness
temperature in Antarctica. J. Glaciol. 55, 537–551, doi:10.3189/002214309788816678 (2009).
25. Domine, F. et al. Major Issues in Simulating Some Arctic Snowpack Properties Using Current Detailed
Snow Physics Models: Consequences for the Thermal Regime and Water Budget of Permafrost. Journal
of Advances in Modeling Earth Systems 11, 34–44, doi:doi:10.1029/2018MS001445 (2019).
26. Riche, F. & Schneebeli, M. Thermal conductivity of snow measured by three independent methods and
anisotropy considerations. The Cryosphere 7, 217–227, doi:10.5194/tc-7-217-2013 (2013).
27. Marsh, P., Bartlett, P., MacKay, M., Pohl, S. & Lantz, T. Snowmelt energetics at a shrub tundra site in the
western Canadian Arctic. Hydrol. Processes 24, 3603–3620, doi:10.1002/hyp.7786 (2010).
28. Sturm, M., Douglas, T., Racine, C. & Liston, G. E. Changing snow and shrub conditions affect albedo with
global implications. Journal of Geophysical Research-Biogeosciences 110, G01004,
doi:10.1029/2005jg000013 (2005).
29. Domine, F., Lackner, G., Sarrazin, D., Poirier, M. & Belke-Brea, M. Meteorological, snow and soil data
(2013–2019) from a herb tundra permafrost site at Bylot Island, Canadian high Arctic, for driving and
testing snow and land surface models. Earth Syst. Sci. Data Discuss. 2021, 1–23, doi:10.5194/essd-2021-
54 (2021).
30. France, J. L. et al. Hydroxyl radical and NOx production rates, black carbon concentrations and light-
absorbing impurities in snow from field measurements of light penetration and nadir reflectivity of
onshore and offshore coastal Alaskan snow. J. Geophys. Res. 117, D00R12, doi:10.1029/2011jd016639
(2012).
31. Belke-Brea, M., Domine, F., Barrere, M., Picard, G. & Arnaud, L. Impact of Shrubs on Winter Surface Albedo
and Snow Specific Surface Area at a Low Arctic Site: In Situ Measurements and Simulations. J. Clim. 33,
597–609, doi:10.1175/jcli-d-19-0318.1 (2020).
32. Juszak, I., Erb, A. M., Maximov, T. C. & Schaepman-Strub, G. Arctic shrub effects on NDVI, summer albedo
and soil shading. Remote Sens. Environ. 153, 79–89, doi:http://dx.doi.org/10.1016/j.rse.2014.07.021
(2014).
33. Nauta, A. L. et al. Permafrost collapse after shrub removal shifts tundra ecosystem to a methane source.
Nature Clim. Change 5, 67–70, doi:10.1038/nclimate2446 (2015).
34. Wilcox, E. J. et al. Tundra shrub expansion may amplify permafrost thaw by advancing snowmelt timing.
Arctic Science 5, 202–217, doi:10.1139/as-2018-0028 (2019).
35. Blok, D. et al. Shrub expansion may reduce summer permafrost thaw in Siberian tundra. Global Change
Biology 16, 1296–1305, doi:10.1111/j.1365-2486.2009.02110.x (2010).
Page 12/2036. Lemay, E., Côté, S. D. & Tremblay, J.-P. How will snow retention and shading from Arctic shrub expansion
affect caribou food resources? Écoscience, 1–13, doi:10.1080/11956860.2021.1917859 (2021).
37. Friedlingstein, P. et al. Global Carbon Budget 2020. Earth Syst. Sci. Data 12, 3269–3340,
doi:10.5194/essd-12-3269-2020 (2020).
38. Domine, F., Barrere, M., Sarrazin, D., Morin, S. & Arnaud, L. Automatic monitoring of the effective thermal
conductivity of snow in a low-Arctic shrub tundra. The Cryosphere 9, 1265–1276, doi:10.5194/tc-9-1265-
2015 (2015).
39. Inaba, H. Experimental-study on thermal-properties of frozen soils. Cold Regions Sci. Tech. 8, 181–187,
doi:10.1016/0165-232x(83)90008-3 (1983).
40. Malinen, M. & Råback, P. in Multiscale Modelling Methods for Applications in Materials Science (eds I.
Kondov & G. Sutmann) 101–113 (Forschungszentrum Jülich GmbH, 2013).
41. Geuzaine, C. & Remacle, J.-F. Gmsh: A 3-D finite element mesh generator with built-in pre- and post-
processing facilities. International Journal for Numerical Methods in Engineering 79, 1309–1331,
doi:https://doi.org/10.1002/nme.2579 (2009).
42. Faouel, J., Mzali, F., Jemni, A. & Ben Nasrallah, S. Thermal conductivity and thermal diffusivity
measurements of wood in the three anatomic directions using the transient hot-bridge method. Special
Topics & Reviews in Porous Media-an International Journal 3, 229–237,
doi:10.1615/SpecialTopicsRevPorousMedia.v3.i3.50 (2012).
43. Turrell, F. M., Austin, S. W., McNee, D. & Park, W. J. Thermal Conductivity of Functional Citrus Tree Wood.
Plant Physiology 42, 1025–1034, doi:10.1104/pp.42.8.1025 (1967).
44. Deliiski, N. Computation of the wood thermal conductivity during defrosting of the wood. Wood Research
58, 637–649, doi:http://www.woodresearch.sk/wr/201304/13.pdf (2013).
45. Laguela, S., Bison, P., Peron, F. & Romagnoni, P. Thermal conductivity measurements on wood materials
with transient plane source technique. Thermochim. Acta 600, 45–51, doi:10.1016/j.tca.2014.11.021
(2015).
46. Squeo, F. A. et al. Cold resistance mechanisms in high desert Andean plants. Oecologia 105, 552–555,
doi:10.1007/bf00330019 (1996).
47. Zhang, Y.-J. et al. Freezing resistance in Patagonian woody shrubs: the role of cell wall elasticity and
stem vessel size. Tree Physiology 36, 1007–1018, doi:10.1093/treephys/tpw036 (2016).
48. Radmanovic, K., Dukic, I. & Pervan, S. Specific Heat Capacity of Wood. Drvna Industrija 65, 151–157,
doi:10.5552/drind.2014.1333 (2014).
Tables
able 1. Time-averaged differences in ground temperature. Values are for 15 cm depth, for
specified time periods. The first line compares observations between SALIX and TUNDRA. The
second line compares finite element simulations at SALIX for the cases with and without shrubs.
Both lines are not expected to show similar values as snow in the second line has properties for
the SALIX case while in the first line the data includes changes due to the differences in snow
properties between TUNDRA and SALIX.
Page 13/2024 Oct-24 Feb 1 Dec-20 Apr 24 Feb-10 May 20 Apr-10 May 24 Oct-10 May
Observations: effect of snow+shrubs*
SALIX – TUNDRA -1.21°C†, +0.27°C +3.39°C +5.34°C +0.53°C
Simulations at SALIX: effect of shrubs only‡
(snow+shrubs)-(snow only) -1.12°C -1.40°C -0.67°C +1.02°C -0.95°C
*Since air temperatures are not identical at both sites, ground temperature minus air temperature values have been u
†
Negative values in observations indicate colder ground at SALIX.
‡
Negative values for simulations indicate a cooling effect of shrubs.
Figures
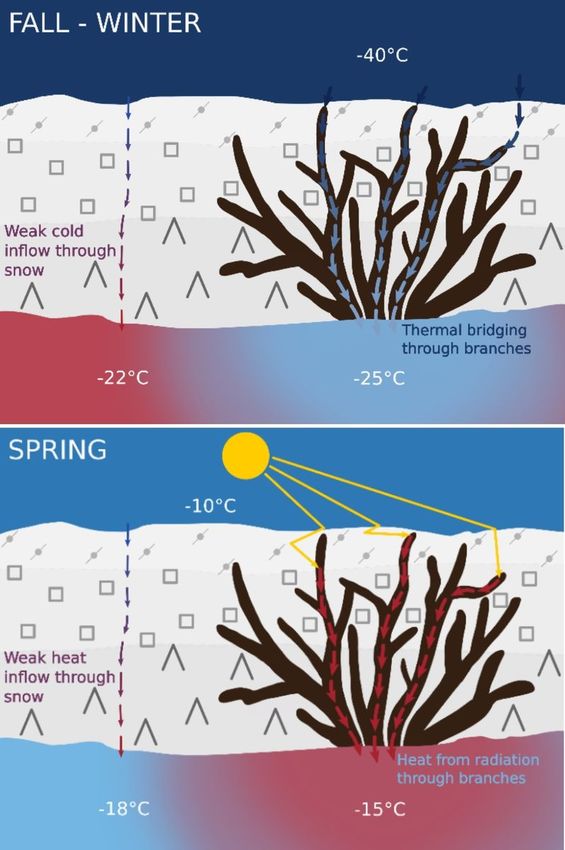
Page 14/20Figure 1
Schematic of the processes hypothesized in this study. Left: in fall and winter, in the absence of sunlight,
thermal bridging through frozen shrub branches cools the ground. Right: in spring, light absorption by shallow
buried shrub branches heats up the branches. The resulting heat is transferred through the branches to the
ground, whose warming is thus accelerated.
Page 15/20Figure 2
Snow depth at SALIX and TUNDRA during 2018-2019. Snow onset date is earlier at SALIX because it is closer
to the mountains and the orographic effect is more marked. Initial accumulation is faster because shrubs trap
blowing snow. This effect essentially stops when snow height reaches shrub height on 30 November.
Page 16/20Figure 3
Thermal variables at SALIX and TUNDRA for 2108-2019. (a) One-week running mean air temperature and one-
week running mean temperature difference between both sites. In winter, the air is colder at TUNDRA because
of katabatic flow in the river bed and because of a strong inversion layer that traps cold air at low elevation.
SALIX is colder in spring probably because of the 3° slope with N aspect, which reduces radiative heating. (b)
Snowpack thermal insulance. Except for a short spell around 1 December, the snowpack at SALIX is always
much more insulating than at TUNDRA. (c) One-week running mean temperature of the ground at 15 cm depth
at both sites. The ground is most of the time warmer at SALIX, but an actual comparison requires correction
Page 17/20for differences in air temperature. (d) Temperature difference of the ground at 15 cm depth between SALIX
and TUNDRA, corrected for air temperature. This shows that at equal air temperature, from November through
March, the ground temperature is most of the time colder at SALIX than at TUNDRA. The dashed horizontal
lines are the 0°C lines, added as visual aides.
Figure 4
Comparison of measured and simulated snow and ground temperatures. Simulations were performed with
the MFM model at 0 and 5 or 5.8 cm heights and at 15 cm depth. (a) At TUNDRA. (b) At SALIX. In both cases
an inset illustrates the quality of simulation of the phase at 0 cm. The shift is less than 2 hours at TUNDRA
and over 10 hours at SALIX.
Page 18/20Figure 5
Finite element simulations of temperatures rat SALIX. Data resulting from heat transfer through a snow cover
with and without shrubs are compared. Measured temperatures are also shown. (a) at 5.8 cm height in the
snow; (b) at the snow-ground surface; (c) in the ground at 15 cm depth. In (b) the inset shows the quality of
the phase simulation. The green curve is the temperature of a point half-way between two shrubs, while the
red curve is the temperature in the middle of a shrub (Fig. S11), to which 2°C were added to facilitate
comparison. The right temperature scale (in blue) is for the blue curve only.
Supplementary Files
This is a list of supplementary files associated with this preprint. Click to download.
Page 19/20SupMat.docx
Page 20/20You can also read