Dynamics of Soil Bacterial and Fungal Communities During the Secondary Succession Following Swidden Agriculture IN Lowland Forests
←
→
Page content transcription
If your browser does not render page correctly, please read the page content below
ORIGINAL RESEARCH
                                                                                                                                                published: 07 June 2021
                                                                                                                                       doi: 10.3389/fmicb.2021.676251

                                             Dynamics of Soil Bacterial and
                                             Fungal Communities During the
                                             Secondary Succession Following
                                             Swidden Agriculture IN Lowland
                                             Forests
                                             Qiang Lin 1,2* , Petr Baldrian 3 , Lingjuan Li 1 , Vojtech Novotny 4,5 , Petr Heděnec 6,7 ,
                                             Jaroslav Kukla 2 , Ruma Umari 5 , Lenka Meszárošová 3 and Jan Frouz 1,2*
                                             1
                                               Biology Centre of the Czech Academy of Sciences, Institute of Soil Biology and SoWa Research Infrastructure, České
                                             Budějovice, Czechia, 2 Faculty of Science, Institute for Environmental Studies, Charles University, Praha, Czechia,
                                             3
                                               Laboratory of Environmental Microbiology, Institute of Microbiology of the CAS, Praha, Czechia, 4 Institute of Entomology,
                                             Biology Centre of the Czech Academy of Sciences and University of South Bohemia, České Budějovice, Czechia, 5 New
                         Edited by:
                                             Guinea Binatang Research Center, Madang, Papua New Guinea, 6 Department of Geosciences and Natural Resource
                         Yurong Liu,
                                             Management, Faculty of Science, University of Copenhagen, Frederiksberg, Denmark, 7 Engineering Research Center of Soil
     Huazhong Agricultural University,
                                             Remediation of Fujian Province University, College of Resources and Environment, Fujian Agriculture and Forestry University,
                               China
                                             Fuzhou, China
                       Reviewed by:
                           Yu-Te Lin,
        Biodiversity Research Center,        Elucidating dynamics of soil microbial communities after disturbance is crucial
             Academia Sinica, Taiwan         for understanding ecosystem restoration and sustainability. However, despite the
                        Lucie Malard,
  University of Lausanne, Switzerland        widespread practice of swidden agriculture in tropical forests, knowledge about
                  *Correspondence:           microbial community succession in this system is limited. Here, amplicon sequencing
                            Qiang Lin        was used to investigate effects of soil ages (spanning at least 60 years) after
               qiangl2019@gmail.com
                                             disturbance, geographic distance (from 0.1 to 10 km) and edaphic property
                           Jan Frouz
                   frouz@natur.cuni.cz       gradients (soil pH, conductivity, C, N, P, Ca, Mg, and K), on soil bacterial and
                                             fungal communities along a chronosequence of sites representing the spontaneous
                   Specialty section:
         This article was submitted to
                                             succession following swidden agriculture in lowland forests in Papua New Guinea.
              Terrestrial Microbiology,      During succession, bacterial communities (OTU level) as well as its abundant (OTU
               a section of the journal      with relative abundance > 0.5%) and rare (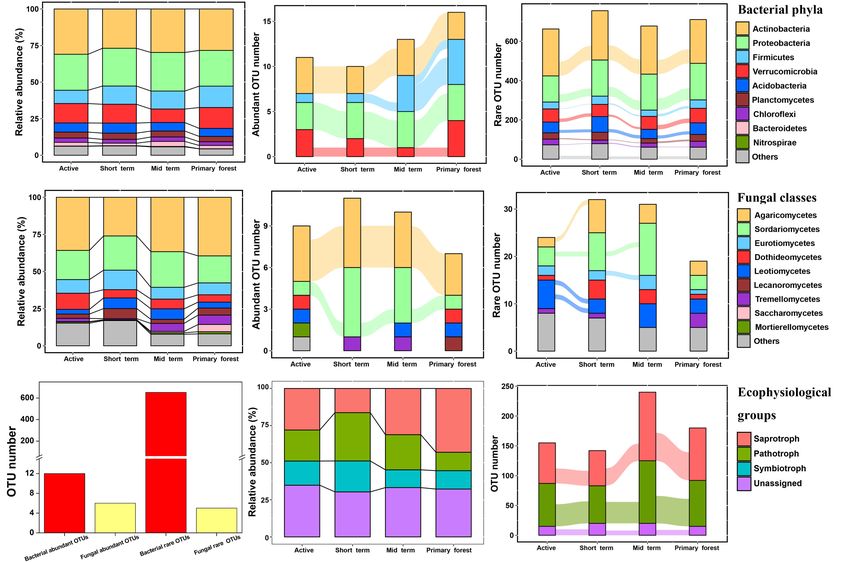
Lin et al.                                                                                                 Soil Microbial Dynamics During Succession

INTRODUCTION                                                                the abundance of microorganisms reflects their adaptabilities and
                                                                            nutritional strategies (Rivett and Bell, 2018), taxa that differ in
Slash-and-burn is a widespread agricultural technique in tropical           abundances in a community are probably affected by different
forests (Whitfeld et al., 2014; Kukla et al., 2018). This technique         biotic/abiotic factors and will have different dynamics during
has been reported to result in extensive soil degradation (Are              ecological succession. In studies of microbial communities,
et al., 2009) and loss of soil organic matter (Ogle et al., 2005;           dominant taxa often receive the most attention, while rare taxa
Huon et al., 2013), probably related to the extensive mechanical            are frequently ignored, because the former are thought to be
removal of vegetation, the disturbance of soil surface, and the             essential for ecosystem functioning (Lynch and Neufeld, 2015;
fire effects. In contrast to these reports, swidden agriculture in          Mo et al., 2018). However, evidence increasingly indicates that
rainforests in Papua New Guinea, including slash-and-burn, is               rare taxa are important to ecosystem functioning and stability
extremely sustainable (for several millennia) and has little effects        (Lynch and Neufeld, 2015; Jousset et al., 2017). In addition,
on soil characteristics (Kukla et al., 2018). This is probably              researchers have recently suggested that rare and dominant taxa
because of a small area where swidden agriculture is conducted,             occupy different niches and contribute differently to ecosystem
a low intensity of fire (due to high moisture and frequent                  functioning (Jousset et al., 2017). For example, rare taxa have
rainfall in the rainforests), absence of mechanical cultivation             been found to greatly affect nutrient cycling (Pester et al., 2010)
which would damage soil surface, and the incomplete removal                 and plant biomass accumulation (Hol et al., 2010), and to help
of large woody vegetation (Kukla et al., 2018). Due to its                  to insure system stability (Yachi and Loreau, 1999). These results
exceptionally sustainable nature, swidden agriculture in these              indicate that consideration of both rare and abundant taxa is
lowland forests requires more attention. The lowland forests in             required to understand the development of microbial community
Papua New Guinea are among the world’s largest undisturbed                  structure and function during ecological succession.
tropical forests (Whitfeld et al., 2012) and exhibit high biological            In this study, three hypotheses are made: (i) distinct
diversity and endemism (Whitfeld et al., 2014). The sustainability          successional patterns are observed between bacterial and fungal
and restoration of this ecosystem after swidden agriculture are             communities, as well as between their abundant and between
certainly dependent on soil microbial communities that are                  rare subcommunities during the restoration of lowland forests
supposed to play pivotal roles in ecosystem functioning (e.g.,              following swidden agriculture; (ii) successional dynamics of
decomposition of substrates, fluxes of energy and materials)                fungal communities than bacterial communities are more
(Harris, 2009; Wagg et al., 2014). Therefore, exploring soil                affected by spatial factors; (iii) rare subcommunities of both
microbial community dynamics and their potential driving forces             bacteria and fungi show greater variation than abundant
along the spontaneous restoration of this ecosystem, provides a             subcommunities during succession. To test these hypotheses, the
unique opportunity to understand microbial ecological roles in              high-throughput sequencing technology was used to investigate
the sustainable reutilization of soils. Although the spontaneous            the changes in the bacterial and fungal communities during the
restoration of this ecosystem has been the subject of plant                 secondary succession in swidden agricultural sites in the lowland
and soil ecology studies (Edwards and Grubb, 1977; Whitfeld                 forests of Papua New Guinea.
et al., 2012; Whitfeld et al., 2014; Kukla et al., 2018), effects of
swidden agriculture on soil microbial communities and microbial
community succession after the practice in this ecosystem                   MATERIALS AND METHODS
have not been studied. Dynamics of soil microbial community
composition are of particular interest, because a recent study              Study Site, Sample Collection, and
finds that nether fungal nor bacterial biomass significantly change         Processing
across successional stages in this ecosystem (Kukla et al., 2018).          The study was conducted near the village of Wanang (145◦ 50 3200
    Bacteria and fungi are major components of soil microbial               E, 5◦ 140 2600 S), in Madang Province, Papua New Guinea. In
communities and differ in phenotype, nutrition strategy, stress             this area, the altitude is 100–200 m a.s.l., the mean annual
tolerance, ecological functions, and interactions with vegetation;          temperature is 26◦ C, and the mean annual precipitation is
as a consequence, bacterial and fungal communities are driven               3,500 mm (McAlpine, 1983; Whitfeld et al., 2014). This area is
by different factors and show distinct successional patterns in             a large (>100,000 ha) continuous lowland rainforest on latosols
post-mining fields (Harantová et al., 2017), retreating glacier soils       (Wood, 1982), with a low human population density (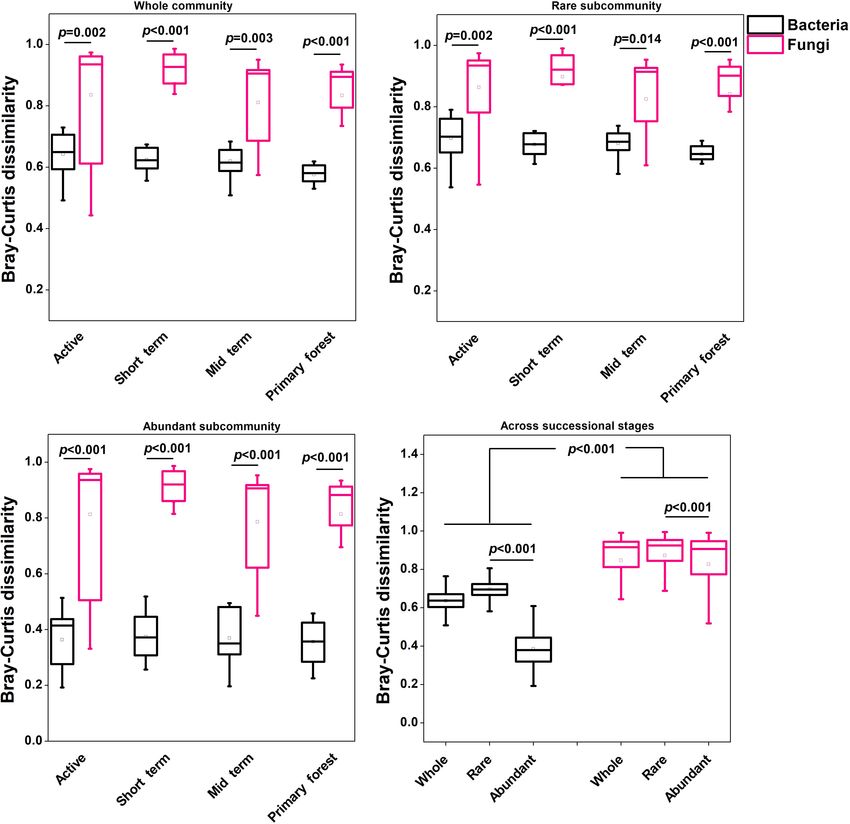
Lin et al.                                                                                                        Soil Microbial Dynamics During Succession

taro, sweet potato, and sugar cane) is conducted; after 2–3               in these sites can be found in Kukla et al., 2018. Among these
years, these gardens are abandoned, and secondary succession              soil properties, only the concentrations of available P, Ca, Mg, K,
occurs without anthropogenic disturbance until primary forests            and NO3 − in soil significantly differed across successional stages
regrow. Subsequently, active gardens are re-established by                (Supplementary Figure 2). DNA was isolated from soil samples
swidden agriculture. The chronosequence plots used in this                according to the modified method of Miller (Sagova-Mareckova
study contained active gardens (Active, current utilization;              et al., 2008). PCR was performed in triplicate for each sample
plant richness (number of species) = 4 including banana, taro,            (with the primers gITS7 and ITS4 for the fungal ITS2 region and
sweet potato, and sugar cane), old gardens (Short term, 5–                the primers 515 F and 806 R for bacterial 16S rRNA V4 region)
10 years after abandonment; plant richness = 49 ± 14 per                  (Supplementary material 1). In total, 48 samples (24 bacterial
0.25 hectare, dominated by Trichospermum pleiostigma, Ficus               samples and 24 fungal samples) were prepared for amplicon
pungens, and Macaranga tanarius), secondary forest (Mid-term,             paired-end sequencing with Illumina MiSeq.
20–40 years after abandonment; plant richness = 52 ± 16,
dominated by Trichospermum pleiostigma, Ficus pungens, and                Data Analysis
Macaranga tanarius), and primary forest (Primary forest, at               QIIME v. 1.9.0 was used for the sequence analyses (Caporaso
least 60 years after abandonment; plant richness = 104 ± 10,              et al., 2010). Raw sequences were sorted based on their unique
dominated by Pometia pinnata, Horsfieldia basifissa, and                  barcodes. To obtain clean sequences, low quality sequences,
Teijsmanniodendron bogoriense) (Supplementary Table 1 and                 sequences < 150 bp, and chimera were then removed (Edgar and
Supplementary Figure 1; Whitfeld et al., 2014; Kukla et al., 2018).       Flyvbjerg, 2015). Clean sequences were clustered into operational
The number of years since these plots had been abandoned was              taxonomic units (OTUs) at a 97% sequence similarity with the
estimated based on aerial photography and information provided            method of CD-HIT (Li and Godzik, 2006). The taxonomic
by landowners (Whitfeld et al., 2014; Kukla et al., 2018). Although       assignments of representative sequences of fungal and bacterial
it is a cycle of “primary forest—active gardens—old gardens—              OTUs were based on the UNITE and the Silva databases1 ,
secondary forest—primary forest,” active gardens were used as the         respectively. Singletons and sequences that were not assigned to
starting-point of a chronosequence in this study. This is because         fungi or bacteria were removed. Finally, to minimize the bias
this study aimed to explore soil microbial community succession           of sampling depth on the downstream analyses as well as to
along the ecosystem restoration after swidden agriculture, and            make the reads of individual OTUs comparable across samples
the chronosequence (soil age since abandonment) of these study            and successional stages, the clean sequences were standardized to
plots is well established.                                                4,211 reads for each bacterial sample and to 3,863 reads for each
    In June 2013, 12 plots were designated, with three replicate          fungal sample, based on the minimum read count in bacterial and
plots for each stage (active gardens, old gardens, secondary              fungal samples, respectively.
forest and primary forest). Individual replicate plots of the                To achieve fungal ecological lifestyles, fungal OTUs were also
same stage were separated by at least several hundred meters              assigned to ecophysiological groups (trophic categories) using
and usually by several kilometers (Supplementary Table 1 and              FUNGuild (Nguyen et al., 2016). Fungal OTUs that were not
Supplementary Figure 1). Individual plots had about 0.1–0.3 ha            assigned to any ecophysiological groups were grouped into the
in area, and soil samples were taken in central part of each plot.        “Unassigned” category. Alpha diversity indices (Shannon index
In June 2013, soil subsamples were collected at two depths (0–            and Pielou’s evenness) of microbial communities were calculated
5 and 5–10 cm) by cutting soil bock (5 × 5 × 2 cm), from                  with the vegan package (Oksanen et al., 2013) in R. To reveal
the four corners of a 20 × 20 m square in middle of each plot;            the distribution of microbial communities across successional
the subsamples were pooled to yield one composite sample per              stages and soil depths, non-metric multidimensional scaling
depth per plot. The soil samples were passed through a 2-mm               (NMDS) ordination with the function metaMDS, was conducted
sieve and freeze-dried for DNA isolation and measurement of               based on weighted Bray–Curtis dissimilarity of microbial
soil physiochemical properties. Soil total phosphorus (P) and             communities; significant differences of microbial communities
its available forms were determined as previously described               across successional stages and soil depths were evaluated by
(Murphy and Riley, 1962). Soil total carbon (C) and nitrogen (N)          Permutational multivariate analysis of variance (PERMANOVA)
were measured with an EA 1108 elemental analyzer. Available               test with the function adonis. Multiple regression of distance
forms of calcium (Ca), potassium (K), and magnesium (Mg)                  matrices (MRM) based on weighted Bray–Curtis dissimilarity
were quantified with a Varian SpectrAA-640 atomic absorption              was conducted with the ecodist package (Goslee and Urban,
spectrophotometer. For soil organic C, the active fractions               2007) in R. The permutational analysis of multivariate dispersion
(including particulate organic matter and dissolved organic               (PERMDISP) based on the null model (Chase et al., 2011; Zhou
C), slow fractions (including C associated with clay and silt             et al., 2014) was used to differentiate the observed community
and stabilized in aggregates), and passive fractions (oxidation-          beta diversity from the null expectation, so that deterministic
resistant C) were quantified using a combination of physical              and stochastic processes on community assemblies in each
and chemical methods (sonication, density fractionation and acid          successional stage could be evaluated. The null model test
oxidation) (Zimmermann et al., 2007). A soil-water slurry (soil:          was conducted at the pipeline http://ieg.ou.edu/microarray/ by
water, 1:5) was used to measure pH with a pH meter, conductivity          keeping alpha and gamma diversities constant across all the
with a potentiometric electrode, and NO3 − concentrations by
the colorimetric method. A detailed description of soil properties        1
                                                                              http://qiime.org/home_static/dataFiles.html

Frontiers in Microbiology | www.frontiersin.org                       3                                               June 2021 | Volume 12 | Article 676251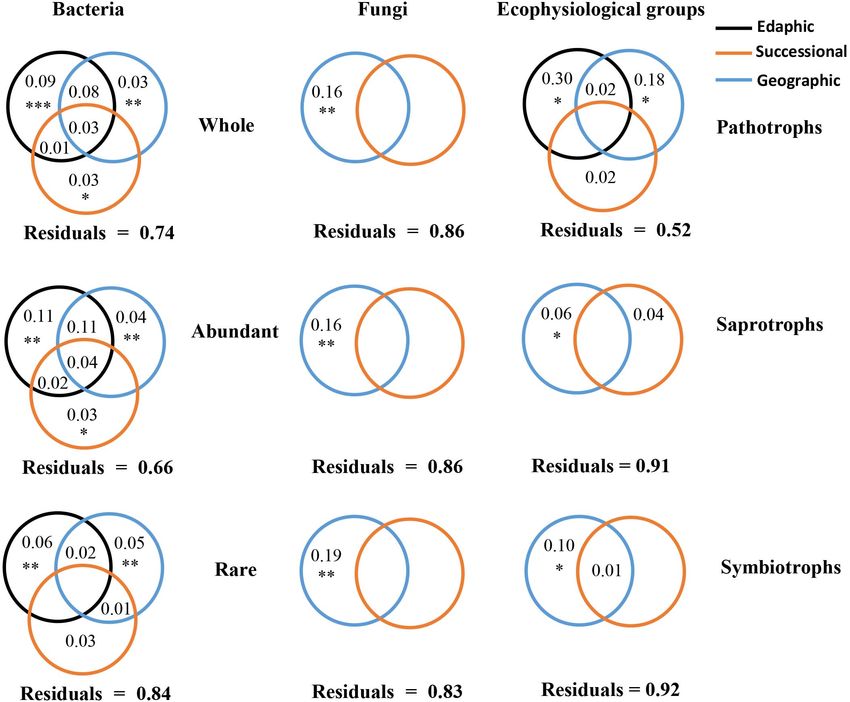
Lin et al.                                                                                                                 Soil Microbial Dynamics During Succession

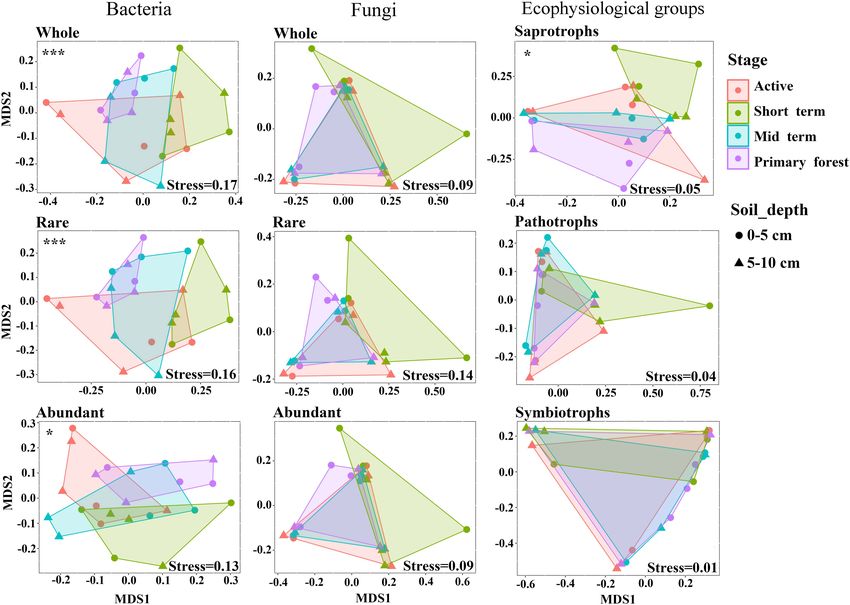
  FIGURE 1 | Non-metric multidimensional scaling (NMDS) ordination based on weighted Bray–Curtis dissimilarities of bacterial and fungal communities and fungal
  ecophysiological groups. Significant differences across successional stages were marked as *p < 0.05 and ***p < 0.001. No significant differences were detected
  across soil depths.

samples and by using the Bray–Curtis dissimilarity of microbial                       change of locally abundant OTUs into regionally intermediate or
communities. Geographic distance was generated from the GPS                           even rare OTUs because of averaging, regionally abundant/rare
coordinates of each sampling site using principal coordinates                         OTUs across samples were defined as the union of all locally
of neighbor matrices (PCNM) (Legendre et al., 2008). Forward                          abundant/rare OTUs in this region. The community consisting
selection was conducted to select edaphic and geographic                              of abundant or rare taxa is referred to as the abundant or rare
variables significantly associated (p < 0.05) with changes in                         subcommunity, respectively, and the community consisting of
microbial communities during succession (Blanchet et al., 2008).                      all taxa (including abundant, intermediate, and rare taxa) is
To explain the changes in microbial communities during                                referred to as the whole community. Based on this definition,
succession, these selected variables in forward selection were used                   there may be some overlaps between regionally abundant and
in variation partitioning analysis (VPA) and in Mantel and partial                    rare subcommunities, namely, some OTUs may be abundant in
Mantel tests based on Spearman’s correlations. Wilcoxon rank                          one sample and rare in another, but it is consistent with the fact
sum test, ANOVA permutation tests and Spearman’s correlations                         that most of OTUs are conditionally abundant or rare (Jiao et al.,
were performed in R.                                                                  2017; Mo et al., 2018; Shu et al., 2018).
    The definitions for abundant and rare OTUs are usually
modified based on the specific datasets of microbial communities
(Jiao et al., 2017; Yan et al., 2017; Mo et al., 2018; Shu et al.,                    RESULTS
2018; Jiang et al., 2019). Based on the dataset in this study, we
slightly modified the previous definitions (Jiao et al., 2017; Jiang                  Diversities of Microbial Communities
et al., 2019), i.e., we defined locally abundant OTUs as those with                   During Succession
relative abundance > 0.5% within a sample, locally rare OTUs                          The alpha diversity in terms of the Shannon index and Pielou’s
as those with relative abundance < 0.05% within a sample, and                         evenness was higher (p < 0.01) in bacterial communities
locally intermediate OTUs as those between locally abundant and                       than in fungal communities (Supplementary Figure 3). The
locally rare OTUs. At the regional scale, to minimize the artificial                  NMDS analysis and the PERMANOVA test indicated that

Frontiers in Microbiology | www.frontiersin.org                                   4                                           June 2021 | Volume 12 | Article 676251
Lin et al. Soil Microbial Dynamics During Succession only bacterial communities and saprotrophic fungi differed communities. During succession, fungal communities (average (p < 0.05) across successional stages (Figure 1). Neither Bray–Curtis dissimilarity: 0.84) showed greater (p < 0.001) bacterial nor fungal communities significantly differed across variation than bacterial communities (average Bray–Curtis soil depths (Figure 1), so soil depths were unlikely to affect dissimilarity: 0.55), and this was also evident for abundant and microbial communities. Additionally, neither bacterial nor rare subcommunities of fungi and bacteria (Figure 2). For both fungal community dynamics were significantly correlated with bacteria and fungi, rare subcommunities (average Bray–Curtis plant richness (Supplementary Table 2). The successional dissimilarity: 0.70 for bacteria, 0.87 for fungi) showed greater dynamics of bacterial communities were more affected by variation (p < 0.001) than abundant subcommunities (average their rare subcommunities than by abundant or intermediate Bray–Curtis dissimilarity: 0.39 for bacteria, 0.83 for fungi) during subcommunities, whereas the successional dynamics of succession (Figure 2D). fungal communities were most affected by their abundant subcommunities (Supplementary Table 3). For both bacteria and fungi, the contributions of intermediate subcommunities Changes in Microbial Community were between those of abundant and rare subcommunities Composition During Succession (Supplementary Table 3), which indicated a gradient in the At all successional stages, most bacterial OTUs were importance of abundance-dependent subcommunities for whole assigned to Actinobacteria (relative abundance 28–31%), FIGURE 2 | Variation in microbial communities (A: Whole community; B: Rare subcommunity; C: Abundant subcommunity) within each successional stage and across all successional stages (D) based on weighted Bray–Curtis dissimilarity. The statistical significance was assessed by the Wilcoxon rank sum test. The square and horizontal black line inside the box represented mean and median, respectively. Data for the regionally abundant and rare OTUs in each stage and across all stages were used. Frontiers in Microbiology | www.frontiersin.org 5 June 2021 | Volume 12 | Article 676251
Lin et al.                                                                                             Soil Microbial Dynamics During Succession

followed by Proteobacteria, Firmicutes, and Verrucomicrobia              successional stages, and a similar pattern was observed for rare
(Figure 3A). Only the relative abundances of these four                  OTUs (bacteria = 653, fungi = 5) (Figure 3G). The bacterial
phyla plus Bacteroidetes were correlated with edaphic factors            OTUs that were consistently rare across all successional stages
(p < 0.05), but none of them showed consistent changes during            mainly belonged to the phyla Actinobacteria, Proteobacteria,
succession (Supplementary Table 4). At the bacterial class level,        Acidobacteria, and Verrucomicrobia (Figure 3C). No fungal
Thermoleophilia, Alphaproteobacteria, Bacilli, Actinobacteria,           OTU was consistently rare across all successional stages
and Deltaproteobacteria were dominant at each successional               (Figure 3F). Across all samples, only bacterial OTU2452 (Order
stage (Supplementary Table 4). At the fungal phylum level, the           Rhizobiales) was consistently locally abundant, but no OTU was
phyla Ascomycota and Basidiomycota dominated at all stages               consistently locally rare.
and together represented about 95% of fungal sequences. At the
fungal class level, Agaricomycetes was most abundant (relative           Relationships Between Microbial
abundance 26–39%) at each stage, followed by Sordariomycetes,            Communities and Environmental
Eurotiomycetes, and Dothideomycetes (Figure 3D). The relative
abundances of Sordariomycetes, Eurotiomycetes, Leotiomycetes,
                                                                         Variables
and Tremellomycetes were correlated with various edaphic                 Results of VPA based on forward selection (Supplementary
factors (Supplementary Table 5). Only the relative abundance             Table 6) showed that the variation in bacterial communities
of Tremellomycetes changed during succession (p < 0.05),                 was significantly explained by edaphic variables (9%), geographic
increasing from the short term stage to the primary forest               distance (3%), and a successional variable (succession stage)
stage. At the fungal order level, Hypocreales was most dominant          (3%), while the variation of fungal communities was significantly
(relative abundance 12–18%), followed by Russulales and                  explained only by geographic distance (16%) (Figure 4).
Pleosporales, in each successional stage (Supplementary Table 5).        A similar pattern was observed for both abundant and
Compared with other fungal orders, the relative abundance of             rare subcommunities, respectively. For fungi, the variation of
Trichosporonales was more strongly associated with edaphic               pathotrophs was explained by edaphic variables (30%) and
factors (soil P, Ca, Mg, and K) (p < 0.05) and significantly             geographic distance (18%), whereas the variation of both
increased with succession. For fungal ecophysiological groups,           saprotrophs and symbiotrophs was significantly explained only
the relative abundances of pathotrophs and symbiotrophs were             by geographic distance. The VPA results were further supported
higher in early successional stages than in later stages, but the        by the results of Mantel and Partial Mantel (Supplementary
opposite was true for saprotrophs (p < 0.05) (Figure 3H). None           Table 7). The significantly positive correlations between average
of the fungal ecophysiological groups changed significantly              relative abundances and occurrence frequencies of OTUs in both
with succession, but the fungal OTUs assigned to them varied             bacteria and fungi (Supplementary Figure 5) further highlighted
substantially across stages (Figure 3I). In these ecophysiological       the effects of geographic distance on rare subcommunities.
groups, Ectomycorrhizal, Endophyte, Animal Pathogen, and                 In each successional stage, the PERMDISP test demonstrated
Plant Pathogen were dominant (Supplementary Table 5).                    that the bacterial community assemblage differed from the
    Both bacterial and fungal communities mainly consisted               null expectation (p < 0.0001), indicating the dominance of
of rare OTUs rather than abundant OTUs (p < 0.01); rare                  deterministic processes driving bacterial community dynamics
OTUs accounted for the majority of bacterial sequences,                  (Table 1). In contrast, the PERMDISP test indicated that
whereas abundant OTUs accounted for the majority of                      the fungal community dynamics were driven by stochastic
fungal sequences (Supplementary Figure 4). The dynamics                  processes (Table 1).
of abundant/rare OTUs during succession differed between
bacteria and fungi (Figure 3). In each successional stage,
most of the abundant bacterial OTUs belonged to the                      DISCUSSION
phyla Actinobacteria, Proteobacteria, Verrucomicrobia, and
Firmicutes (Figure 3B). The following bacterial OTUs were                Successional Patterns of Bacterial and
consistently abundant across all successional stages: OTU437             Fungal Communities
(Order Gaiellales), OTU979 (Family Micromonosporaceae),                  Bacterial communities rather than fungal communities clearly
and OTU4542 (Order Acidimicrobiales) in Actinobacteria,                  changed with succession at swidden agricultural sites. This is
OTU1618 (Genus Rhodoplanes), OTU2452 (Order Rhizobiales),                consistent with previous findings that fungal communities are
and OTU3090 (Genus Rhodoplanes) in Proteobacteria, and                   more tolerant than bacterial communities to environmental
OTU31 (Family Chthoniobacteraceae) in Verrucomicrobia.                   changes that occur during forest restoration (Sun et al., 2017)
Most of the abundant fungal OTUs belonged to the classes                 and bacterial communities are more sensitive than fungal
Agaricomycetes and Sordariomycetes (Figure 3E), and only                 communities to forest restoration process (Banning et al.,
OTU16 (genus Russula; Ectomycorrhizal), OTU38 (genus                     2011; Chai et al., 2019). In the current study, however,
Russula; Ectomycorrhizal), OTU161 (Family Boletaceae;                    fungal communities showed higher variation than bacterial
Ectomycorrhizal), and OTU476 (genus Trichoderma; unassigned              communities within successional stages and across stages,
ecophysiology) were consistently abundant across all successional        respectively (Figure 2). Based on the results of the PERMDISP
stages. Collectively, more bacterial OTUs (n = 12) than fungal           test, we inferred that the variation in fungal communities
OTUs (n = 6) were consistently abundant across all or several            within successional stages was caused by stochastic processes,

Frontiers in Microbiology | www.frontiersin.org                      6                                    June 2021 | Volume 12 | Article 676251
Lin et al. Soil Microbial Dynamics During Succession FIGURE 3 | The composition of bacterial communities at the phylum level (A), of fungal communities at the class level (D), and of fungal ecophysiological groups (H) in four successional stages at swidden agricultural sites in lowland forests. For abundant OTUs, rare OTUs or fungal ecophysiological OTUs that were present in at least half of the samples in each of two adjacent successional stages, the lines connecting the stages indicated the transfer of those OTUs to the next successional stage: abundant bacterial OTUs (B); abundant fungal OTUs (E); present fungal ecophysiological OTUs (I); rare bacterial OTUs (C); rare fungal OTUs (F); total number of bacterial and fungal abundant/rare OTUs across at least two stages (G). The lines represented the “transfer” of OTUs between stages, and the width of the line indicated the number of OTUs transferred. whereas the variation of bacterial communities was caused to environmental gradients. Niche differentiation may have by deterministic processes, which well corresponded to the been greater in the species-rich rare subcommunities than in significant effect of succession stages on bacterial communities. the species-poor abundant subcommunities, so that the rare Remarkably, differences in bacterial and fungal community subcommunities showed higher variation across successional variations may be also related to different biomarkers used to stages. Additionally, the results of the PERMDISP test and investigate the two microbial groups. Across stages, bacterial NMDS indicated that deterministic processes and successional community dynamics were more affected by the development of stage had greater effects on the rare bacterial subcommunities rare rather than abundant subcommunities, whereas the opposite than on abundant bacterial subcommunities. This indicated a was true for fungi. In glacial forelands (Yan et al., 2017) and greater degree of niche differentiation during succession in rare oil-contaminated soils (Jiao et al., 2017), in contrast, abundant than in abundant bacterial subcommunities, which supported the bacterial subcommunities were reported to contribute more than above inference. Thus, rare subcommunities mainly contributed rare ones to whole-community dynamics. The difference between to the niche differentiation of bacterial communities during the our results and previous reports might attribute to different succession. Fungal communities, in contrast, tended to show studying environments. little niche differentiation during succession, because fungal A rare species often shows a more narrow environmental communities were not significantly influenced by successional niche than an abundant species (Jousset et al., 2017), which stage and tended to be assembled stochastically. The higher probably contributed to greater variation of rare subcommunities variation of rare fungal subcommunities than abundant fungal than abundant subcommunities across environmental gradients. subcommunities might be explained by rare species being We therefore expected greater variation in rare than in abundant more susceptible than abundant ones to local elimination subcommunities during succession. This expectation was in line (Melbourne and Hastings, 2008). Remarkably, saprotrophic with the results in this study. The succession in this study fungi were significantly affected by successional stage, perhaps spanned more than 60 years, during which niche differentiation because the gradual accumulation of litter during succession of microbial communities may have occurred in response (Kukla et al., 2018) increased the availability of nutrients for Frontiers in Microbiology | www.frontiersin.org 7 June 2021 | Volume 12 | Article 676251
Lin et al.                                                                                                                  Soil Microbial Dynamics During Succession

  FIGURE 4 | Variation partitioning analysis for the relative contributions of edaphic, geographic, and successional variables to microbial subcommunities and
  ecophysiological groups. The significance of individual variables was evaluated by ANOVA permutation tests; ∗ and ∗∗ indicated p < 0.05 and < 0.01, respectively.
  Values < 0 were not shown.

saprotrophs. The increased abundances of saprotrophic fungi                           (Jousset et al., 2017; Jia et al., 2018). None of the fungal OTUs,
during succession partly supported the above explanation.                             in contrast, was consistently rare across all successional stages,
Collectively, saprotrophic fungi were more sensitive than the                         which indicated that fungal rarities were more conditional than
whole fungal communities to successional stages. This is also                         bacterial rarities. This can probably be explained by the strong
because garden patches are small and experience limited tillage                       dependence of fungal abundance and presence on vegetation
(Kukla et al., 2018), which allows the persistence of the roots of                    (Urbanova et al., 2015), which changes substantially during
neighboring trees. The roots of these trees would support the                         succession (Whitfeld et al., 2014), and also by highly spatial
persistence of saprotrophic, symbiotic as well as pathogenic fungi.                   variability inside individual stages.
   Consistently abundant bacterial OTUs belonged mainly to the
genus Rhodoplanes, the order Rhizobiales and Acidimicrobiales,
respectively, which have been found to be abundant in a wide                          Ecological Mechanisms Underlying
range of environments (Hartmann et al., 2014; Wang et al.,                            Bacterial and Fungal Succession
2016; Gkarmiri et al., 2017; Dawkins and Esiobu, 2018) and                            Various ecological processes (e.g., environmental selection,
to possess diverse nutritional strategies (De Mandal et al.,                          geographic effects and stochastic processes) have been invoked
2017). The consistently abundant fungal OTUs belonged mainly                          to explain the spatiotemporal distributions of microbial
to the genus Russula, which are symbionts of trees and are                            communities (Dini-Andreote et al., 2015; Jia et al., 2018; Mo
therefore abundant in forests (Hartmann et al., 2014). Thus,                          et al., 2018). In this study, geographic distance was found to affect
diverse nutritional strategies and little dependence on vegetation                    all communities, and especially fungal communities, which were
probably caused bacteria to be consistently abundant during                           significantly affected only by geographic distance (Figure 4).
succession. The consistent rarity of certain bacterial OTUs during                    The effect of geographic distance could be caused by dispersal
succession in the current study might be explained by narrow                          limitation and/or environmental selection by unmeasured
niches, abiotic and biotic interactions, or life-history strategies                   variables which were spatially autocorrelated (Wang et al., 2013;

Frontiers in Microbiology | www.frontiersin.org                                   8                                            June 2021 | Volume 12 | Article 676251
Lin et al.                                                                                                          Soil Microbial Dynamics During Succession

TABLE 1 | Significance test for centroid differences between observed                so this community is likely to be determined together by
communities in each successional stage and the null model simulations based on
                                                                                     multiple effects rather than a sole effect. Geographic distance
Bray-Curtis dissimilarities.
                                                                                     factor usually includes mixed effects from multiple factors (e.g.,
Community and stage             Actual              Null       F         P           measured and unmeasured environmental factors, and dispersal
                               centroid           centroid                           limitation). Therefore, relative to abundant subcommunities,
                                                                                     rare subcommunities consisting of vast diverse species were
Bacterial community
                                                                                     inferred to be more influenced by geographic distance, which
Active                          0.4164            0.5101     56.136
Lin et al. Soil Microbial Dynamics During Succession
ACKNOWLEDGMENTS Fellowship (747824-AFOREST-H2020-MSCA–IF–2016/H2020-
MSCA–IF–2016).
We thank the staff of the New Guinea Binatang Research Center
and the Wanang Conservation Area for support in the field.
We also thank local landowners for allowing us to work on SUPPLEMENTARY MATERIAL
the sites and for providing local information. Dr. B. Jaffee
(Jaffee Revises Davis, California, United States) is thanked for The Supplementary Material for this article can be found
language corrections and valuable comments to the format of this online at: https://www.frontiersin.org/articles/10.3389/fmicb.
manuscript. PH was supported by the Marie Curie Individual 2021.676251/full#supplementary-material
REFERENCES Gkarmiri, K., Mahmood, S., Ekblad, A., Alstrom, S., Hogberg, N., and Finlay, R.
(2017). Identifying the active microbiome associated with roots and rhizosphere
Are, K. S., Oluwatosin, G. A., Adeyolanu, O. D., and Oke, A. O. (2009). Slash and soil of Oilseed Rape. Appl. Environ. Microbiol. 83:14. doi: 10.1128/aem.
burn effect on soil quality of an Alfisol: soil physical properties. Soil Tillage Res. 01938-17
103, 4–10. doi: 10.1016/j.still.2008.08.011 Goslee, S. C., and Urban, D. L. (2007). The ecodist package for dissimilarity-based
Banning, N. C., Gleeson, D. B., Grigg, A. H., Grant, C. D., Andersen, G. L., analysis of ecological data. J. Stat. Softw. 22, 1–19.
Brodie, E. L., et al. (2011). Soil microbial community successional patterns Harantová, L., Mudrák, O., Kohout, P., Elhottová, D., Frouz, J., and Baldrian, P.
during forest ecosystem restoration. Appl. Environ. Microbiol. 77, 6158–6164. (2017). Development of microbial community during primary succession in
doi: 10.1128/aem.00764-11 areas degraded by mining activities. Land Degrad. Dev. 28, 2574–2584. doi:
Blanchet, F. G., Legendre, P., and Borcard, D. (2008). Forward selection of 10.1002/ldr.2817
explanatory variables. Ecology 89, 2623–2632. doi: 10.1890/07-0986.1 Harris, J. (2009). Soil microbial communities and restoration ecology: facilitators
Brown, S. P., and Jumpponen, A. (2014). Contrasting primary successional or followers? Science 325, 573–574. doi: 10.1126/science.1172975
trajectories of fungi and bacteria in retreating glacier soils. Mol. Ecol. 23, Hartmann, M., Niklaus, P. A., Zimmermann, S., Schmutz, S., Kremer, J.,
481–497. doi: 10.1111/mec.12487 Abarenkov, K., et al. (2014). Resistance and resilience of the forest soil
Caporaso, J. G., Kuczynski, J., Stombaugh, J., Bittinger, K., Bushman, F. D., microbiome to logging-associated compaction. ISME J. 8, 226–244. doi: 10.
Costello, E. K., et al. (2010). QIIME allows analysis of high-throughput 1038/ismej.2013.141
community sequencing data. Nat. Methods 7, 335–336. doi: 10.1038/nmet Hol, W. G., De Boer, W., Termorshuizen, A. J., Meyer, K. M., Schneider, J. H.,
h.f.303 Van Dam, N. M., et al. (2010). Reduction of rare soil microbes modifies plant–
Chai, Y., Cao, Y., Yue, M., Tian, T., Yin, Q., Dang, H., et al. (2019). Soil herbivore interactions. Ecol. Lett. 13, 292–301. doi: 10.1111/j.1461-0248.2009.
abiotic properties and plant functional traits mediate associations between soil 01424.x
microbial and plant communities during a secondary forest succession on the Huon, S., De Rouw, A., Bonté, P., Robain, H., Valentin, C., Lefèvre, I., et al. (2013).
Loess Plateau. Front. Microbiol. 10:895. doi: 10.3389/fmicb.2019.00895 Long-term soil carbon loss and accumulation in a catchment following the
Chase, J. M., Kraft, N. J., Smith, K. G., Vellend, M., and Inouye, B. D. (2011). Using conversion of forest to arable land in northern Laos. Agric. Ecosyst. Environ.
null models to disentangle variation in community dissimilarity from variation 169, 43–57. doi: 10.1016/j.agee.2013.02.007
in α−diversity. Ecosphere 2, 1–11. Jia, X., Dini-Andreote, F., and Falcao Salles, J. (2018). Community assembly
Dawkins, K., and Esiobu, N. (2018). The Invasive Brazilian Pepper Tree processes of the microbial rare biosphere. Trends Microbiol. 26, 738–747. doi:
(Schinus terebinthifolius) is colonized by a root microbiome enriched with 10.1016/j.tim.2018.02.011
Alphaproteobacteria and unclassified Spartobacteria. Front. Microbiol. 9:14. Jiang, Y. L., Song, H. F., Lei, Y. B., Korpelainen, H., and Li, C. Y. (2019). Distinct
doi: 10.3389/fmicb.2018.00876 co-occurrence patterns and driving forces of rare and abundant bacterial
de Boer, W., Folman, L. B., Summerbell, R. C., and Boddy, L. (2005). Living in subcommunities following a glacial retreat in the eastern Tibetan Plateau. Biol.
a fungal world: impact of fungi on soil bacterial niche development. FEMS Fertil. Soils 55, 351–364. doi: 10.1007/s00374-019-01355-w
Microbiol. Rev. 29, 795–811. doi: 10.1016/j.femsre.2004.11.005 Jiao, S., Chen, W., and Wei, G. (2017). Biogeography and ecological diversity
De Mandal, S., Chatterjee, R., and Kumar, N. S. (2017). Dominant bacterial phyla patterns of rare and abundant bacteria in oil-contaminated soils. Mol. Ecol. 26,
in caves and their predicted functional roles in C and N cycle. BMC Microbiol. 5305–5317. doi: 10.1111/mec.14218
17:90. doi: 10.1186/s12866-017-1002-x Jousset, A., Bienhold, C., Chatzinotas, A., Gallien, L., Gobet, A., Kurm, V., et al.
Dini-Andreote, F., Stegen, J. C., van Elsas, J. D., and Salles, J. F. (2015). (2017). Where less may be more: how the rare biosphere pulls ecosystems
Disentangling mechanisms that mediate the balance between stochastic and strings. ISME J. 11, 853–862. doi: 10.1038/ismej.2016.174
deterministic processes in microbial succession. Proc. Natl. Acad. Sci. U.S.A. Kukla, J., Whitfeld, T., Cajthaml, T., Baldrian, P., Veselá - Šimáčková, H., Novotnı,
112, E1326–E1332. doi: 10.1073/pnas.1414261112 V., et al. (2018). The effect of traditional slash-and-burn agriculture on soil
Edgar, R. C., and Flyvbjerg, H. (2015). Error filtering, pair assembly and error organic matter, nutrient content and microbiota in tropical ecosystems of New
correction for next-generation sequencing reads. Bioinformatics 31, 3476–3482. Guinea. Land Degrad. Dev. 30, 166–177. doi: 10.1002/ldr.3203
doi: 10.1093/bioinformatics/btv401 Legendre, P., Borcard, D., and Peres-Neto, P. R. (2008). Analyzing or explaining
Edwards, P., and Grubb, P. (1977). Studies of mineral cycling in a montane rain beta diversity? Comment Ecol. 89, 3238–3244. doi: 10.1890/07-0272.1
forest in New Guinea: I. The distribution of organic matter in the vegetation Li, W., and Godzik, A. (2006). Cd-hit: a fast program for clustering and comparing
and soil. J. Ecol. 65, 943–969. doi: 10.2307/2259387 large sets of protein or nucleotide sequences. Bioinformatics 22, 1658–1659.
Franzetti, A., Pittino, F., Gandolfi, I., Azzoni, R., Diolaiuti, G., Smiraglia, C., doi: 10.1093/bioinformatics/btl158
et al. (2020). Early ecological succession patterns of bacterial, fungal and plant Lynch, M. D., and Neufeld, J. D. (2015). Ecology and exploration of the rare
communities along a chronosequence in a recently deglaciated area of the biosphere. Nat. Rev. Microbiol. 13:217. doi: 10.1038/nrmicro3400
Italian Alps. Fems Microbiol. Ecol. 96:fiaa165. McAlpine, J. R. (1983). Climate of Papua New Guinea. Canberra, NSW:
Garrido-Benavent, I., Pérez-Ortega, S., Durán, J., Ascaso, C., Pointing, S. B., Commonwealth Scientific and Industrial Research Organization in association
Rodríguez-Cielos, R., et al. (2020). Differential colonization and succession with Australian National University Press.
of microbial communities in rock and soil substrates on a maritime Melbourne, B. A., and Hastings, A. (2008). Extinction risk depends strongly
antarctic glacier forefield. Front. Microbiol. 11:126. doi: 10.3389/fmicb.2020 on factors contributing to stochasticity. Nature 454, 100–103. doi: 10.1038/
.00126 nature06922
Frontiers in Microbiology | www.frontiersin.org 10 June 2021 | Volume 12 | Article 676251Lin et al. Soil Microbial Dynamics During Succession Mo, Y., Zhang, W., Yang, J., Lin, Y., Yu, Z., and Lin, S. (2018). Biogeographic Whitfeld, T. J. S., Kress, W. J., Erickson, D. L., and Weiblen, G. D. (2012). patterns of abundant and rare bacterioplankton in three subtropical bays Change in community phylogenetic structure during tropical forest succession: resulting from selective and neutral processes. ISME J. 12, 2198–2210. doi: evidence from New Guinea. Ecography 35, 821–830. doi: 10.1111/j.1600-0587. 10.1038/s41396-018-0153-6 2011.07181.x Murphy, J., and Riley, J. P. (1962). A modified single solution method for the Whitfeld, T. J. S., Lasky, J. R., Damas, K., Sosanika, G., Molem, K., and determination of phosphate in natural waters. Anal. Chim. Acta 27, 31–36. Montgomery, R. A. (2014). Species richness, forest structure, and functional doi: 10.1016/s0003-2670(00)88444-5 diversity during succession in the New Guinea Lowlands. Biotropica 46, 538– Nguyen, N. H., Song, Z., Bates, S. T., Branco, S., Tedersoo, L., Menke, J., et al. 548. doi: 10.1111/btp.12136 (2016). FUNGuild: an open annotation tool for parsing fungal community Wood, A. W. (1982). “The soils of New Guinea,” in Biogeography and Ecology of datasets by ecological guild. Fungal Ecol. 20, 241–248. doi: 10.1016/j.funeco. New Guinea. Monographiae Biologicae, Vol. 42, ed. J. L. Gressitt (Dordrecht: 2015.06.006 Springer), 73–83. doi: 10.1007/978-94-009-8632-9_5 Ogle, S. M., Breidt, F. J., and Paustian, K. (2005). Agricultural management impacts Wu, W., Logares, R., Huang, B., and Hsieh, C. H. (2017). Abundant and rare on soil organic carbon storage under moist and dry climatic conditions of picoeukaryotic sub-communities present contrasting patterns in the epipelagic temperate and tropical regions. Biogeochemistry 72, 87–121. doi: 10.1007/ waters of marginal seas in the northwestern Pacific Ocean. Environ. Microbiol. s10533-004-0360-2 19, 287–300. doi: 10.1111/1462-2920.13606 Oksanen, J., Blanchet, F. G., Kindt, R., Legendre, P., Minchin, P. R., O’hara, R., et al. Xiao, X., Liang, Y., Zhou, S., Zhuang, S., and Sun, B. (2018). Fungal community (2013). Package ‘vegan’. Commun. Ecol. Package Version 2, 1–295. reveals less dispersal limitation and potentially more connected network than Pester, M., Bittner, N., Deevong, P., Wagner, M., and Loy, A. (2010). A ‘rare that of bacteria in bamboo forest soils. Mol. Ecol. 27, 550–563. doi: 10.1111/ biosphere’microorganism contributes to sulfate reduction in a peatland. ISME mec.14428 J. 4:1591. doi: 10.1038/ismej.2010.75 Yachi, S., and Loreau, M. (1999). Biodiversity and ecosystem productivity in a Rivett, D. W., and Bell, T. (2018). Abundance determines the functional role fluctuating environment: the insurance hypothesis. Proc. Natl. Acad. Sci. U.S.A. of bacterial phylotypes in complex communities. Nat. Microbiol. 3, 767–772. 96, 1463–1468. doi: 10.1073/pnas.96.4.1463 doi: 10.1038/s41564-018-0180-0 Yan, W., Ma, H., Shi, G., Li, Y., Sun, B., Xiao, X., et al. (2017). Independent Sagova-Mareckova, M., Cermak, L., Novotna, J., Plhackova, K., Forstova, J., and shifts of abundant and rare bacterial populations across East Antarctica Glacial Kopecky, J. (2008). Innovative methods for soil DNA purification tested in soils Foreland. Front. Microbiol. 8:1534. doi: 10.3389/fmicb.2017.01534 with widely differing characteristics. Appl. Environ. Microbiol. 74, 2902–2907. Zhang, J., Zhang, B., Liu, Y., Guo, Y., Shi, P., and Wei, G. (2018). Distinct large- doi: 10.1128/AEM.02161-07 scale biogeographic patterns of fungal communities in bulk soil and soybean Shu, D., Zhang, B., He, Y., and Wei, G. (2018). Abundant and rare microbial sub- rhizosphere in China. Sci. Total Environ. 644, 791–800. doi: 10.1016/j.scitotenv. communities in anammox granules present contrasting assemblage patterns 2018.07.016 and metabolic functions in response to inorganic carbon stresses. Bioresour. Zhou, J., Deng, Y., Zhang, P., Xue, K., Liang, Y., Van Nostrand, J. D., et al. Technol. 265, 299–309. doi: 10.1016/j.biortech.2018.06.022 (2014). Stochasticity, succession, and environmental perturbations in a fluidic Sun, S., Li, S., Avera, B. N., Strahm, B. D., and Badgley, B. D. (2017). Soil ecosystem. Proc. Natl. Acad. Sci.U.S.A. 111, E836–E845. doi: 10.1073/pnas. bacterial and fungal communities show distinct recovery patterns during forest 1324044111 ecosystem restoration. Appl. Environ. Microbiol. 83:14. doi: 10.1128/aem.00 Zimmermann, M., Leifeld, J., Schmidt, M., Smith, P., and Fuhrer, J. (2007). 966-17 Measured soil organic matter fractions can be related to pools in the Urbanova, M., Snajdr, J., and Baldrian, P. (2015). Composition of fungal and RothC model. Eur. J. Soil Sci. 58, 658–667. doi: 10.1111/j.1365-2389.2006. bacterial communities in forest litter and soil is largely determined by dominant 00855.x trees. Soil Biol. Biochem. 84, 53–64. doi: 10.1016/j.soilbio.2015.02.011 Wagg, C., Bender, S. F., Widmer, F., and van der Heijden, M. G. A. (2014). Conflict of Interest: The authors declare that the research was conducted in the Soil biodiversity and soil community composition determine ecosystem absence of any commercial or financial relationships that could be construed as a multifunctionality. Proc. Natl. Acad. Sci. U.S.A. 111, 5266–5270. doi: 10.1073/ potential conflict of interest. pnas.1320054111 Wang, J., Shen, J., Wu, Y., Tu, C., Soininen, J., Stegen, J. C., et al. (2013). Copyright © 2021 Lin, Baldrian, Li, Novotny, Heděnec, Kukla, Umari, Meszárošová Phylogenetic beta diversity in bacterial assemblages across ecosystems: and Frouz. This is an open-access article distributed under the terms of the Creative deterministic versus stochastic processes. ISME J. 7:1310. doi: 10.1038/ismej. Commons Attribution License (CC BY). The use, distribution or reproduction in 2013.30 other forums is permitted, provided the original author(s) and the copyright owner(s) Wang, N. F., Zhang, T., Yang, X., Wang, S., Yu, Y., Dong, L. L., et al. (2016). are credited and that the original publication in this journal is cited, in accordance Diversity and composition of bacterial community in soils and lake sediments with accepted academic practice. No use, distribution or reproduction is permitted from an Arctic Lake Area. Front. Microbiol. 7:9. doi: 10.3389/fmicb.2016.01170 which does not comply with these terms. Frontiers in Microbiology | www.frontiersin.org 11 June 2021 | Volume 12 | Article 676251
You can also read


