Brief communication: A submarine wall protecting the Amundsen Sea intensifies melting of neighboring ice shelves - The Cryosphere
←
→
Page content transcription
If your browser does not render page correctly, please read the page content below
The Cryosphere, 13, 2317–2324, 2019
https://doi.org/10.5194/tc-13-2317-2019
© Author(s) 2019. This work is distributed under
the Creative Commons Attribution 4.0 License.

Brief communication: A submarine wall protecting the Amundsen
Sea intensifies melting of neighboring ice shelves
Özgür Gürses1 , Vanessa Kolatschek1 , Qiang Wang1 , and Christian Bernd Rodehacke1,2
1 Alfred-Wegener-Institut  Helmholtz-Zentrum für Polar- und Meeresforschung, 27570 Bremerhaven, Germany
2 Danish   Meteorological Institute, Copenhagen Ø, 2100, Denmark

Correspondence: Christian B. Rodehacke (christian.rodehacke@awi.de)

Received: 11 February 2019 – Discussion started: 15 March 2019
Revised: 22 July 2019 – Accepted: 14 August 2019 – Published: 6 September 2019

Abstract. Disintegration of ice shelves in the Amundsen Sea,        In Antarctica, remotely sensed, modeled and paleoclima-
in front of the West Antarctic Ice Sheet, has the potential      tological proxy data indicate that the highest potential sea
to cause sea level rise by inducing an acceleration of ice       level contribution will come from the West Antarctic Ice
discharge from upstream grounded ice. Moore et al. (2018)        Sheet (Bamber et al., 2009; Golledge et al., 2013; Joughin
proposed that using a submarine wall to block the penetra-       and Alley, 2011; Pollard and DeConto, 2009; Sutter et al.,
tion of warm water into the subsurface cavities of these ice     2016), particularly from the Amundsen Sea sector, where
shelves could reduce this risk. We use a global sea ice–ocean    the progressive thinning of its ice shelves over the last
model to show that a wall shielding the Amundsen Sea be-         2.5 decades has greatly enhanced rates of ice mass loss em-
low 350 m depth successfully suppresses the inflow of warm       anating from this sector (Pritchard et al., 2012; Rignot et al.,
water and reduces ice shelf melting. However, these warm         2014; Shepherd et al., 2018). Here ice shelves currently pre-
water masses get redirected towards neighboring ice shelves,     vent unrestricted flow of ice streams into the ocean. Here,
which reduces the net effectiveness of the wall. The ice loss    warm high-salinity Circumpolar Deep Water (CDW) has
is reduced by 10 %, integrated over the entire Antarctic con-    been observed to flow onto the continental shelf and flood the
tinent.                                                          cavities underneath the Amundsen Sea sector’s ice shelves,
                                                                 driving high rates of basal melting (Depoorter et al., 2013; Ja-
                                                                 cobs et al., 2011; Jenkins et al., 2018; Pritchard et al., 2012).
1   Introduction                                                 Various processes control the flow of warm water masses (a
                                                                 body of ocean water with a common formation history and
One of the consequences of the warming of Earth’s climate        a defined range of tracers, such as temperature and salinity,
is sea level rise (Vaughan et al., 2013). Sea level rise will    is called water mass) predominately via glacially scoured
impact coastal societies and economic activity in these ar-      submarine troughs (Bingham et al., 2012; Dutrieux et al.,
eas. Currently, the main contributors to rising global mean      2014) into the ice shelf cavities. It includes wind-driven Ek-
sea level are the thermal expansion of the world’s ocean, the    man transport, whereby variations in offshore wind stresses,
mass losses emanating from the Greenland Ice Sheet, and the      also altered by local sea ice conditions (Kim et al., 2017), lift
worldwide recession of mountain glaciers and ice caps (Chen      CDW onto the continental shelf (Dutrieux et al., 2014; Kim
et al., 2017; Rietbroek et al., 2016; Shepherd et al., 2012).    et al., 2017; Paolo et al., 2018; Schmidt et al., 2013). Dur-
The remaining smaller sources are continental groundwater        ing its transport onto the continental shelf, the water mass is
depletion (Wada et al., 2012) and the Antarctic Ice Sheet        transformed into modified CDW (mCDW) by mixing with
(King et al., 2012; Rietbroek et al., 2016; Shepherd et al.,     local, fresher on-shelf water masses (Webber et al., 2017,
2012); though Antarctica’s sea level contribution has accel-     2018). In the Amundsen Sea, decadal-scale changes in the
erated in recent decades (King et al., 2012; Rietbroek et al.,   draft and intensity of the CDW incursion onto the continen-
2016; Rignot et al., 2011).                                      tal shelf – and ultimately the basal melting of the ice masses

Published by Copernicus Publications on behalf of the European Geosciences Union.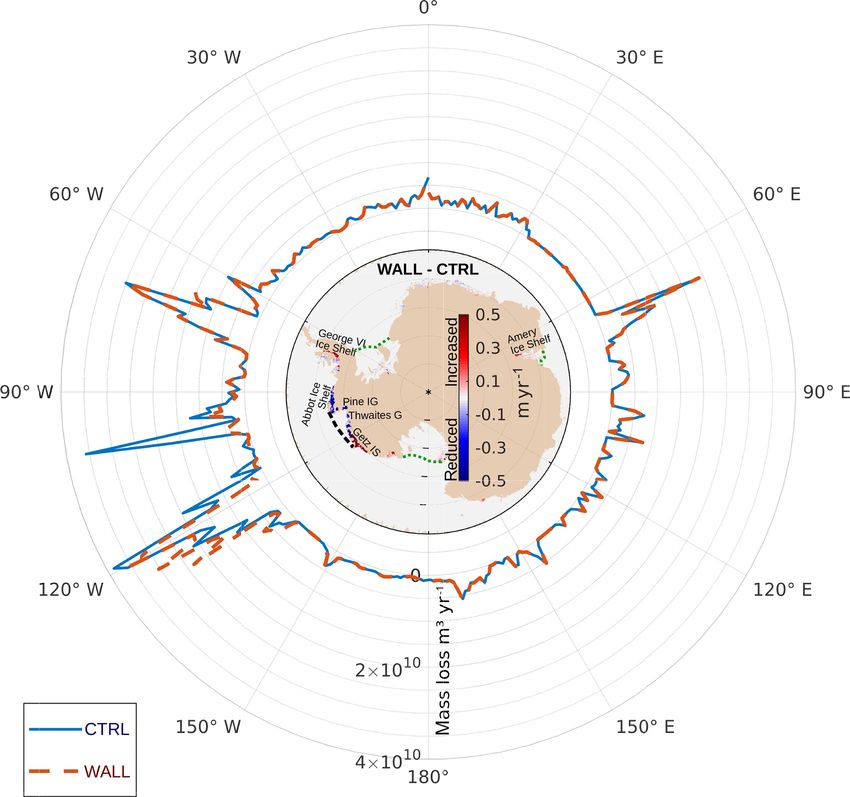
2318                                 Ö. Gürses et al.: A wall in the Amundsen Sea intensifies melting of nearby ice shelves

fringing this sector of Antarctica – have also been directly
linked to changes in large-scale oceanic and atmospheric cir-
culation, including the influence of El Niño–Southern Oscil-
lation (ENSO)-induced atmospheric wave trains propagating
towards this region from the central tropical Pacific Ocean
(Dutrieux et al., 2014; Jenkins et al., 2018; Nakayama et al.,
2018; Steig et al., 2012). These processes together drive the
detected retreat of ice shelves in the Amundsen Sea through
decadal oceanographic variability (Jenkins et al., 2018).
   Since the West Antarctic Ice Sheet resides on retrograde-
sloping bedrock topography (Fretwell et al., 2013), it is in-
herently susceptible to marine ice sheet instability (Schoof,
2007; Weertman, 1974), whereby the reduced buttressing ef-
fect of thinning ice shelves triggers the retreat of upstream
ice, leading to larger ice thickness at the grounding line –
the grounding line marks the transition from grounded ice
to floating ice. This amplifies the ice flux across the new
grounding line, which stretches and thins the ice further and
ultimately triggers additional grounding line retreat. This
sustained retreat accelerates the transport of grounded inland
ice towards the ocean past the grounding line, where it di-
rectly contributes to sea level rise (by iceberg calving and       Figure 1. Modeled and observed seafloor ocean potential temper-
ocean-driven melting).                                             atures (θbottom ) in the Amundsen Sea sector of West Antarctica.
   Moore et al. (2018) proposed a targeted geoengineering          The plot shows the simulated mean ocean temperatures for the con-
project that could reduce the risk of this ice sheet instability   trol run (CTRL, years 1948–2007), while circles (ANT XI/3; Miller
by protecting the ice shelves from warm Circumpolar Deep           and Grobe, 1996) or diamonds (ANT XXVI/3; Gohl, 2010) repre-
Water via the erection of a submarine wall. Wolovick and           sent observed bottom temperatures taken in 1994 and 2010, respec-
Moore (2018) tested this idea with a simple flow line model        tively. The solid green lines follow shelf ice edges, and the inset
(two-dimensional x–z plane model) of Thwaites Glacier –            shows the location of the area of interest as a red box.The following
one of the largest contributors of ice discharge into the          abbreviations are used: Abbot IS (Abbot Ice Shelf), Pine IG (Pine
                                                                   Island Glacier), Thwaites G (Thwaites Glacier) and Getz IS (Getz
Amundsen Sea (Shepherd et al., 2018; Turner et al., 2017).
                                                                   Ice Shelf).
In addition to the erection of a submarine wall, they imposed
artificial pinning points to enhance the buttressing effect of
ice shelves on grounded ice (cf. Moore et al., 2018). Both         vertical levels (z coordinate). The interaction between the
measures successfully reduced ice mass loss emanating from         ocean and static ice shelves occurs via the three-equation
this sector of Antarctica (Wolovick and Moore, 2018).              system that describes the flux of heat and fresh water be-
   In this paper, we investigate how a submarine wall shield-      tween the ocean and ice shelf base through an exchange-
ing the Amundsen Sea embayment (Fig. 2a) reduces the basal         controlling boundary layer (Hellmer and Olbers, 1989; Hol-
melting rates of ice shelves flowing into the Amundsen Sea         land and Jenkins, 1999). FESOM has proven its applicability
embayment. The warm water masses rejected by the wall en-          for oceanographic studies of the Southern Ocean (Hellmer
hance ice shelves west of the wall. These effects counteract       et al., 2012; Nakayama et al., 2014; Timmermann et al.,
the wall’s purpose of mitigating sea level rise. In this study,    2012). While coarse-resolution models have been found to
we neglect feedbacks between changes of basal melting rates        underestimate the ocean-induced basal melting of Antarc-
and advance or retreat of impacted ice shelves. We do not          tica’s ice shelves (Naughten et al., 2018), our basal melting
analyze how the wall hinders the exchange of nutrients and         rates (Fig. 1b) are in reasonable agreement with recent obser-
influences submarine biological processes.                         vational estimates (Rignot et al., 2013). The model utilizes
                                                                   the ocean bathymetry, ice shelf geometry, and grounding line
                                                                   position data of RTOPO-1 (Timmermann et al., 2010). We
2   Model setup                                                    use the CORE-II forcing for atmospheric conditions (Large
                                                                   and Yeager, 2008), covering the years 1948–2007, to drive
We use a global finite-element ocean model (FESOM; Wang            the ocean model. This forcing period is run twice. The first
et al., 2014) to test the effects of erecting a wall in front      full period is considered spin-up and, hence, we restrict our
of the Amundsen Sea sector’s ice shelves. The model has            analysis to the last complete forcing period.
a variable horizontal resolution of (minimum 5 km) around
Antarctica and its adjacent ice shelf cavities and has 100

The Cryosphere, 13, 2317–2324, 2019                                                      www.the-cryosphere.net/13/2317/2019/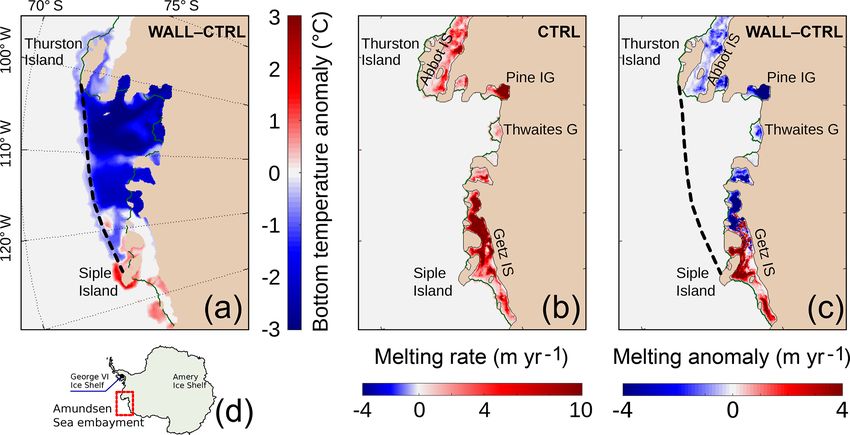
Ö. Gürses et al.: A wall in the Amundsen Sea intensifies melting of nearby ice shelves 2319
Considerable oceanic variability has been detected at both of the walled region. This causes the temperature to rise in
seasonal and interannual timescales in front of both Pine Is- the westernmost corner of the walled region around Siple Is-
land (Webber et al., 2017) and Dotson Ice Shelf, located be- land because the warm water mass penetrates via the Getz Ice
tween Thwaites Glacier and Getz Ice Shelf, (Jenkins et al., Shelf (between the grounding line of Antarctica and Siple Is-
2018). It is driven by both local and remote forcing. Hence, land) into the walled region.
we shall expect some differences between merged hydro- In the walled region, the lower ocean temperature reduces
graphic observations and a simulated long-term mean, while the melting of ice shelves (Fig. 2a and c). However, the re-
a reliable climatological data set is lacking for our region of strained warm water mass advances into the neighboring re-
interest. Therefore, we use existing observations for compar- gion, where ice shelves experience intensified melting and
ison with our simulations under the assumption that avail- amplified ice mass loss (central and western Getz Ice Shelf;
able observations represent a quasi-mean state. Measured Fig. 2b). Therefore, the warm water mass that would have
bottom temperatures, predominantly taken in austral summer otherwise impacted the Amundsen Sea embayment, shifts to
by the marine cruises ANT XI/3 (Miller and Grobe, 1996) neighboring ice shelves.
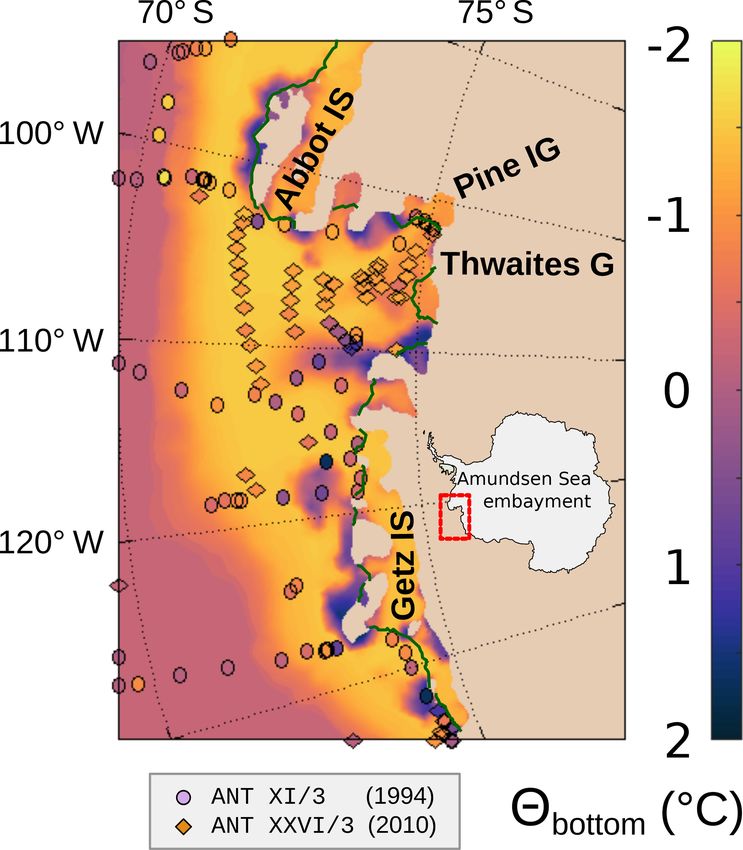
and ANT XXVI/3 (Gohl, 2010), confirm that the simulated Figure 3 depicts the longitudinal distribution of the simu-
bottom temperature distribution is reasonable (Fig. 1). lated basal melting rates around Antarctica, with and without
We investigate differences in ice shelf basal melting with erection of the submarine wall. In the Amundsen Sea em-
(WALL) and without (CTRL) the erection of a wall sur- bayment the ice mass loss around Pine Island drops signifi-
rounding the Amundsen Sea (Fig. 2a). This feature follows cantly (by 85 %). This phenomenon contrasts with increased
the approximate location of the continental shelf break and ice mass loss detected at Getz Ice Shelf (∼ 130◦ W, east-
blocks any circulation below 350 m depth, such as the CDW ern Marie Byrd Land), where melting increases by approx-
inflow from the deep ocean onto the Amundsen Sea sector’s imately 50 %. As discussed above, basal melting is reduced
continental shelf (Fig. 2). The wall proposed by Moore et in the western Bellingshausen Sea. In addition to the de-
al. (2018) blocks only the channelized flow of warm water in creased melting simulated underneath the Abbot Ice Shelf,
troughs leading directly to Pine Island and Thwaites glaciers, basal melting at George VI Ice Shelf increases by up to 10 %.
while our wall, with a length of about 800 km, is substantially The wall has little impact on basal melting of ice shelves
longer than the initially proposed wall in size and shields the fed by ice streams from the East Antarctic Ice Sheet, ex-
entire Amundsen Sea embayment. cept for the Amery Ice Shelf, where the rate increases by ap-
proximately 5 %. The wall in the Amundsen Sea most prob-
ably triggers a perturbation that propagates via the Antarctic
3 Results Coastal Current towards the Prydz Bay in front of the Amery
Ice Shelf. All the above-reported intensified melting rates are
Consistent with oceanographic observations, our CTRL ex- larger than the standard deviation (1-σ ) of the 20-year melt-
periment accurately simulates the ingress and delivery of ing rate.
warm mCDW through submarine troughs towards the ice Besides regional changes in the basal melting rates, we in-
shelves fringing the Amundsen Sea sector (Fig. 1). Mea- spect the continent-wide integrated effect. The reduced ice
sured bottom temperatures, acquired in austral summer, also loss in the Amundsen Sea embayment is larger than the cor-
strongly agree with the spatial distribution of our simulated responding enhanced melting at the western end of the wall.
temperatures, giving confidence in our abilities to accurately The total ice loss by ice shelves around Antarctica is 10 %
predict basal melting in the present study (Fig. 1). lower for the WALL experiment.
Contrary to our CTRL experiment, our erected wall blocks
the ocean below 350 m depth and suppresses the direct in-
flow of CDW to the interior of the Amundsen Sea embay- 4 Conclusions
ment in front of western Marie Byrd Land. Consequently,
the simulated ocean is generally cooler (Fig. 2a) and fresher In this study, a submarine wall erected along the continental
within the walled region. This colder water column sup- shelf of the Amundsen Sea is found to suppress the inflow
ports enhanced sea ice formation, which releases brine into of Circumpolar Deep Water onto the continental shelf. This
the underlying ocean across this region. However, the brine- freshens and cools water masses residing shoreward of the
induced salinification is insufficient to compensate for the wall, resulting in significantly reduced basal melting rates of
salinity supply of the unobstructed mCDW inflow. the ice shelves located there. However, inflowing warm Cir-
We also detect a slight cooling of the bottom tempera- cumpolar Deep Water (CDW) seaward of this wall is found
tures east of the walled region. The outflow of cooler wa- to be redirected westward towards Getz Ice Shelf, where it
ter masses from the walled region via the Abbot Ice Shelf’s enhances basal melting by up to 50 %. In particular, the ice
sub-ice-shelf cavity (south of Thurston Island) contributes to shelves to the west (central and west Getz Ice Shelf) show
this cooling (Fig. 2a and b). The deflected warm water mass steeply increased melting rates. Hence, the wall reduces the
flows westward and raises the temperature on the west side ice loss of the most vulnerable ice shelves along the mar-
www.the-cryosphere.net/13/2317/2019/ The Cryosphere, 13, 2317–2324, 20192320 Ö. Gürses et al.: A wall in the Amundsen Sea intensifies melting of nearby ice shelves Figure 2. Simulated potential ocean temperature anomaly (WALL – CTRL) (a) and simulated basal ice shelf melting rates (CTRL) in (b) and its anomaly (c). Panel (a) shows the simulated potential ocean temperature anomaly (WALL−CTRL) on the seafloor of the Amundsen Sea embayment and its adjacent ice shelf cavities. The location of the wall is marked as a dashed line, and the embayment region is defined in the map (d). Panel (b) shows the simulated melting rates for the control run (CTRL), and panel (c) shows the basal melting anomaly (WALL – CTRL). Solid green lines highlight ice shelf edges. The following abbreviations are used: Abbot IS (Abbot Ice Shelf), Pine IG (Pine Island Glacier), Thwaites G (Thwaites Glacier) and Getz IS (Getz Ice Shelf). gin of the West Antarctic Ice Sheet, which is, however, not could vanish if we included atmosphere–ocean feedbacks. compensated for by enhanced melting in the west. Integrated Here only simulations coupled to the atmosphere would al- over Antarctica, the wall decreases ice loss by 10 %. Our re- low for confirming the robustness of these features. sults indicate that suppressing the flow of warm water masses The used bedrock topography and ice shelf geometry data into a restricted group of ice shelves results in redirecting it set influences the melting rate of individual ice shelf caverns, towards a different location. There it enhances basal melt- as it has been shown for the smaller Crosson and Dotson ice ing and, ultimately, amplifies ice mass loss. However, it is shelves, which also drain into the Amundsen Sea (Goldberg an open question if this triggers marine ice sheet instability et al., 2019). Hence, the most updated data sets would be pre- in the other shelves because the stability depends strongly ferred; however, existing inconsistencies between the most on the distribution of pinning points, sloping of the bed, the updated data sets, which are seen in differences of the re- depth and width of submarine troughs, and the softness of ported grounding positions, freeboard heights, and bedrock the bed. The onshore bed properties of eastern Marie Byrd elevation, require the use of data products, such as RTOPO. Land, where Pine Island and Thwaites glaciers are located, Therefore, we use RTOPO instead of the most updated prod- are most likely vulnerable to the marine ice sheet instabil- ucts. Since our simulations are consistent with prior studies ity. Numerous modeling studies show a relic ice cap in west- using RTOPO, the quality of our simulations could be judged ern Marie Byrd Land on the elevated bedrock topography, in the light of previous studies. even after part of the West Antarctic Ice Sheet (WAIS) has Would we detect the penetration of warm water masses collapsed (e.g., DeConto and Pollard, 2016; Feldmann and via the Getz Ice Shelf into the walled region if we used other Levermann, 2015; Golledge et al., 2015; Winkelmann et al., bathymetry or bedrock topography data sets? If all ice were 2015). Hence, western Marie Byrd Land is favorable for a grounded between the western end of the wall and the coast- stable situation. However, the bed properties under the ice line, we would not see any flow of warm water into the walled are still insufficiently known. region. However, we would detect enhanced melting, which Our fully coupled sea ice–ocean model, which includes may open up a route into the protected region. Hence, fully ice shelves and ocean–ice shelf interaction, is driven by a coupled ice sheet–ocean model simulations, where the ge- prescribed atmospheric forcing. Hence, any feedbacks, such ometry of ice shelves are changed by melting and refreezing, as changing ocean surface conditions that impact the atmo- would reveal the vulnerability of the Getz Ice Shelf. These sphere and change the atmospheric forcing on the ocean, are simulations could also uncover if enhanced melting at the not included. Therefore, small anomalies between both sim- western end of the wall unlocks a back door that opens a ulations (CTRL vs. WALL), such as those seen on George second route to the ice shelves prone to marine ice sheet in- VI Ice Shelf or in Prydz Bay in front of Amery Ice Shelf, stability. The Cryosphere, 13, 2317–2324, 2019 www.the-cryosphere.net/13/2317/2019/
Ö. Gürses et al.: A wall in the Amundsen Sea intensifies melting of nearby ice shelves                                                 2321

                                                                          is too small, as the inflow of warm water masses through the
                                                                          Getz Ice Shelf into the walled region suggests. However, a
                                                                          small wall that only protects Pine Island successfully may
                                                                          redirect the warm water to neighboring ice shelves with a
                                                                          retrograde bed (for example, Thwaites Glacier). There it in-
                                                                          creases basal melting and may trigger marine ice sheet insta-
                                                                          bility. The detected poleward shift of westerly winds in the
                                                                          Southern Ocean under global warming (Miller et al., 2006)
                                                                          might also shift easterly winds along Antarctica’s coast pole-
                                                                          ward, which lifts further the interface of warm water masses
                                                                          (isothermal) along the continental slope (Spence et al., 2014).
                                                                          Ultimately warm water masses could enter the continental
                                                                          shelf directly beside the contemporary path following topo-
                                                                          graphic depressions (troughs). Under these circumstances,
                                                                          the bypassing of a short wall seems to be inevitable if the
                                                                          wall does not block the entire Amundsen Sea embayment
                                                                          from coast to coast.
                                                                             Iron is a micronutrient essential for algal production in the
                                                                          Amundsen Sea (St-Laurent et al., 2017) and the erected wall
                                                                          affects its availability. The wall blocks in the inflow of warm
Figure 3. Mean basal melting rates around Antarctica. Longitude-
specific changes in modeled basal melting with (WALL) and with-           and iron-rich CDW and influences the outflow of iron-rich
out (CTRL) the presence of the submarine wall are shown as dashed         glacial meltwater coming from melting ice shelves. How the
red and solid blue lines surrounding the center map, respectively.        changed nutrient supply impacts the marine biological web
The dashed black line marks the wall’s location in the Amund-             or the uptake and sequestration of carbon dioxide by the
sen Sea. The map of Antarctica shows the spatial distribution of          ocean is unclear and goes beyond this study.
the melting rate anomaly, where positive numbers (red color) rep-            Geoengineering aims to attenuate the impact of the ongo-
resent increased melting rates if the wall is present (see color bar).    ing anthropogenic climate change, such as sea level rise, but
The following abbreviations are used: Pine IG (Pine Island Glacier),      the results of this study suggest that such proposals could
Thwaites G (Thwaites Glacier) and Getz IS (Getz Ice Shelf). Dotted        have adverse side effects. To evaluate the effects of using
green lines depict shelf ice edges of the Ross Ice Shelf, the Filchner-
                                                                          submarine walls to protect Antarctica’s ice shelves in greater
Ronne Ice Shelf and the Amery Ice Shelf.
                                                                          detail, the use of fully coupled ice-sheet–ice-shelf–ocean–
                                                                          atmosphere models should be utilized in future analyses.
                                                                          These models of sufficiently high spatial resolution could ac-
   Regardless of the bathymetry data set used, we are con-                curately simulate changes in sub-ice-shelf cavity geometry
fident that the main findings of this study are robust: a wall            (including track grounding line migration and ice shelf thin-
shielding the Amundsen Sea embayment reduces basal melt-                  ning) as well as the influx of warm water masses (mCDW) to
ing rates within the protected region, the rejected warm wa-              these locations.
ter masses flow along the wall westward, west of the wall
warmer water masses drive enhanced basal melting. The
wall proposed by Moore et al. (2018), which blocks only                   Code and data availability. The FESOM1.4 model code is avail-
the circulation in troughs leading directly to Pine Island and            able at https://swrepo1.awi.de/projects/fesom/ (last access: 4
Thwaites glaciers, would have a length of about 50–100 km                 September 2019), after registration. The atmospheric forc-
and would need 10–50 km3 of material. By comparison, the                  ing data set named “CORE-II“ used here (Large and Yea-
                                                                          ger, 2008) is freely accessible online at https://data1.gfdl.noaa.
construction of the Suez Canal required the excavation of
                                                                          gov/nomads/forms/core/COREv2.html (last access: 4 September
about 1 km2 of material (Moore et al., 2018). The simulated
                                                                          2019). The topography data set RTOPO can be obtained from
wall (length of about 800 km) is substantially larger than the            https://doi.org/10.1594/PANGAEA.741917 (Timmermann et al.,
initially proposed wall in size and shields the entire Amund-             2010). The temporal average of the fractional basal melting changes
sen Sea embayment.                                                        between the CTRL and WALL simulations is obtainable from
   Our results suggest that a too-small wall, for instance,               Zenodo via https://doi.org/10.5281/zenodo.3240250 (Gürses et al.,
blocking only the water flow in the troughs leading to Pine               2019). The remaining data is available from the first author Özgür
Island might be bypassed by warm water masses. For dynam-                 Gürses upon reasonable request.
ical reasons, the (geostrophic) flow of water masses turns to
the left (in the Southern Hemisphere) if it is not hindered by
a topographic obstacle. Therefore, warm water masses might
even recirculate into the ostensibly protected area if the wall

www.the-cryosphere.net/13/2317/2019/                                                             The Cryosphere, 13, 2317–2324, 2019
2322 Ö. Gürses et al.: A wall in the Amundsen Sea intensifies melting of nearby ice shelves
Author contributions. CR designed the study and wrote the Feldmann, J. and Levermann, A.: Collapse of the West Antarc-
manuscript. ÖG and QW developed and configured the model. ÖG tic Ice Sheet after local destabilization of the Amund-
ran the simulations. ÖG and VK performed the analysis. VK and sen Basin, P. Natl. Acad. Sci. USA, 112, 14191–14196,
CR prepared the figures. All authors contributed to the interpreta- https://doi.org/10.1073/pnas.1512482112, 2015.
tion of the results and proofreading of the manuscript. Fretwell, P., Pritchard, H. D., Vaughan, D. G., Bamber, J. L., Bar-
rand, N. E., Bell, R., Bianchi, C., Bingham, R. G., Blanken-
ship, D. D., Casassa, G., Catania, G., Callens, D., Conway, H.,
Competing interests. The authors declare that they have no conflict Cook, A. J., Corr, H. F. J., Damaske, D., Damm, V., Ferracci-
of interest. oli, F., Forsberg, R., Fujita, S., Gim, Y., Gogineni, P., Griggs,
J. A., Hindmarsh, R. C. A., Holmlund, P., Holt, J. W., Jacobel,
R. W., Jenkins, A., Jokat, W., Jordan, T., King, E. C., Kohler,
Acknowledgements. We thank Evan Gowan in particular for his J., Krabill, W., Riger-Kusk, M., Langley, K. A., Leitchenkov,
comments, which greatly improved this paper. We thank both G., Leuschen, C., Luyendyk, B. P., Matsuoka, K., Mouginot,
anonymous reviewers and Mike Wolovick for their comments and J., Nitsche, F. O., Nogi, Y., Nost, O. A., Popov, S. V., Rignot,
engagement in the review process, which improved the manuscript. E., Rippin, D. M., Rivera, A., Roberts, J., Ross, N., Siegert,
M. J., Smith, A. M., Steinhage, D., Studinger, M., Sun, B.,
Tinto, B. K., Welch, B. C., Wilson, D., Young, D. A., Xiangbin,
C., and Zirizzotti, A.: Bedmap2: improved ice bed, surface and
Financial support. This research has been supported by the
thickness datasets for Antarctica, The Cryosphere, 7, 375–393,
German Federal Ministry of Education and Research (Bundesmin-
https://doi.org/10.5194/tc-7-375-2013, 2013.
isterium für Bildung und Forschung, BMBF, grant no. 01LS1612A).
Gohl, K.: The Expedition of the Research Vessel “Polarstern” to
the Amundsen Sea, Antarctica, in 2010 (ANT-XXVI/3), Bremer-
The article processing charges for this open-access
haven, Germany, available at: http://hdl.handle.net/10013/epic.
publication were covered by a Research
35668 (last access: 11 December 2018), 2010.
Centre of the Helmholtz Association.
Goldberg, D. N., Gourmelen, N., Kimura, S., Millan, R.,
and Snow, K.: How Accurately Should We Model Ice
Shelf Melt Rates?, Geophys. Res. Lett., 46, 189–199,
Review statement. This paper was edited by Benjamin Smith and https://doi.org/10.1029/2018GL080383, 2019.
reviewed by two anonymous referees. Golledge, N. R., Levy, R. H., McKay, R. M., Fogwill, C. J., White,
D. A., Graham, A. G. C., Smith, J. A., Hillenbrand, C. D., Licht,
K. J., Denton, G. H., Ackert, R. P., Maas, S. M., and Hall, B.
L.: Glaciology and geological signature of the Last Glacial Max-
References
imum Antarctic ice sheet, Quaternary Sci. Rev., 78, 225–247,
https://doi.org/10.1016/j.quascirev.2013.08.011, 2013.
Bamber, J. L., Riva, R. E. M., Vermeersen, B. L. A., and LeBrocq,
Golledge, N. R., Kowalewski, D. E., Naish, T. R., Levy, R. H., Fog-
A. M.: Reassessment of the potential sea-level rise from a col-
will, C. J., and Gasson, E. G. W.: The multi-millennial Antarc-
lapse of the West Antarctic Ice Sheet, Science, 324, 901–903,
tic commitment to future sea-level rise, Nature, 526, 421–425,
https://doi.org/10.1126/science.1169335, 2009.
https://doi.org/10.1038/nature15706, 2015.
Bingham, R. G., Ferraccioli, F., King, E. C., Larter, R. D., Pritchard,
Gürses, Ö., Kolatschek, V., Wang, Q., and Rodehacke, C. B.:
H. D., Smith, A. M., and Vaughan, D. G.: Inland thinning of West
Brief communication: A submarine wall protecting the Amund-
Antarctic Ice Sheet steered along subglacial rifts, Nature, 487,
sen Sea intensifies melting of neighboring ice shelves, Zenodo
468–471, https://doi.org/10.1038/nature11292, 2012.
https://doi.org/10.5281/zenodo.3240250, 2019.
Chen, X., Zhang, X., Church, J. A., Watson, C. S., King, M. A.,
Hellmer, H. H. and Olbers, D. J.: A two-dimensional model for the
Monselesan, D., Legresy, B., and Harig, C.: The increasing rate
thermohaline circulation under an ice shelf, Antarct. Sci., 1, 325–
of global mean sea-level rise during 1993–2014, Nat. Clim.
336, https://doi.org/10.1017/S0954102089000490, 1989.
Change, 7, 492–495, https://doi.org/10.1038/nclimate3325,
Hellmer, H. H., Kauker, F., Timmermann, R., Determann, J., and
2017.
Rae, J.: Twenty-first-century warming of a large Antarctic ice-
DeConto, R. M. and Pollard, D.: Contribution of Antarctica
shelf cavity by a redirected coastal current, Nature, 485, 225–
to past and future sea-level rise, Nature, 531, 591–597,
228, https://doi.org/10.1038/nature11064, 2012.
https://doi.org/10.1038/nature17145, 2016.
Holland, D. M. and Jenkins, A.: Modeling Thermodynamic
Depoorter, M., Bamber, J. L., Griggs, J. A., Lenaerts, J. T. M.,
Ice-Ocean Interactions at the Base of an Ice Shelf, J.
Ligtenberg, S. R. M., van den Broeke, M. R., and Moholdt, G.:
Phys. Oceanogr., 29, 1787–1800, https://doi.org/10.1175/1520-
Calving fluxes and basal melt rates of Antarctic ice shelves, Na-
0485(1999)0292.0.CO;2, 1999.
ture, 502, 89–92, https://doi.org/10.1038/nature12567, 2013.
Jacobs, S. S., Jenkins, A., Giulivi, C. F., and Dutrieux,
Dutrieux, P., De Rydt, J., Jenkins, A., Holland, P. R., Ha,
P.: Stronger ocean circulation and increased melting under
H. K., Lee, S. H., Steig, E. J., Ding, Q., Abrahamsen, E.
Pine Island Glacier ice shelf, Nat. Geosci., 4, 519–523,
P., and Schröder, M.: Strong Sensitivity of Pine Island Ice-
https://doi.org/10.1038/ngeo1188, 2011.
Shelf Melting to Climatic Variability, Science, 174, 174–178,
Jenkins, A., Shoosmith, D., Dutrieux, P., Jacobs, S., Kim, T.
https://doi.org/10.1126/science.1244341, 2014.
W., Lee, S. H., Ha, H. K., and Stammerjohn, S.: West
The Cryosphere, 13, 2317–2324, 2019 www.the-cryosphere.net/13/2317/2019/Ö. Gürses et al.: A wall in the Amundsen Sea intensifies melting of nearby ice shelves 2323
Antarctic Ice Sheet retreat in the Amundsen Sea driven Rietbroek, R., Brunnabend, S.-E., Kusche, J., Schröter, J., and
by decadal oceanic variability, Nat. Geosci., 11, 733–738, Dahle, C.: Revisiting the contemporary sea-level budget on
https://doi.org/10.1038/s41561-018-0207-4, 2018. global and regional scales, P. Natl. Acad. Sci. USA, 113, 1504–
Joughin, I. and Alley, R. B.: Stability of the West Antarc- 1509, https://doi.org/10.1073/pnas.1519132113, 2016.
tic ice sheet in a warming world, Nat. Geosci., 4, 506–513, Rignot, E., Velicogna, I., van den Broeke, M. R., Monaghan, A., and
https://doi.org/10.1038/ngeo1194, 2011. Lenaerts, J.: Acceleration of the contribution of the Greenland
Kim, T. W., Ha, H. K., Wåhlin, A. K., Lee, S. H., Kim, C. and Antarctic ice sheets to sea level rise, Geophys. Res. Lett., 38,
S., Lee, J. H., and Cho, Y. K.: Is Ekman pumping respon- 1–5, https://doi.org/10.1029/2011GL046583, 2011.
sible for the seasonal variation of warm circumpolar deep Rignot, E., Jacobs, S., Mouginot, J., and Scheuchl, B.: Ice-
water in the Amundsen Sea?, Cont. Shelf Res., 132, 38–48, Shelf Melting Around Antarctica, Science, 341, 266–270,
https://doi.org/10.1016/j.csr.2016.09.005, 2017. https://doi.org/10.1126/science.1235798, 2013.
King, M. A., Bingham, R. J., Moore, P., Whitehouse, P. L., Bent- Rignot, E., Mouginot, J., Morlighem, M., Seroussi, H., and
ley, M. J., and Milne, G. A.: Lower satellite-gravimetry esti- Scheuchl, B.: Widespread, rapid grounding line retreat of Pine
mates of Antarctic sea-level contribution, Nature, 491, 586–589, Island, Thwaites, Smith, and Kohler glaciers, West Antarc-
https://doi.org/10.1038/nature11621, 2012. tica, from 1992 to 2011, Geophys. Res. Lett., 41, 3502–3509,
Large, W. G. and Yeager, S. G.: The global climatology of an inter- https://doi.org/10.1002/2014GL060140, 2014.
annually varying air–sea flux data set, Clim. Dynam., 33, 341– Schmidt, H., Rast, S., Bunzel, F., Esch, M., Giorgetta, M., Kinne,
364, https://doi.org/10.1007/s00382-008-0441-3, 2008. S., Krismer, T., Stenchikov, G., Timmreck, C., Tomassini, L., and
Miller, H. and Grobe, H.: Die Expedition ANTARKTIS-XI/3 mit FS Walz, M.: Response of the middle atmosphere to anthropogenic
“Polarstern” 1994 (engl. The Expedition ANTARKTIS-XI/3 of and natural forcings in the CMIP5 simulations with the Max
RV “Polarstern” in 1994), Bremerhaven, Germany, available at: Planck Institute Earth system model, J. Adv. Model. Earth Syst.,
http://epic.awi.de/26366/1/10189.pdf (last access: 11 December 5, 98–116, https://doi.org/10.1002/jame.20014, 2013.
2018), 1996. Schoof, C.: Marine ice-sheet dynamics. Part 1. The
Miller, R. L., Schmidt, G. A., and Shindell, D. T.: Forced annular case of rapid sliding, J. Fluid Mech., 573, 27–55,
variations in the 20th century Intergovernmental Panel on https://doi.org/10.1017/S0022112006003570, 2007.
Climate Change Fourth Assessment Report models, J. Geophys. Shepherd, A., Ivins, E. R., Geruo, A., Barletta, V. R., Bentley,
Res., 111, D18101, https://doi.org/10.1029/2005JD006323, M. J., Bettadpur, S., Briggs, K. H., Bromwich, D. H., Fors-
2006. berg, R., Galin, N., Horwath, M., Jacobs, S., Joughin, I., King,
Moore, J. C., Gladstone, R., Zwinger, T., and Wolovick, M.: Geo- M. A., Lenaerts, J. T. M., Li, J., Ligtenberg, S. R. M., Luck-
engineer polar glaciers to slow sea-level rise, Nature, 555, 303– man, A., Luthcke, S. B., McMillan, M., Meister, R., Milne, G.,
305, https://doi.org/10.1038/d41586-018-03036-4, 2018. Mouginot, J., Muir, A., Nicolas, J. P., Paden, J., Payne, A. J.,
Nakayama, Y., Timmermann, R., Rodehacke, C. B., Schröder, M., Pritchard, H., Rignot, E., Rott, H., Sorensen, L. S., Scambos, T.
and Hellmer, H. H.: Modeling the spreading of glacial melt wa- A., Scheuchl, B., Schrama, E. J. O., Smith, B., Sundal, A. V.,
ter from the Amundsen and Bellingshausen Seas, Geophys. Res. van Angelen, J. H., van de Berg, W. J., van den Broeke, M. R.,
Lett., 41, 7942–7949, https://doi.org/10.1002/2014GL061600, Vaughan, D. G., Velicogna, I., Wahr, J., Whitehouse, P. L., Wing-
2014. ham, D. J., Yi, D., Young, D., and Zwally, H. J.: A Reconciled
Nakayama, Y., Menemenlis, D., Zhang, H., Schodlok, M., and Estimate of Ice-Sheet Mass Balance, Science, 338, 1183–1189,
Rignot, E.: Origin of Circumpolar Deep Water intruding onto https://doi.org/10.1126/science.1228102, 2012.
the Amundsen and Bellingshausen Sea continental shelves, Nat. Shepherd, A., Fricker, H. A., and Farrell, S. L.: Trends and con-
Commun., 9, 3403, https://doi.org/10.1038/s41467-018-05813- nections across the Antarctic cryosphere, Nature, 558, 223–232,
1, 2018. https://doi.org/10.1038/s41586-018-0171-6, 2018.
Naughten, K. A., Meissner, K. J., Galton-Fenzi, B. K., Eng- Spence, P., Griffies, S. M., England, M. H., Hogg, A. M.,
land, M. H., Timmermann, R., Hellmer, H. H., Hattermann, Saenko, O. A., and Jourdain, N. C.: Rapid subsurface warm-
T., and Debernard, J. B.: Intercomparison of Antarctic ice- ing and circulation changes of Antarctic coastal waters by
shelf, ocean, and sea-ice interactions simulated by MetROMS- poleward shifting winds, Geophys. Res. Lett., 41, 4601–4610,
iceshelf and FESOM 1.4, Geosci. Model Dev., 11, 1257–1292, https://doi.org/10.1002/2014GL060613, 2014.
https://doi.org/10.5194/gmd-11-1257-2018, 2018. St-Laurent, P., Yager, P. L., Sherrell, R. M., Stammerjohn, S. E.,
Paolo, F. S., Padman, L., Fricker, H. A., Adusumilli, S., Howard, and Dinniman, M. S.: Pathways and supply of dissolved iron in
S., and Siegfried, M. R.: Response of Pacific-sector Antarctic ice the Amundsen Sea (Antarctica), J. Geophys. Res.-Ocean, 122,
shelves to the El Niño/Southern Oscillation, Nat. Geosci., 11, 7135–7162, https://doi.org/10.1002/2017JC013162, 2017.
121–126, https://doi.org/10.1038/s41561-017-0033-0, 2018. Steig, E. J., Ding, Q., Battisti, D. S., and Jenkins, A.: Tropical forc-
Pollard, D. and DeConto, R. M.: Modelling West Antarctic ice sheet ing of Circumpolar Deep Water Inflow and outlet glacier thin-
growth and collapse through the past five million years., Nature, ning in the Amundsen Sea Embayment, West Antarctica, Ann.
458, 329–332, https://doi.org/10.1038/nature07809, 2009. Glaciol., 53, 19–28, https://doi.org/10.3189/2012AoG60A110,
Pritchard, H. D., Ligtenberg, S. R. M., Fricker, H. A., Vaughan, D. 2012.
G., van den Broeke, M. R., and Padman, L.: Antarctic ice-sheet Sutter, J., Gierz, P., Grosfeld, K., Thoma, M., and Lohmann, G.:
loss driven by basal melting of ice shelves, Nature, 484, 502–505, Ocean temperature thresholds for Last Interglacial West Antarc-
https://doi.org/10.1038/nature10968, 2012. tic Ice Sheet collapse, Geophys. Res. Lett., 43, 2675–2682,
https://doi.org/10.1002/2016GL067818, 2016.
www.the-cryosphere.net/13/2317/2019/ The Cryosphere, 13, 2317–2324, 20192324 Ö. Gürses et al.: A wall in the Amundsen Sea intensifies melting of nearby ice shelves Timmermann, R., Le Brocq, A., Deen, T., Domack, E., Dutrieux, Wada, Y., van Beek, L. P. H., Sperna Weiland, F. C., Chao, B. F., P., Galton-Fenzi, B., Hellmer, H., Humbert, A., Jansen, D., Jenk- Wu, Y.-H., and Bierkens, M. F. P.: Past and future contribution ins, A., Lambrecht, A., Makinson, K., Niederjasper, F., Nitsche, of global groundwater depletion to sea-level rise, Geophys. Res. F., Nøst, O. A., Smedsrud, L. H., and Smith, W. H. F.: A con- Lett., 39, L09402, https://doi.org/10.1029/2012GL051230, 2012. sistent data set of Antarctic ice sheet topography, cavity geom- Wang, Q., Danilov, S., Sidorenko, D., Timmermann, R., Wek- etry, and global bathymetry, Earth Syst. Sci. Data, 2, 261–273, erle, C., Wang, X., Jung, T., and Schröter, J.: The Finite Ele- https://doi.org/10.5194/essd-2-261-2010, 2010. ment Sea Ice-Ocean Model (FESOM) v.1.4: formulation of an Timmermann, R., Wang, Q., and Hellmer, H. H.: Ice- ocean general circulation model, Geosci. Model Dev., 7, 663– shelf basal melting in a global finite-element sea- 693, https://doi.org/10.5194/gmd-7-663-2014, 2014. ice/ice-shelf/ocean model, Ann. Glaciol., 53, 303–314, Webber, B. G. M., Heywood, K. J., Stevens, D. P., Dutrieux, P., https://doi.org/10.3189/2012AoG60A156, 2012. Abrahamsen, E. P., Jenkins, A., Jacobs, S. S., Ha, H. K., Lee, Timmermann, R., Le Brocq, A. M., Deen, T. J., Domack, E. S. H., and Kim, T. W.: Mechanisms driving variability in the W., Dutrieux, P., Galton-Fenzi, B., Hellmer, H. H., Hum- ocean forcing of Pine Island Glacier, Nat. Commun., 8, 1–8, bert, A., Jansen, D., Jenkins, A., Lambrecht, A., Makinson, https://doi.org/10.1038/ncomms14507, 2017. K., Niederjasper, F., Nitsche, F.-O., Nøst, O. A., Smedsrud, Webber, B. G. M., Heywood, K. J., Stevens, D. P., and Assmann, L. H., and Smith, W.: Antarctic ice sheet topography, cav- K. M.: The Impact of Overturning and Horizontal Circulation in ity geometry, and global bathymetry (RTopo 1.0.5-beta). PAN- Pine Island Trough on Ice Shelf Melt in the Eastern Amundsen GAEA, https://doi.org/10.1594/PANGAEA.741917 (last access: Sea, J. Phys. Oceanogr., 49, 63–83, https://doi.org/10.1175/jpo- 4 September 2019), Supplement to: Timmermann, R. et al. d-17-0213.1, 2018. (2010): A consistent dataset of Antarctic ice sheet topography, Weertman, J.: Stability of the junction of an ice sheet and an ice cavity geometry, and global bathymetry, Earth Syst. Sci. Data, 2, shelf, J. Glaciol., 13, 3–11, 1974. 261–273, https://doi.org/10.5194/essd-2-261-2010, 2010. Winkelmann, R., Levermann, A., Ridgwell, A., and Caldeira, Turner, J., Orr, A., Gudmundsson, G. H., Jenkins, A., Bing- K.: Combustion of available fossil fuel resources sufficient ham, R. G., Hillenbrand, C. D., and Bracegirdle, T. J.: to eliminate the Antarctic Ice Sheet, Sci. Adv., 1, e1500589, Atmosphere-ocean-ice interactions in the Amundsen Sea Em- https://doi.org/10.1126/sciadv.1500589, 2015. bayment, West Antarctica, Rev. Geophys., 55, 235–276, Wolovick, M. J. and Moore, J. C.: Stopping the flood: could we https://doi.org/10.1002/2016RG000532, 2017. use targeted geoengineering to mitigate sea level rise?, The Vaughan, D. G., Comiso, J. C., Allison, I., Carrasco, J., Kaser, Cryosphere, 12, 2955–2967, https://doi.org/10.5194/tc-12-2955- G., Kwok, R., Mote, R., Murray, T., Paul, F., Rn, J., Rignot, 2018, 2018. E., Solomina, O., Steffen, K., and Zhang, T.: Observations: Cryosphere, in: Climate Change 2013: The Physical Science Ba- sis. Contribution of Working Group I to the Fifth Assessment Re- port of the Intergovernmental Panel on Climate Change, edited by: Stocker, T. F., Qin, D., Plattner, G.-K., Tignor, M., Allen, S. K., Boschung, J., Nauels, A., Xia, Y., Bex, V., and Midgley, P. M., 66 pp., Cambridge University Press, Cambridge, UK and New York, NY, USA, available at: http://www.ipcc.ch/report/ar5/wg1/ (last access: 14 August 2018), 2013. The Cryosphere, 13, 2317–2324, 2019 www.the-cryosphere.net/13/2317/2019/
You can also read