Nondetection of Water-ice Grains in the Coma of Comet 46P/Wirtanen and Implications for Hyperactivity
←
→
Page content transcription
If your browser does not render page correctly, please read the page content below
The Planetary Science Journal, 2:176 (14pp), 2021 October                                                                     https://doi.org/10.3847/PSJ/ac135a
© 2021. The Author(s). Published by the American Astronomical Society.

Nondetection of Water-ice Grains in the Coma of Comet 46P/Wirtanen and Implications
                                  for Hyperactivity
                        Silvia Protopapa1,6              , Michael S. P. Kelley2,6   , Charles E. Woodward3,6        , and Bin Yang4,5,6
                          1
                              Southwest Research Institute, 1050 Walnut Street, Suite 300, Boulder, CO 80302, USA; sprotopapa@boulder.swri.edu
                                             2
                                               Department of Astronomy, University of Maryland, College Park, MD 20742, USA
                                        3
                                          Minnesota Institute for Astrophysics, University of Minnesota, Minneapolis, MN 55455, USA
                                    4
                                      European Southern Observatory, Alonso de Còrdova 3107, Vitacura, Casilla 19001, Santiago, Chile
                                         5
                                           Núcleo de Astronomía, Facultad de Ingeniería y Ciencias, Universidad Diego Portales, Chile
                                   Received 2020 September 30; revised 2021 June 27; accepted 2021 June 30; published 2021 August 30

                                                                  Abstract
             Hyperactive comets have high water production rates, with inferred sublimation areas of order the surface area of
             the nucleus. Comets 46P/Wirtanen and 103P/Hartley 2 are two examples of this cometary class. Based on
             observations of comet Hartley 2 by the Deep Impact spacecraft, hyperactivity appears to be caused by the ejection
             of water-ice grains and/or water-ice-rich chunks of nucleus into the coma. These materials increase the sublimating
             surface area and yield high water production rates. The historic close approach of comet Wirtanen to Earth in 2018
             afforded an opportunity to test Hartley 2–style hyperactivity in a second Jupiter-family comet. We present high
             spatial resolution, near-infrared spectroscopy of the inner coma of Wirtanen. No evidence for the 1.5 or 2.0 μm
             water-ice absorption bands is found in six 0.8–2.5 μm spectra taken around perihelion and closest approach to
             Earth. In addition, the strong 3.0 μm water-ice absorption band is absent in a 2.0–5.3 μm spectrum taken near
             perihelion. Using spectroscopic and sublimation lifetime models, we set constraints on the physical properties of
             the ice grains in the coma, assuming they are responsible for the comet’s hyperactivity. We rule out pure water-ice
             grains of any size, given their long lifetime. Instead, the hyperactivity of the nucleus and lack of water-ice
             absorption features in our spectra can be explained either by icy grains on the order of 1 μm in size with a small
             amount of low-albedo dust (greater than 0.5% by volume) or by large chunks containing significant amounts of
             water ice.
             Unified Astronomy Thesaurus concepts: Coma dust (2159); Comae (271); Short period comets (1452); Near
             infrared astronomy (1093); Spectroscopy (1558)
             Supporting material: data behind figures

                                    1. Introduction                                      heterogeneous surface activity, dominated by a single small
                                                                                         active area (A’Hearn et al. 2011). This area produced bright jets
   The Deep Impact eXtended Investigation (DIXI) flyby of
                                                                                         in the inner few kilometers of the coma, enriched in CO2 gas
comet 103P/Hartley 2 (hereafter H2) provided new insight into
                                                                                         and pure water-ice grains on the order of 1 μm in diameter
the role of water ice and its relation to the activity level of
                                                                                         (Protopapa et al. 2014). These observations of H2 have formed
comets (A’Hearn et al. 2011). H2 is a hyperactive comet, i.e., a
                                                                                         the basis for our current understanding of comet hyperactivity:
comet with an extremely high water production rate for the                               the ejection of water-ice grains into the coma increases the
given nucleus size. Cometary activity is commonly expressed                              available surface area for water sublimation, which in turn
in terms of active fraction: the surface area of water ice needed                        contributes to the high observed water production rate.
to sustain the activity, generally referred to as “minimum active                        However, this remains a hypothesis given that the contribution
area” (Keller 1990; Combi et al. 2011), divided by the surface                           of the small icy grains to the comet’s water production rate was
area of the nucleus. For most comets, the active fraction is                             poorly constrained. In addition to the 1 μm water-ice grains, a
typically from a few percent to 30% (A’Hearn et al. 1995, after                          second population of particles was detected: distinct, isolated
correcting for the factor of 2 error noted by Knight et al. 2021;                        grains that in visible images surround the nucleus of H2,
see also Lis et al. 2019). Hyperactive comets are unusual in that                        estimated by their brightness to be centimeter sized or larger
their gas production rates require an active fraction of ∼100%                           (Kelley et al. 2013, 2015). The true composition of these
(A’Hearn et al. 1995). In the specific case of H2, Combi et al.                           particles is unknown. However, if these would be ice-rich
(2011) estimated an active fraction of ∼100% during the 2010                             chunks and would behave as mini-comet nuclei with photo-
apparition. However, rather than a 100% active surface, Deep                             metric properties similar to the nucleus of H2, they could
Impact’s close-up view of H2 on 2010 November revealed                                   account for the comet’s hyperactivity (Kelley et al. 2015).
6
                                                                                         Therefore, to summarize, sublimating water ice in the coma,
  Visiting Astronomer at the Infrared Telescope Facility, which is operated by           whether in the form of small grains and/or in large chunks of
the University of Hawaii under contract 80HQTR19D0030 with the National
Aeronautics and Space Administration.                                                    nucleus, could explain the high activity fraction of comet H2.
                                                                                            To test the scenario laid out by Deep Impact’s observations
                 Original content from this work may be used under the terms
                                                                                         at comet H2, and to verify whether the H2 case is an isolated
                 of the Creative Commons Attribution 4.0 licence. Any further            phenomenon or other small hyperactive comets display a
distribution of this work must maintain attribution to the author(s) and the title       water-ice grain halo, we took advantage of the historic close
of the work, journal citation and DOI.                                                   approach between Earth and comet 46P/Wirtanen (2018

                                                                                     1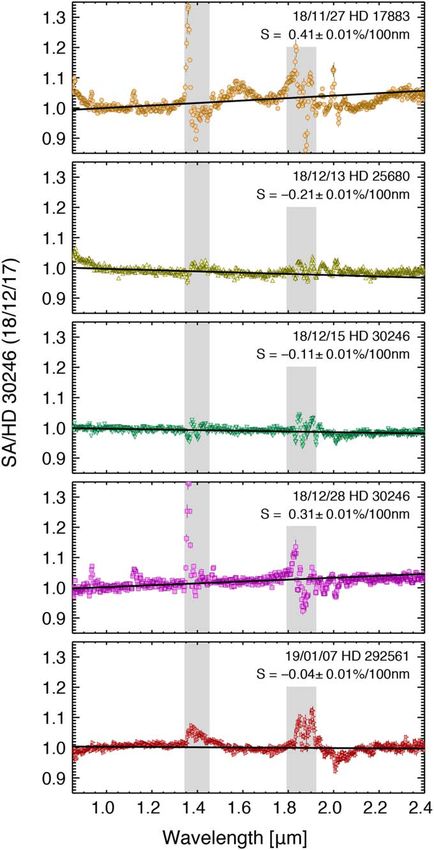
The Planetary Science Journal, 2:176 (14pp), 2021 October Protopapa et al.
December 16, 0.078 au from Earth and 1.1 au from the Sun, closest approach to Earth (see Section 3.6). Nevertheless, as
hereafter Wirtanen). Similar to H2, comet Wirtanen (1) has a noted by A’Hearn et al. (1981), even a nondetection of solid
subkilometer radius (0.56 ± 0.04 km; Boehnhardt et al. 2002; state water in spectroscopic measurements does not rule out the
Lamy et al. 2004), (2) belongs to the Jupiter-family comet presence of ice. Instead, when combined with ice sublimation
dynamical class, and (3) is hyperactive (Lamy et al. 1998; models, it enables us to set constraints on the physical
Groussin & Lamy 2003; Lis et al. 2019). Because Wirtanen properties of the water ice.
strikingly resembles comet H2 in dynamical class, size, and Here, we present NASA Infrared Telescope Facility (IRTF)
activity level, it represents the best target to test the hypothesis SpeX observations of the hyperactive comet Wirtanen during
of hyperactivity framed by the DIXI observations and therefore its closest approach to Earth (Section 2) acquired with the
to look for evidence of water ice in its coma. objective of addressing the following question: can the present
Low-resolution reflectance spectroscopy (0.8–5.3 μm) is model for hyperactivity based on comet H2 be generalized to
ideally suited for detecting water-ice grain halos in cometary other hyperactive comets? A series of near-infrared spectro-
comae through the identification of the broad water-ice scopic observations of comet Wirtanen were collected to
absorption bands at 1.5, 2.0, 3.0, and 4.5 μm (e.g., Fink & monitor and assess the composition of ejected grains as
Sill 1982; Warren 1984; Mastrapa et al. 2008, 2009). The insolation varies on the nucleus, due to changes in heliocentric
relative strength and shape of these features give us information distance, and as the comet undergoes vigorous coma activity.
on the abundance, grain size, and purity (i.e., fraction of The spectral results and the sensitivity to detect water ice are
refractory materials) of the water ice. Direct detection of ice discussed in Section 3.1, while the contribution of the nucleus
grains in cometary comae via near-infrared spectroscopy has to the observed flux density is presented in Section 3.2. The
been reported not only by means of in situ observations spectral modeling used to interpret the data and the constraints
(Sunshine et al. 2007; A’Hearn et al. 2011; Protopapa et al. derived on the dust properties are outlined in Sections 3.3 and
2014) but also through ground-based facilities (Davies et al. 3.4, respectively. Sections 3.5 and 3.6 provide constraints on
1997; Kawakita et al. 2004; Yang et al. 2009, 2014; Yang & the relative abundance and physical properties (i.e., purity and
Sarid 2010; Protopapa et al. 2018). grain size) of the water-ice grains in the coma based on
Once in the coma, the observability of water-ice grains is spectroscopic and sublimation lifetime models, respectively.
controlled by the ice grain sublimation lifetime, which strongly Specifically, we test for the presence of water-ice grains with
depends on the presence of refractory material (i.e., “impu- physical properties identical to those detected in the coma of
rities”) within the grain, grain size, and heliocentric distance H2 and US10, a confirmed and hypothetical hyperactive comet,
(Rh). Theoretical considerations by Hanner (1981) established respectively. The lack of variation in the color of the dust
across our observational data set is discussed in Section 3.7. A
that dirty ice grains have very short lifetimes at 1 au from the
summary and discussion follow in Section 4.
Sun, on the order of a few hundred seconds, depending on their
size. Pure ice grains generally have longer lifetimes, varying
from hours to hundreds of years for grains of radius of 1 and 2. Observations
50 μm, respectively. This analysis led to the general under-
Observations of Wirtanen were obtained using the IRTF/
standing that, unless water-ice grains are pure, their detection is SpeX (Rayner et al. 1998, 2003) high-throughput low-
difficult at small heliocentric distances. An example is given by resolution prism mode covering the wavelength range
comet C/2013 US10 Catalina (hereafter US10): ground-based 0.7–2.52 μm (Figure 1, Table 1), under program IDs
near-infrared spectroscopic measurements revealed clear evi- 2018B006, 2018B088, and 2018B132. All observations were
dence of water-ice grains in the coma when the comet was at acquired with the 0 8 × 15″ or 0 8 × 60″ slit configurations,
large heliocentric distances (Rh 3.9 au), while a featureless resulting in a spectral resolving power (R = λ/Δλ) of ∼112 at
spectrum was recorded at Rh 2.5 au (Protopapa et al. 2018). 2.0 μm. We reduced the data using IDL codes, based on
The changing ice fraction in the coma has been interpreted by Spextool (Cushing et al. 2004). The latter does not reduce
Protopapa et al. (2018) in terms of the limited lifetime of the observations taken with the 60″-long slit, which was used
water-ice grains with respect to the field of view when closer to extensively in our observing campaign to optimize the
the Sun. Under the assumption that the ice was continuously background subtraction in the standard infrared method of
ejected from the nucleus, the nondetection of water-ice moving the object between two positions A and B on the slit.
absorption bands close to perihelion enabled the authors to Given the high activity of the comet and extended coma, the
further constrain the physical properties of the grains and rule 60″-long slit prevented the overlapping of the cometary coma
out the case of pure icy grains. Micrometer-sized grains of in the A and B pair images. Spectra were extracted and then
water ice mixed with a small fraction of low-albedo dust, 0.5% wavelength-calibrated and combined using a robust mean with
by volume, were found to be consistent with all US10 a 2.5σ-clipping threshold. The uncertainty is given by the
spectroscopic measurements. Additionally, based on the standard deviation on the good pixels. Calibrated spectra were
presence of a CO2 coma, the authors put forth the idea of binned by 3 pixels to yield a spectral resolution (λ/Δλ, where
US10 being a possible hyperactive comet, although the nucleus Δλ represents the spectral sampling) of ∼300 at 2.0 μm
size is still unknown. (Figure 1). The spectral extraction aperture was set to the limit
The close approach of comet Wirtanen to Earth enabled beyond which the objectʼs signal does not improve and only
exceptional spatial scale observations (1″ 60 km), which are the noise increases. This means that the choice of aperture size
critical for detecting water ice at 1 au from the Sun, given the is a compromise between statistical noise and photometric
limited water-ice lifetime at such heliocentric distances. accuracy. The spectral extraction radius varied between 1″ on
Specifically, 1 μm pure water-ice grains similar to those 2018 November 27 and 7″ close to perihelion.
observed by Deep Impact at comet H2 should be detectable To remove telluric absorptions, instrumental effects, and the
from the ground in the coma of Wirtanen during the comet’s solar spectrum, all Wirtanen observations were interspersed
2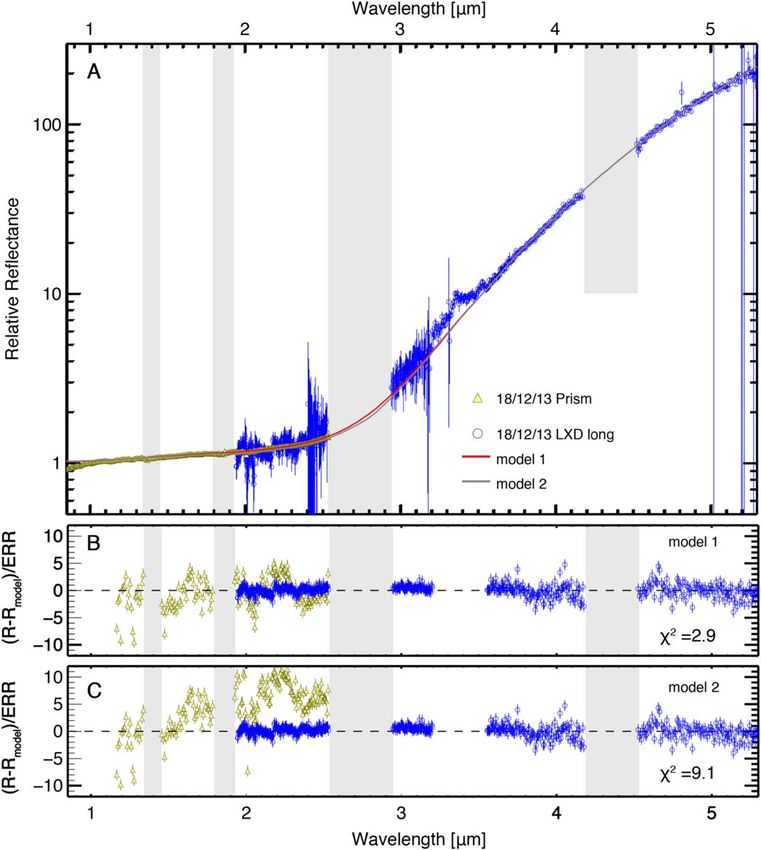
The Planetary Science Journal, 2:176 (14pp), 2021 October                                                                                             Protopapa et al.

Figure 1. IRTF SpeX prism-mode observations of Wirtanen acquired at |Rh| between 1.05 and 1.11 au, binned to a spectral resolution of ∼300 at 2.0 μm. Right panel:
spectra are normalized between 0.98 and 1.02 μm to unity. Overplotted is the best-fit model (solid line) of the C/2013 US10 observations acquired at |Rh| 3.9 au
consistent with the presence of water-ice grains of uniform size, with a diameter of 1.2 μm, and a coma ice-to-dust ratio of 0.18 (Protopapa et al. 2018). Left panel:
spectra are normalized to unity between 0.98 and 1.02 μm and shifted along the y-axis by values shown in parentheses. The gray shaded rectangles are regions of
strong telluric absorption. The spectra show no water-ice absorption features. The data used to create this figure are available.
(The data used to create this figure are available.)

between observations of solar-type stars. The comet-to-solar-                         through a linear fit of the comet spectrum, normalized to unity
type-star ratio produced a spectrum proportional to the comet                         at 1 μm, in the wavelength ranges 0.95–1.05 μm, 1.165–1.32
reflectance. We notice that the correction of telluric features in                     μm, 1.45–1.75 μm, and 2.1–2.2 μm to avoid spectral regions
our comet spectra (Figure 1) is sometimes imperfect not only                          contaminated by strong telluric absorptions. The calibration
near 1.4 and 1.9 μm, where telluric H2O vapor absorption                              star HD 17883 observed on 2018 November 27 is the only one
occurs, but also near 2.0 μm, where strong and narrow telluric                        that does not display a linear featureless spectrum after
CO2 absorptions lie (marked in the figure), which make sky                             normalization to HD 30246, but instead presents broad spectral
transparency variable in time. It was not possible to always                          features at 1.6 and 2.1 μm, as an example. However, because
observe the same star, and stars with spectral type G2, G5, and                       the corresponding comet spectrum does not display those
F8 were adopted for calibration purposes (Table 1). To                                features (Figure 1) and a different slit configuration was
investigate the spectral variations introduced by the different                       adopted when observing HD 17883 and HD 30246 on 2018
calibration stars, we have compared the ratios of each solar-                         November 27 and 2018 December 17, respectively (Table 1),
type star to a common reference, HD 30246 (G5; White et al.                           we attribute these features to instrumental effects. We conclude
2007), observed on 2018 December 17 (Figure 2). The ratio is                          that all calibration stars in our analysis are good solar-type stars
performed after air-mass-correcting each solar-type spectrum                          and the deviation of their spectral behavior from that of the Sun
using telluric absorption models from the Planetary Spectrum                          is accounted for in the comet spectral gradient uncertainty.
Generator (Villanueva et al. 2018). The spectral gradient of                             The 2018 November 27 data are the only prism-mode
each solar-type star with respect to HD 30246 is reported in                          spectra in our observing campaign acquired with the 15″ slit
Figure 2 and estimated through a linear fit of the ratio spectrum,                     length, and they are the only data for which the subtraction
normalized to unity at 1 μm, in the wavelength ranges                                 between frames taken in the A and B slit positions resulted in a
0.95–1.05 μm, 1.165–1.32 μm, 1.45–1.75 μm, and                                        positive and negative image of the coma overlapping each
2.1–2.2 μm to avoid spectral regions contaminated by strong                           other. This overlap prevents an accurate sky background
telluric absorptions. Most calibration stars present a similar                        subtraction in the data reduction, which might affect the
spectral behavior to that of HD 30246, apart from a slight                            spectral slope. Therefore, while the resulting spectrum is
spectral slope on the order of ∼0.2%/100 nm (at 1 μm). The                            reliable to search for the presence of water-ice features, we do
standard deviation among these spectral gradients equals                              not report its spectral gradient in Table 1.
0.3%/100 nm and is adopted as the uncertainty on the comet                               The comparison between each comet spectrum (Figure 1)
spectral slopes reported in Table 1. The latter are also estimated                    and that of the corresponding solar-type reference star

                                                                                  3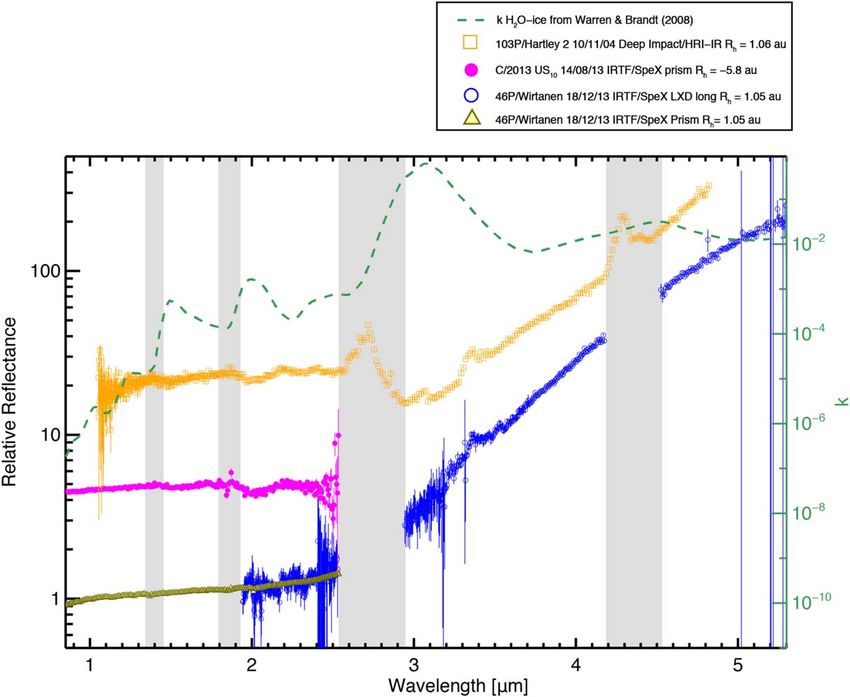
The Planetary Science Journal, 2:176 (14pp), 2021 October                                                                                   Protopapa et al.

                                                                           Table 1
                                                          Observational Parameters for 46P/Wirtanen

UT Date                        Mode        Slita       AMtargetb     SA (Spectral Type)c       AMSAd          Rh e       Δf    T-magg       Sh        STOi
(YYYY MM DD HR:MN)                       (arcsec)                                                             (au)      (au)            %/(100 nm)    (deg)
2018   11   27 06:55          Prism      0.8 × 15    1.51 ± 0.03     HD 17883 (G2V C)        1.64 ± 0.01    −1.076     0.14     12.3       L           46.5
2018   12   13 06:55          Prism      0.8 × 60    1.10 ± 0.03     HD 25680 (G5V C)        1.04 ± 0.01    +1.055     0.08     11.1       1.9         26.4
2018   12   13 08:36          LXD_l      0.8 × 15    1.01 ± 0.01     HD 21379 (A0V C)        1.03 ± 0.01    +1.055     0.08     11.1                   26.3
2018   12   15 07:08          Prism      0.8 × 60    1.07 ± 0.03     HD 30246 (G5 D)         1.11 ± 0.01    +1.056     0.08     11.1       2.3         22.2
2018   12   17 06:20          Prism      0.8 × 60    1.21 ± 0.01     HD 30246 (G5 D)         1.16 ± 0.01    +1.057     0.08     11.1       2.1         19.2
2018   12   28 07:03          Prism      0.8 × 60    1.55 ± 0.02     HD 30246 (G5 D)         1.51 ± 0.01    +1.076     0.10     11.8       1.9         27.7
2019   01   7 12:51           Prism      0.8 × 60    1.36 ± 0.01     HD 292561 (F8 E)        1.31 ± 0.01    +1.110     0.16     12.7       2.5         33.2

Notes.
a
  Slit width × slit length.
b
  Average air mass of the comet observations.
c
  Star used for calibration purposes, its spectral type and precision from SIMBAD.
d
  Average air mass of the solar-type star observations.
e
  The Sun-to-target distance (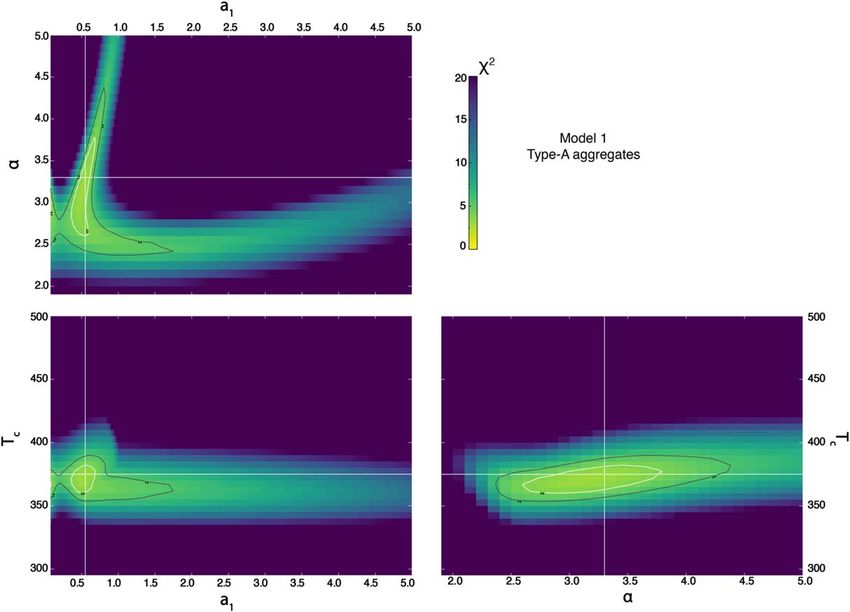
The Planetary Science Journal, 2:176 (14pp), 2021 October                                                                                Protopapa et al.

                                                                                      (Figures 3 and 4). The LXD_long spectrum, normalized to
                                                                                      match the prism measurements between 2.1 and 2.3 μm, is in
                                                                                      near agreement with the short-wavelength data between 2.0
                                                                                      and 2.4 μm.

                                                                                                3.2. Estimate of the Nucleus Contribution
                                                                                         We investigated the possibility that the nucleus significantly
                                                                                      contributes to the observed flux density due to the close
                                                                                      approach to Earth. We modeled the reflected light and thermal
                                                                                      emission from the nucleus with the H, G model and the Near-
                                                                                      Earth Asteroid Thermal Model (NEATM), respectively
                                                                                      (Bowell et al. 1989; Harris 1998). The H, G model parameters
                                                                                      and assumed values are effective radius, 555 m, geometric
                                                                                      albedo, 4% at 0.55 μm (used to compute the absolute
                                                                                      magnitude H), and phase function parameter G (0.15 assumed;
                                                                                      see Bowell et al. 1989). In addition, we redden the nucleus with
                                                                                      the same spectral gradient as measured from the near-infrared
                                                                                      coma. The NEATM parameters include all of the H, G
                                                                                      parameters, mean infrared emissivity, 0.95, and infrared
                                                                                      beaming parameter, 1.03. The emissivity and beaming para-
                                                                                      meter values are based on the results for cometary nuclei by
                                                                                      Fernández et al. (2013). With these parameters, we compute a
                                                                                      model spectrum of the nucleus and compare it to the SpeX
                                                                                      LXD data. We find that the nucleus could account for 15%,
                                                                                      35%, 61%, and 68% of the spectral flux at 2, 3, 4, and 5 μm,
                                                                                      respectively. The thermal emission from the comet appears to
                                                                                      be dominated by the nucleus. In contrast, the scattered
                                                                                      component is dominated by the coma.
                                                                                         In principle, one could subtract the model nucleus spectrum
                                                                                      from the LXD spectrum and analyze the residuals as a spectrum
                                                                                      of the coma. However, we made several assumptions in order
                                                                                      to arrive at our nucleus estimate, and there is enough
                                                                                      uncertainty in the parameters that deriving a useful thermal
                                                                                      emission spectrum of the nucleus is not possible. The most
                                                                                      uncertain parameter is the size of the nucleus, derived under the
                                                                                      most unlikely assumption of a spherical nucleus. Lamy et al.
                                                                                      (1998) and Boehnhardt et al. (2002) found peak-to-peak
                                                                                      amplitudes of 0.2 and 0.4 mag, respectively. Given that the
                                                                                      shape and rotational state of the nucleus are unknown at the
                                                                                      time of our observations, we immediately have an uncertainty
                                                                                      of ±20% on our nucleus estimate at all wavelengths.
                                                                                      Furthermore, the shape of the LXD spectrum relative to the
                                                                                      nominal nucleus spectrum is unexpected. Cometary dust comae
Figure 2. Spectral variations among the solar-type reference stars observed
during the Wirtanen campaign. The ratio between each solar-type star (SA) and         should have cooler spectral temperatures than cometary nuclei,
a reference one, arbitrarily chosen, HD 30246 (G5 D) observed on 2018                 due to the fact that small grains can reradiate absorbed sunlight
December 17, is displayed, normalized to unity between 0.98 and 1.02 μm.              isotropically, but nuclei tend to reradiate that energy from the
Overlaid on each ratio spectrum is the linear model (solid black line). The           Sun-lit hemisphere only. In contrast to the expectations, our
spectral slope resulting from the linear fit, expressed in %/100 nm, is reported
in each panel.                                                                        nucleus model suggests an increasing nucleus fraction in the
                                                                                      LXD spectrum from 3 to 5 μm, which indicates that the nucleus
                                                                                      has a cooler spectrum. The spectral temperature of the NEATM
   With spectral sensitivity ruled out, the nondetection of water-                    is controlled by the beaming parameter. We based our assumed
ice absorption bands has to be attributed either to the lack of                       value on the results of the photometric survey by Fernández
any solid ice in the coma or to the presence of water-ice grains                      et al. (2013), who find a population-averaged beaming
with physical properties (grain size and purity) that limit their                     parameter of 1.03 ± 0.11 based on 16 and 22 μm photometry.
lifetime with respect to the field of view at the time of the                          By decreasing the beaming parameter, we could produce a
observations. The first case is explored in Section 3.4, while the                     warmer spectral temperature that would lead to a higher
second is addressed in Sections 3.5 and 3.6.                                          nucleus contribution. A 2σ variation of the Fernández et al.
   To investigate the properties of both refractories and ice in                      (2013) beaming parameter results in a spectrum that accounts
the coma of Wirtanen, we combined the LXD_long and prism                              for up to 110% of the LXD spectrum at >3.5 μm. However, the
data collected on the same date, only a few hours apart,                              contribution at 2 μm, which is dominated by reflected light, is
yielding a nearly complete spectrum from 0.8 to 5.3 μm                                still 15%.

                                                                                  5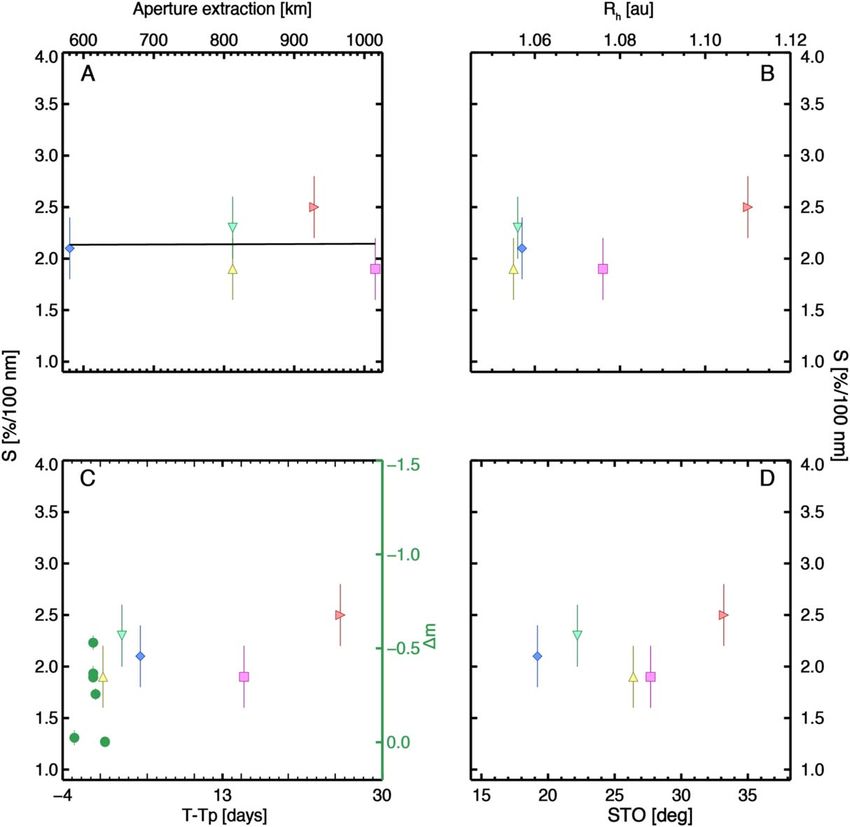
The Planetary Science Journal, 2:176 (14pp), 2021 October                                                                                             Protopapa et al.

Figure 3. Comet Wirtanen reflectance spectra acquired a few hours after perihelion over the wavelength range 0.8–5.3 μm. The LXD_long spectrum (blue open
circles) has been normalized between 2.1 and 2.3 μm to match the prism observations (yellow filled triangles). The spectrum is featureless but for molecular/organic
emission at ∼3.3 μm and residual telluric features. The imaginary part of the refractive index k of crystalline water ice by Warren & Brandt (2008; a peak in k
corresponds to an absorption band) is shown for comparison (green dashed line). No water-ice absorption features are observed in the spectrum of comet Wirtanen
throughout the full wavelength range. The Deep Impact/HRI-IR spectrum of 103P/Hartley 2 (Protopapa et al. 2014) and the IRTF/SpeX spectrum of C/2013 US10
(Protopapa et al. 2018), which clearly exhibit the characteristic water-ice spectral features, are also shown for comparison. The spectra of 103P/Hartley 2 and C/2013
US10 have been normalized between 2.15 and 2.25 μm to match the prism observations of 46P/Wirtanen and shifted along the y-axis for clarity.
(The data used to create this figure are available.)

   Given the likely high contribution of the nucleus, we cannot                         The thermal component of the reflectance spectrum is
separately analyze the thermal emission of the dust. We instead                       approximated by
elect to characterize the thermal emission with an empirical
model, e.g., the Planck function, which allows us to avoid a                                                            p Rh2 B (Tc, l) f
physical interpretation of the thermal emission but still is a                                             Rthermal =                     ,                       (1 )
                                                                                                                              F☉
good description of the data (as we show below). For the
scattered light, we account for the nucleus by assuming that it                       where B(Tc, λ) is the Planck function, which depends on the
contributes 15% of the flux, i.e., the remaining 85% is                                color temperature Tc; F☉ is the solar flux at 1 au; Rh is the
the coma.                                                                             comet heliocentric distance in au; and f is the filling factor of
                                                                                      the grains. The last is obtained by normalizing the thermal
                                                                                      component of the modeling to the data at 3.9–4.1 μm after
                              3.3. Modeling
                                                                                      subtracting the scattered component.
   The reflectance spectrum of the coma in the wavelength                                 The scattered component of the spectrum is modeled as an
range covered by the prism and LXD_long data combined is                              areal mixture of two components, one of polydisperse porous
modeled as the sum of the scattered and thermal components of                         dust particles, or equivalently dust aggregates, and one of
the coma. In this section we describe the general philosophy of                       polydisperse water-ice aggregates, which we refer to as type-A
the modeling approach.                                                                and type-B aggregates, respectively.

                                                                                  6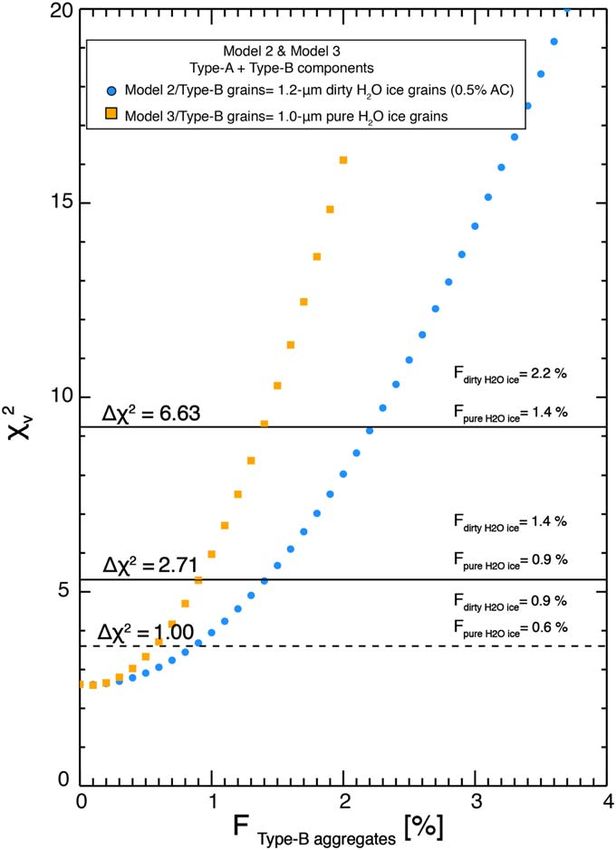
The Planetary Science Journal, 2:176 (14pp), 2021 October Protopapa et al.
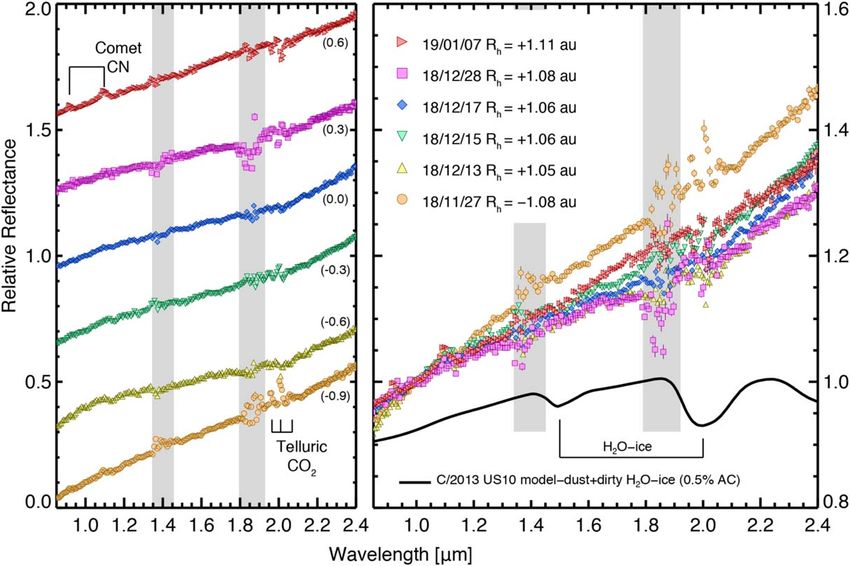
Figure 4. (A) Comet Wirtanen reflectance spectra over the wavelength range 0.8–5.3 μm, identical to those shown in Figure 3. The ice-free (model 1) and ice-rich
(model 2) models, with an upper limit of 2.2% for the water-ice abundance, are shown in red and gray solid lines, respectively. Both models do not fit the emission
feature as expected. (B, C) Residuals of each fit, with the resulting cn2 indicated in each case.
We consider the type-A and type-B components separated where wj is the single scattering albedo of the jth type of
from one another, such that aggregates. This is
a
Rscattered = å Fj r j (l) = FA rA + (1 - FA) r B, òa1 a2 QS (a , m (l)) n (a) da
2
(2 )
j wj (l) = a , (4 )
òa1 a2 Q E (a , m (l)) n (a) da
2
where Fj is the fraction of the area occupied by the jth
component with ∑jFj = 1, and the subscripts A and B denote where a1 and a2 are the smallest and largest particle radii in the
the type-A and type-B aggregates, respectively. size distribution, respectively. QS(a, m) and QE(a, m) are the
The reflectance of the jth type of aggregates is approximated scattering and extinction efficiencies of the aggregates as a
by diffusive reflectance and is given by function of radius a and complex refractive index m,
respectively. These are computed by means of Mie scattering
1- (1 - wj (l)) theory, so that we can model grains with any size parameter
r j (l ) = , (3 ) (X = 2πa/λ), even those outside the geometric optics regime
1+ (1 - wj (l))
(X < 1). The real and imaginary parts of the refractive index as
a function of λ are estimated from effective medium theory
(Bruggeman mixing formula; Bohren & Huffman 1983). We
adopt a fractal model for the internal structure (i.e., porosity) of
the grains. Thus, the fractional volume filled by material in a
7The Planetary Science Journal, 2:176 (14pp), 2021 October Protopapa et al.
porous grain is given by minimization. The degree of freedom, ν, equals the number of
spectral elements N minus the number of fitted parameters.
d = (a a 0 ) D - 3 , (5 ) To ensure that the solution obtained from the best-fit
minimization algorithm is that of a global minimum rather
where a0 is the radius of the basic structural unit of the grain, than a local minimum, and to investigate the possible
which we set equal to 0.1 μm (e.g., Harker et al. 2002), and D intercorrelation between the free parameters, we explore a
is the fractal porosity, which ranges between 2.5 and 3 (Lisse wide parameter space (α,a1), (α,Tc), and (a1,Tc), with α
et al. 1998). Solid spheres are represented by D = 3, while for ranging between 2 and 5 with a step of 0.1, Tc between 300 and
porous spheres D < 3 (Harker et al. 2002). The differential 500 K with a step of 5 K, and a1 between 0.1 and 5 μm with a
particle size distribution n(a)da is the number of particles per step of 0.025 μm. We determine the reduced cn2 distributions
unit volume with radius between a and a + da, following the and the degree of confidence in the best-fit values. The joint
formula error distribution of (α,a1), (α,Tc), and (a1,Tc) is shown in
Figure 5. For each point in the grid, which defines the values of
n ( a ) µ a -a . (6 ) the two parameters under consideration, we solve for the third
parameter. The 2D contours of constant cn2 corresponding to
the 68% and 90% confidence levels are displayed in white and
3.4. Ice-free Model: Properties of the Dust Coma gray, respectively. Best-fit parameter values and the correspon-
Given the absence of any ice feature, we first model the dent 1σ errors are listed in Table 2. There is evidence for a
spectrum by a power-law size distribution of porous dust slight correlation between the exponent of the particle size
aggregates only (type-A aggregates). This implies that FA is set distribution, α, and the minimum size of the particle
equal to 1 in Equation (2). distribution, a1, but both parameters are well constrained. To
There is a broad literature investigating the dust mineralogy exclude the locations where emission bands occur and regions
of cometary comae, based on several techniques, including but of strong telluric absorption, the best-fit optimization is
not limited to laboratory studies of interplanetary dust particles performed in the wavelength ranges 1.16–1.34 μm,
(IDPs; Wooden et al. 2000), micrometeorites (Bradley et al. 1.45–1.79 μm, 1.92–2.53 μm, 2.94–3.20 μm, 3.55–4.18 μm,
1999), and STARDUST grains (Brownlee et al. 2006); analysis and 4.52–5.34 μm. The best-fit result (Figure 4, red solid line;
of ground and space-based mid-IR observations (Harker et al. model 1 in Table 2) has a differential dust size distribution
2002; Woodward et al. 2021); and in situ analysis of coma power-law index of 3.3, minimum size a1 equal to 0.55 μm,
grains with spacecraft instrumentation (e.g., Fomenkova et al. and a color temperature of 375 K. The derived color
1992; Fulle et al. 2016a). Given the featureless behavior of the temperature is in excess with respect to the equilibrium
Wirtanen spectrum, the chemistry of the refractory component temperature Teq = 278Rh-0.5 = 271 K . This could be attributed
cannot be unambiguously identified. However, it is possible to to the presence of micron- and submicron-sized grains
derive information on the size distribution of the dust, once its comprising absorbing material. However, we report in
chemical nature is assumed. We follow the same approach Section 3.2 that the thermal emission has a substantial
adopted by Bockelée-Morvan et al. (2017a, 2017b) and contribution from the nucleus, which is challenging to remove.
consider amorphous carbon and amorphous olivine as coma Therefore, we do not interpret this result any further.
refractories, with a silicate-to-carbon ratio of 0.3, based on the
results by Fulle et al. (2016a) at 67P/Churyumov–Gerasi- 3.5. An Upper Limit for Water Ice
menko (hereafter 67P). We adopt the optical constants by Edoh
(1983) and Dorschner et al. (1995) for amorphous carbon and Our data do not display spectral evidence of water ice in the
amorphous olivine (Mg = Fe = 0.5), respectively. coma. Nevertheless, this does not necessarily rule out the
The free parameters in the model are the exponent, α, and presence of water ice in the coma of Wirtanen. We investigate
the minimum radius, a1, of the particle size distribution, as well this possibility and assess an upper limit for water-ice
as the color temperature Tc. Because large particles do not abundance by modeling the composite spectrum prism
contribute significantly to infrared radiation (e.g., Harker et al. +LXD_long acquired on 2018 December 13 (Figure 4) with
2002), the grain size distribution is truncated at 100 μm in two components (see Section 3.3), one of polydisperse porous
diameter. This step reduces computation time. The fractal dust aggregates (type-A aggregates) and one of polydisperse
porosity D is set to 2.5 (Bockelée-Morvan et al. 2017a, 2017b). water-ice particles (type-B aggregates). We hold fixed the
We acknowledge that this parameter was initially set free, and physical properties of the dust aggregates using the best-fit
we found it to be unconstrained by our data. We use a values from the ice-free model (model 1, Section 3.4). This
Levenberg–Marquardt χ2 minimization algorithm to find the limits the number of free parameters. Additionally, given the
best-fit solutions (Markwardt 2009). The model quality is lack of water-ice absorption features and therefore the
quantified by means of the reduced cn2 , defined as impossibility to solve for both the physical properties of the
ice grains and their abundance, we assume that water-ice
1 N ⎛ Ri - Ri,model (a , a1, Tc) ⎞
2 particles with the same properties as those found in comet C/
c 2n = å ⎜
n i=0 ⎝ ERR i
⎟ , (7 ) 2013 US10 (model 2) and 103P/Hartley 2 (model 3) were
⎠ ejected by comet Wirtanen. Therefore, either 1.2 μm in
diameter ice grains containing 0.5% amorphous carbon by
where Ri, ERRi, and Ri,model represent the measured relative volume (model 2; Protopapa et al. 2018) or 1.0 μm in diameter
reflectance, the error on the relative reflectance, and the pure ice grains (model 3; Protopapa et al. 2014) are assumed to
modeled relative reflectance, respectively, in correspondence be present in the coma of Wirtanen. We consider the type-A
with the individual wavelength, identified by the subscript i. and type-B components separated from one another (see
The sum is over all N wavelength points selected for the best-fit Equation (2)). The free parameter in the model is the fraction of
8The Planetary Science Journal, 2:176 (14pp), 2021 October Protopapa et al.
Figure 5. 2D cn2 distributions resulting from the parameter exploration of the fit to the prism+LXD_long spectrum in the case of an ice-free model (model 1,
Figure 4). Tc, a1, and α are the color temperature, the minimum radius in the particle size distribution, and the differential dust size distribution power-law index,
respectively. In each panel, for each point in the grid, we search for the value of the third parameter that minimizes cn2 , and the minimum cn2 is displayed. The solid
curves shown in white and gray with Dcn2 = 1.00 and 2.71 represent the 68% and 90% confidence levels, respectively. Horizontal and vertical lines indicate the best-
fit parameter values. The best fit to the data is found for Tc = 37510
10 K, a1 = 0.550.15 μm, and α = 3.30.6 . The uncertainties on the best-fit parameter values correspond
0.15 0.5
to 1σ errors.
type-B grains in %. We varied the fraction of type-B grains those observed in the coma of US10 and H2 would lead to even
(FB, or equivalently 1 − FA) between 0 and 1 with a step lower upper limits of the water-ice areal fraction. The upper
interval of 0.1%. For each value of FB we computed cn2 as limit for the fractional area of US10-like and H2-like water-ice
discussed in Section 3.4. In Figure 6 we present a plot of cn2 grains of 2.2% and 1.4% translates into an ice-to-dust areal
versus FB. The two curves corresponding to model 2 (blue ratio of 3% and 2%, respectively. These values are estimated
circles) and model 3 (orange squares) have a minimum for accounting for the 15% nucleus contribution to the scattered
component of the spectrum (Section 3.2). We conclude that the
FB = 0.1%, which is almost identical to model 1 (red line in
coma of Wirtanen is dominated by dust. If water-ice grains
Figure 4). However, in the case of US10-like water-ice grains
were ejected by comet Wirtanen, their abundance would be
(model 2), the data are consistent with an upper limit of water-
negligible.
ice abundance on the order of 1.4% and 2.2% at the 90% and
99% confidence levels, respectively (for one free parameter,
Δχ2 = 2.71 and 6.63 correspond to a confidence level of 90% 3.6. Water-ice Grain Sublimation Lifetime
and 99%, respectively; Avni 1976). In the case of pure water-
In order for water-ice grains to be a candidate for
ice grains (H2-like water-ice grains; orange squares in hyperactivity, they must be ejected in high enough abundance
Figure 6), an upper limit of 0.9% and 1.4% at the 90% and and sublimate quickly enough to account for the observed total
99% confidence levels, respectively, is estimated. Model 2, water production rates. We did not detect any water-ice features
with an upper limit of 2.2% for the water-ice abundance, is in our spectra; therefore, we additionally require the grains to
shown in Figure 4 (gray line). Model 3 with a 1.4% water-ice fully sublimate before they travel ∼1″ from the nucleus, this
fraction is almost identical to model 2, and therefore it is not distance based on our spectral aperture sizes.
shown in Figure 4. The upper limit of water-ice abundance is Pure ice grains have the longest sublimation lifetimes, and
systematically lower in model 3 with respect to model 2. This is dust impurities tend to reduce that lifetime. Protopapa et al.
because pure water ice displays stronger water-ice absorption (2018) modeled grain lifetimes following Hanner (1981), Lien
bands with respect to ice grains with refractory inclusions. We (1990), and Beer et al. (2006), and we adopt this model for the
point out that the band depth of water-ice absorption features analysis of comet Wirtanen. It computes grain temperatures
increases with increasing path length or equivalently particle based on the absorption of sunlight, grain thermal emission,
diameter. Therefore, assuming water-ice particles larger than and cooling from sublimation. Radiative transfer calculations
9The Planetary Science Journal, 2:176 (14pp), 2021 October Protopapa et al.
Table 2
Properties of the Refractory (Type-A) and Ice Aggregates (Type-B) in the Coma of 46P/Wirtanen as Derived from Spectroscopic Modeling
Type-A Aggregates (Refractory) Type-B Aggregates (Icy) Tc cn2
Model F (%)a |α|b Dc a1 ( μm)d a2 ( μm)e F (%) |α| D a (μm)
Model 1 100f 3.30.5
0.6 2.5f 0.550.15
0.15 50f 0f L L L 37510
10 2.9
Model 2 >97.8 3.3f 2.5f 0.55f 50f < 2.2 0f 3f 0.6f 375f 9.1
Model 3 >98.6 3.3f 2.5f 0.55f 50f < 1.4 0f 3f 0.5f 375f 9.3
Notes. Model 1 corresponds to an ice-free model and accounts for aggregates of amorphous carbon and amorphous olivine into vacuum (type-A aggregates). Model 2
is an areal mixture of type-A aggregates and US10-like water-ice grains (1.2 μm diameter monodisperse water-ice grains with a small, 0.5%, dirt fraction by volume).
Model 3 is an areal mixture of type-A aggregates and H2-like water-ice grains (1.0 μm diameter monodisperse pure water-ice grains).
a
Fraction of the area occupied by the aggregates.
b
Differential size distribution power-law index.
c
Fractal porosity.
d
Minimum particle radius in the size distribution.
e
Maximum particle radius in the size distribution.
f
This parameter has been set as constant.
Figure 7. Water-ice grain lifetimes at 1.055 au for pure water ice, and mixtures
of water ice with 0.2%, 0.5%, and 1.0% amorphous carbon dust by volume.
The right axes indicate the distance in arcseconds at Δ = 0.08 au traveled
before sublimating for two coma expansion speeds: 50 and 100 m s−1, based
on grain speeds estimated by Fulle (2000). Model lines that fall in the shaded
regions are more likely to produce a dust-dominated spectrum, as we observed
at 46P.
radii are integrated down to 10 nm, at which point they are
considered destroyed. We present calculations for mixtures of
water ice (optical constants by Warren & Brandt 2008) and
amorphous carbon (Edoh 1983), using effective medium theory
(Bruggeman mixing rule; Bohren & Huffman 1983). Calcula-
tions for water-ice grain lifetimes at 1.055 au with 0%, 0.2%,
0.5%, and 1% amorphous carbon by volume as a function of
Figure 6. Upper limits for the abundance in the coma of Wirtanen of 1.2 μm
diameter water-ice grains with 0.5% amorphous carbon by volume (spectral grain diameter are presented in Figure 7, with an initial grain
model 2, blue circles) and 1.0 μm diameter pure water-ice grains (spectral diameter of 20 μm.
model 3, orange squares). The upper limit for the water-ice fraction F is given Based on our calculated water-ice grain lifetimes, micro-
at the 68%, 90%, and 99% confidence levels for both models. Models 2 and 3 meter-sized pure water-ice grains have a lifetime of 1–3 hr at
differ exclusively for the physical properties (purity and particle size) of the ice
grains (type-B grains), as the properties of the refractory aggregates (type-A
1.055 au, and dirty ice grains have lifetimes that are shorter by
particles) are the same in both simulations (see text for details). an order of magnitude or more. Beyond 3 μm in size, the
difference is even more dramatic. Pure ice grain lifetimes
are based on Mie theory (code of Bohren & Huffman 1983, increase to 104 hr for 10 μm diameter grains, whereas dirty ice
modified by B. Draine).7 Mass loss by sublimation decreases grain lifetimes are still less than 1 hr, even for the low carbon
the grain radius, as does sputtering from the solar wind. Grain fraction of 0.2%.
To further distinguish between the type of ice (pure versus.
dirty) that could be present in the inner coma of comet
7
Available at https://www.astro.princeton.edu/~draine/scattering.html. Wirtanen, we need to consider the time it takes for a coma grain
10The Planetary Science Journal, 2:176 (14pp), 2021 October Protopapa et al.
to travel to the edge of the spectral aperture in projection. Faster coma followed by a reddening due to sublimation. However,
coma expansion speeds require rapid sublimation rates in order the outburst ejecta moved rapidly, with speeds >23 m s−1,
to account for the lack of water-ice absorption features in our leaving little to no material near the nucleus at the time our
spectra. Fulle (2000) estimated several dust parameters, spectrum was taken (Kelley et al. 2021). In addition,
including expansion speed, for comet Wirtanen with a anticipating the post-ejection evolution in the ice properties is
dynamical model of dust and an image of the comet near its not straightforward. But no significant trend is observed in the
1997 perihelion. They estimated expansion speeds for 1 μm color gradient after the time of the outburst.
diameter dust to be 65−95 m s−1, and we assume that the dust Finally, no correlation between the coma color and phase
and ice grain expansion speeds are the same. The aperture angle (Sun–target–observer angle, STO in Table 1) over the
crossing times for these speeds are 0.17–0.25 hr for range between 20° and 50° is observed (Figure 8, panel (D)).
Δ = 0.08 au. In Figure 7, we provide alternative y-axes An increase of reddening with phase angle for cometary dust
showing the distance traveled by a grain moving at 50 and has been reported for the first time by Bockelée-Morvan et al.
100 m s−1 in the image plane. (2019) for comet 67P. Specifically, Bockelée-Morvan et al.
Water-ice grains with sublimation lifetimes longer than the (2019) reported a phase reddening in the near-IR of the dust
aperture crossing timescales (i.e., 1 hr) would have been coma in the near nucleus of 67P of 0.031%/100 nm deg−1 in
detected in our spectra if their abundance were higher than a the phase angle range 50°–120°. This phenomenon has been
few percent (Section 3.5). Assuming that higher abundances attributed by Bockelée-Morvan et al. (2019) to the roughness of
are needed to account for the hyperactivity, we rule out pure the dust particles (Beck et al. 2012; Schröder et al. 2014). As
water-ice grains, which have lifetimes 1 hr for observed by Hartmann & Cruikshank (1984), changes in the
diameters 0.1 μm and therefore would survive the time of water-ice-to-dust ratio could produce an apparent phase
flight to the edges of our spectral apertures. In contrast, dirty ice reddening due to the relationship between phase angle and
grains are likely to have sublimated before reaching the edge of heliocentric distance. A comet observed at large heliocentric
our LXD spectral aperture. Given that Fulle (2000) estimated distances and therefore low phase angles would display a coma
expansion speeds from 65 to 95 m s−1 for 1 μm grains, we color that is bluer with respect to the same comet observed
consider dirty ice with carbon fractions 0.5% as candidates closer in at larger phase owing to the sublimation lifetime of the
for explaining the hyperactivity of comet Wirtanen. ice grains. Therefore, to test for the presence of a true phase
reddening and rule out the hypothesis of compositional (ice-to-
dust ratio) changes, the correlation between spectral gradient
3.7. Coma Reddening
and heliocentric distance needs to be tested as well. Bockelée-
The color of the dust coma of comet Wirtanen (S, expressed Morvan et al. (2019) reported no significant heliocentric
in %/100 nm) as inferred from the IRTF SpeX measurements variations in the dust color of 67P, which reinforces the result
(Section 2) in the near-infrared wavelength range lacks of a true phase reddening. No phase reddening is observed in
variation across our observational data set (Table 1). To our data.
investigate its significance, we considered putative correlations
between S and aperture extraction, heliocentric distance, time,
and phase angle (Figure 8). 4. Summary and Discussion
First, we looked at whether the spectral color might be
We report a detailed characterization of the inner coma of
influenced by the spectral aperture in projection d (in km,
comet 46P/Wirtanen through infrared spectroscopic measure-
d ∼ δΔ/206265, where δ is the spectral aperture diameter in
ments acquired with IRTF SpeX during the close approach of
arcsec and Δ is the geocentric distance expressed in km). No
the comet to Earth in 2018 December. Our findings are as
color gradient is observed with aperture extraction (Figure 8,
follows:
panel (A)). The linear fit to the data, shown in panel (A) as a
solid line, has a cn2 = 1.0 and a slope of 10−5% per 100 nm 1. No water-ice absorption features are detected in our data,
per km. which span a range of heliocentric distance from 1.1 au
Color variations in cometary comae can be diagnostic of not inbound, to 1.05 au near perihelion, and back to 1.1 au
only the coma dust properties but also the ice-to-dust ratio (e.g., outbound.
Filacchione et al. 2020). Water ice is stable at large heliocentric 2. The modeling analysis of the observations acquired
distances, but sublimation rates vary inversely with heliocentric immediately after perihelion and covering the wavelength
distance. Our data (Figure 8, panel (B)) do not display any range 0.8–5.3 μm indicates that the coma is composed of
color variation with heliocentric distance. This is not porous refractory aggregates (fractal porosity assumed
unexpected given that the range of heliocentric distances equal to 2.5) spanning 1.1–100 μm in diameter with a
covered by our observations is not wide enough to be sensitive differential dust size distribution power-law index of
to changes in ice-to-dust ratio. −3.3 ± 0.5 and a color temperature of 375 ± 10 K.
Occasional variations in the spectral gradient could also be 3. An upper limit of 1.4% in water-ice abundance is
due to rapid changes in the coma composition and particularly estimated, assuming water-ice grains with physical
in the ice-to-dust ratio as the result of impulsive events, such as properties identical to those observed in the coma of
outbursts, which eject fresh new material into the coma. The the hyperactive comet H2 (1.0 μm in diameter pure
coma color is constant as a function of time from perihelion water-ice grains; Protopapa et al. 2014). A water-ice
(Figure 8, panel (C)). An outburst was identified by Kelley fraction up to 2.2% is consistent with Wirtanen data in the
et al. (2021) during the time period covered by our data with an case of water-ice grains of 1.2 μm in diameter with 0.5%
apparent strength on the order of −0.5 mag (see green data amorphous carbon by volume, like those observed in the
points in panel (C) of Figure 8). If water ice were ejected coma of US10, a possible but unconfirmed hyperactive
during the outburst, we would expect a sudden blueing of the comet (Protopapa et al. 2018). Lower carbon fractions
11The Planetary Science Journal, 2:176 (14pp), 2021 October Protopapa et al.
Figure 8. Dust coma spectral gradient of comet 46P/Wirtanen expressed in %/100 nm as a function of projected aperture diameter in km (panel (A)), heliocentric
distance Rh (panel (B)), observing time since perihelion (panel (C)), and Sun–target–observer (STO) angle (panel (D)). The comparison between the spectral gradient
behavior as a function of time and the comet Wirtanen light curve (green circles) during an outburst close to perihelion, discussed in detail by Kelley et al. (2021), is
also shown in panel (C).
and/or larger water-ice particle diameters would lower rotational pole pointed at the Sun.8 This is the same model as
this upper limit. employed by Lis et al. (2019). Adopting the mean nucleus
4. No significant variations in spectral slope are observed radius of 555 ± 40 m estimated by Boehnhardt et al. (2002), we
among our spectral data. translated the water production rate of QH2 O = 7.2 ´ 10 27
molecules s−1 reported by Knight et al. (2021) on 2018
Comet Wirtanen was identified as a hyperactive comet by December 16 (Z = 3.19 × 10²¹ molecules s−1 m−2 at
Lamy et al. (1998), Groussin & Lamy (2003), and Lis et al. Rh = 1.056 au), close in time to our spectroscopic measure-
(2019) with an active fraction between 60% and 120% at ments, into an active fraction of 58%. The water production
perihelion during the 1997 and 2002 apparitions. However, rate reported by Knight et al. (2021) and derived from
water production rate can vary from apparition to apparition, as measurements of the OH 309 nm (0–0) band is in agreement
was the case for comet H2 (Combi et al. 2011). Therefore, to with the H162 O production rate of (7.7 ± 1.5) × 10 molecules
27
−1
put our observations into context and test whether hyperactivity s quoted by Lis et al. (2019) and based on observations of the
is associated with the presence of a water-ice grain halo, it is 11,0 − 10,1 transition of H18
2 O between 2018 December 14 and
critical to first estimate the active fraction of comet Wirtanen 20 UT. The water production rate was 10% higher on 2018
during the 2018 apparition. For this purpose, we used the December 3 (8 × 1027 molecules s−1; Knight et al. 2021),
sublimation model by Cowan & A’Hearn (1979) for a which translates into an active fraction of 65%. This active
8
Code available at https://github.com/Small-Bodies-Node/ice-sublimation;
Cowan et al. (2021).
12The Planetary Science Journal, 2:176 (14pp), 2021 October Protopapa et al.
fraction is similar to that of comet H2 during the Deep Impact suggests that the two populations, those in the Deep Impact
observations (∼72%; Lis et al. 2019) and it is at least 2 times images and those in the radar, could be related. Radar
higher than the typical active fraction for most comets (e.g., observations of comet Wirtanen in 2018 also indicate the
A’Hearn et al. 1995). presence of centimeter-sized grains in the coma. The total cross
In this paper, we test the hypothesis put forth by A’Hearn section of grains with radii 2 cm is roughly the same as that
et al. (2011), Protopapa et al. (2014), and Kelley et al. (2013) observed at comet H2, 0.89 km2 (Harmon et al. 2011; E.
that sublimating water ice in the coma in the form of small Howell 2021, private communication).
grains and/or large chunks is responsible for a comet If the centimeter-sized radar observed particles were
hyperactivity. We point out that Knight et al. (2021) and Bonev responsible for the hyperactivity of comet Wirtanen, then the
et al. (2021) both provide indirect evidence for the presence of lack of water-ice spectral signatures in our observations would
an extended source of water vapor in the coma of Wirtanen. suggest that the centimeter-sized grains are either a small areal
However, no information on the properties of the ice that fraction of the coma or not icy on the surface. Putting the
produces the water vapor, such as particle size and ice-to-dust Wirtanen and H2 data together, the one possible scenario that
ratio, has been retrieved based on their work. can explain all observations and account for the hyperactivity
Radiative transfer modeling of the spectroscopic data, of both comets requires large centimeter-to-decimeter-sized
combined with calculations of water-ice grain sublimation particles that behave like mini-cometary nuclei, i.e., the water-
lifetimes, rules out H2-like small water-ice grains (Protopapa releasing materials would reside just under the surface at a
et al. 2014) in the coma of Wirtanen. The long lifetime of 1 μm depth deeper than that sampled by near-IR remote sensing (i.e.,
in diameter pure water-ice particles is inconsistent with an on the order of μm). However, this does not account for any
upper limit of only 1.4% for the abundance of these grains in contribution from the fine-grained water ice observed near the
the coma and the assumption that high water-ice mass loss is nucleus of H2 (A’Hearn et al. 2011; Protopapa et al. 2014). We
needed to account for the hyperactivity. We consider instead point out that large chunks were observed in the coma of 67P
dirty small ice grains (1.2 μm in diameter) with carbon by Rotundi et al. (2015), Fulle et al. (2015, 2016b), and
fractions 0.5% as possible candidates to account for the Agarwal et al. (2016); nevertheless, this comet is not
comet water production rates. The small amount of low-albedo hyperactive.
dust limits the observability of the water-ice grains at In summary, we provide observational limits on the physical
heliocentric distances of 1.0–1.1 au, accounting for our properties of the icy grains responsible for hyperactivity in
observations. Moreover, it quickly converts the ice into water comet Wirtanen: either icy grains on the order of 1 μm in size
vapor, which is needed to account for the hyperactivity. This with a small amount of dust, or large chunks containing
model is based, in part, on the ice grains observed in the coma significant amounts of water ice.
of US10, which has been suggested to be a hyperactive comet
The authors thank D. Wooden for helping to identify the
by Protopapa et al. (2018) based on the detection of water-ice
cometary CN emission. Support for this work was provided
grains in the coma presumably ejected by sublimation of the
through the NASA Solar System Observations program grant
hypervolatile CO2, a process observed at H2 (A’Hearn et al.
No. 80NSSC20K0673. S.P. thanks NASA grant
2011; Protopapa et al. 2014). Interestingly, CO2 has been
80NSSC19K0402 and Space Telescope Science Institute grant
detected in comet Wirtanen as well (Bauer et al. 2021). Notice
HST-GO-15372 for partial funding that supported her work. C.
that the detection of CO2 does not necessarily imply a water-ice E.W. acknowledges partial support from NASA Solar System
grain halo. As an example, while CO2 has been mapped in the Observations grant 80NSSC19K0868. We thank the anon-
coma of comet 67P (Fink et al. 2016), a regular comet in terms ymous referee and D. Bockelée-Morvan for valuable comments
of level of activity (non hyperactive), no water-ice grains have that improved the manuscript.
been detected in the quiescent coma of the comet (Bockelée- Facility: NASA IRTF (SpeX).
Morvan et al. 2017a, 2017b). Small water-ice grains on the Software: astropy (Astropy Collaboration et al. 2018), JPL
order of a micron (5 μm in diameter) have been reported by Horizons (Giorgini et al. 1996), IDL, Spextool (Cushing et al.
Davies et al. (1997) in the quiescent coma of comet Hale– 2004).
Bopp, which is on the high end of a typical comet. Lis et al.
(2019) report an active fraction on the order of 34% at 0.91 au. ORCID iDs
We stress that the water-ice physical properties (purity, grain
size, abundance) depend on the radiative transfer model applied Silvia Protopapa https://orcid.org/0000-0001-8541-8550
to the spectroscopic measurements. Therefore, a consistent Michael S. P. Kelley https://orcid.org/0000-0002-
comparison between H2, US10, Wirtanen, and Hale–Bopp 6702-7676
requires the same modeling strategy to be applied to all the Charles E. Woodward https://orcid.org/0000-0001-
data. We reserve this investigation for future work. 6567-627X
Kelley et al. (2013) examined a population of point sources Bin Yang https://orcid.org/0000-0002-5033-9593
surrounding the nucleus of comet H2 in Deep Impact images.
Kelley et al. (2015) revised their estimates and found sizes up References
to 8 m in diameter for the point sources and suggested they Agarwal, J., A’Hearn, M. F., Vincent, J. B., et al. 2016, MNRAS, 462, S78
could be responsible for the comet’s extended water vapor A’Hearn, M. F., Belton, M. J. S., Delamere, W. A., et al. 2011, Sci, 332, 1396
production and hyperactivity. Radar observations are sensitive A’Hearn, M. F., Dwek, E., & Tokunaga, A. T. 1981, ApJL, 248, L147
to particles of the same size range. In fact, the radar cross A’Hearn, M. F., Millis, R. C., Schleicher, D. O., Osip, D. J., & Birch, P. V.
1995, Icar, 118, 223
section of 2 cm particles is the same order of magnitude as the Astropy Collaboration, Price-Whelan, A. M., Sipőcz, B. M., et al. 2018, AJ,
one reported by Kelley et al. (2015) for the point sources, 156, 123
assuming nucleus-like properties (e.g., low albedo). This Avni, Y. 1976, ApJ, 210, 642
13You can also read