Life history traits explain vulnerability of endemic forest birds and predict recovery after predator suppression
←
→
Page content transcription
If your browser does not render page correctly, please read the page content below
Walker
New Zealand
       et al.: Forest
               Journalbird
                        of Ecology
                           traits, vulnerability
                                     (2021) 45(2):
                                                 and3447
                                                     recovery
                                                         © 2021 New Zealand Ecological Society.                                          1

                  FORUM

Life history traits explain vulnerability of endemic forest birds and predict recovery
after predator suppression

Susan Walker1*           , Adrian Monks1            and John G. Innes2
1
 Manaaki Whenua – Landcare Research, Private Bag 1930, Dunedin 9054, New Zealand
2
 Manaaki Whenua – Landcare Research, Private Bag 3127, Hamilton 3240, New Zealand
*Author for correspondence (Email: walkers@landcareresearch.co.nz)

Published online: 6 July 2021

          Abstract: New Zealand’s native forest bird species with high taxonomic levels of endemism (deep endemics)
          are more vulnerable to decline than species that arrived and speciated more recently. Here we use national-scale
          local occupancy data to show that three endemism-linked life-history traits account for greater vulnerability
          of deep-endemic species in the extant forest avifauna, but also that other, more subtle traits and mechanisms
          favour rather than hinder endemic persistence. We suggest that these traits together provide a basis for predicting
          changes in local occupancy following suppression of introduced mammalian predators in different landscapes.
          Our analyses disentangle the limiting effects of forest area, predation, and food availability for different species.
          They support understanding that predation by introduced mammals is the primary cause of forest bird declines
          and limitation today, but suggest that large tracts of native forest are essential for future restoration of endemic
          forest avifauna, even following suppression of introduced mammalian predators. We predict that with fewer
          predators (1) deep-endemic species would most successfully and rapidly recover in large tracts of warm forest,
          (2) scarcity of forest or food would limit recovery in larger-bodied, less mobile species and in mobile cavity-
          nesters, and (3) interspecific competition would become influential and produce community reassortment.
          Keywords: cavity-nesting, endemism, food limitation, forest bird occupancy, forest scarcity, mobility, predation,
          traits

Introduction                                                             Parlato et al. 2015). Recently, Walker et al. (2019a) showed that
                                                                         New Zealand native forest bird species that are obligate cavity
New Zealand’s record of avian extinctions since human                    nesters, large-bodied, or disperse poorly over land underwent
settlement is unequalled (Worthy & Holdaway 2002), and a                 more rapid declines in local occupancy between the 1970s and
higher proportion of vertebrate species are currently threatened         early 2000s where mean annual temperatures are higher. This
than in any other country (Bradshaw et al. 2010). Native forest          trend is consistent with higher and more constant predation in
birds in New Zealand contribute significantly to global avian            warmer forested sites being the principal mechanism of recent
biodiversity because many taxa are endemic at the level of               forest bird declines. They predicted that a warming climate
order, family, genus, or species. Not all forest bird species are        would exacerbate local extinctions of predator-vulnerable
threatened or declining; however, species that are endemic at            forest bird species by reducing the extent of cool thermal
higher taxonomic levels are more likely to have become extinct           refugia from continuously high predation pressure below the
in the past and endangered since human settlement (McDowall              upper limit of forests.
1969; Duncan & Blackburn 2004). As McDowall (1969)                            Walker et al. (2019a) selected their three avian life-history
noted, the persistent relationship between avian endemism                traits (large body size, obligate cavity-nesting, and limited
and vulnerability to decline in New Zealand “suggests some               mobility) to represent mechanisms that they hypothesised
peculiarity in the evolutionary process … which in a time                regulate species’ local persistence or extinction. This forum
related manner affects the present viability of the species”.            article extends their analysis and discussion of forest bird
     Numerous field studies support the conclusion of Innes              occupancy patterns with two aims:
et al. (2010) that introduced mammalian predators are the                (1) We observe that each of the three life-history traits is
principal driver of modern declines in New Zealand forest bird           more common in forest bird species that are endemic at
species. Traits associated with weak predator escape responses           higher taxonomic levels (Fig. 1). We therefore ask whether
(e.g. flightlessness, ground nesting, or cavity nesting) have            those three traits are the key peculiarities of extant endemic
been identified as the strongest life-history predictors of past         birds that affect their present viability, and thus provide a
extinctions, contemporary threat status, and historical range            coherent mechanistic explanation for the modern endemism–
declines (Duncan & Blackburn 2004; Bronham et al. 2012;                  vulnerability relationship (McDowall 1969).
DOI: https://dx.doi.org/10.20417/nzjecol.45.25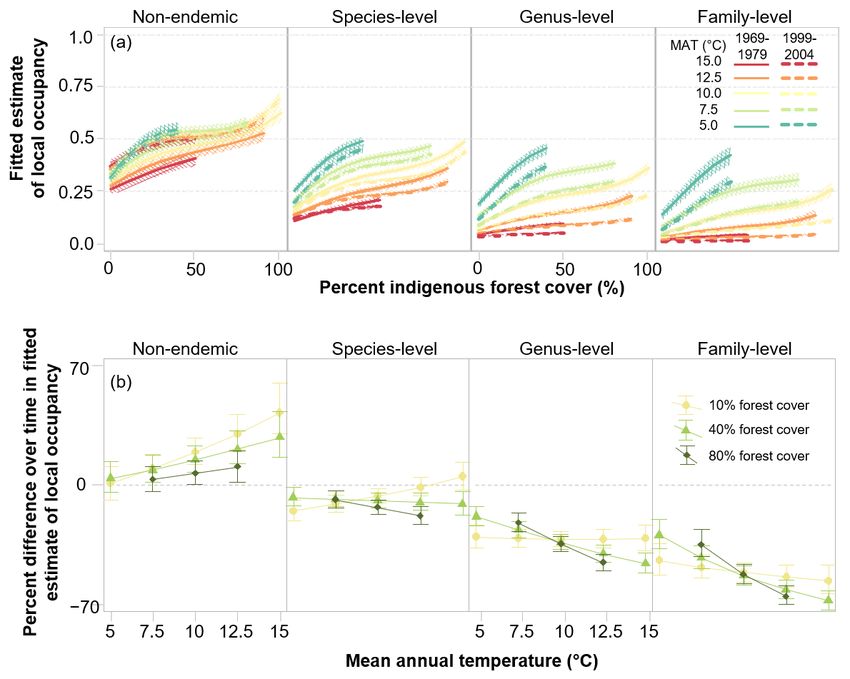
2                                                                            New Zealand Journal of Ecology, Vol. 45, No. 2, 2021

                                                                  compare these predictions with two recent meta-analyses of
                                                                  the outcomes of predator management for forest birds (Binny
                                                                  et al. 2020; Fea et al. 2020).

                                                                  Why do endemism-linked traits matter?
                                                                  Table 1 presents a set of hypotheses about how endemism-
                                                                  linked traits could influence geographical patterns of local
                                                                  occupancy through their interactions with extrinsic factors,
                                                                  and lead to lower local occupancy in species that have higher
                                                                  taxonomic levels of endemism.
                                                                       We hypothesise that the key extrinsic factors are predation
                                                                  pressure and the abundance (or, conversely, the scarcity) of forest
                                                                  and food resources (Table 1). All else being equal, we expected
                                                                  larger areas of forest would sustain larger and therefore more
                                                                  viable avian populations. We also hypothesised that warmer
                                                                  forests would potentially support larger bird populations than
                                                                  cooler forests, because of their higher biological net primary
                                                                  production per unit area (Baisden 2006) and hence less-limiting
                                                                  food resources. However, we also expected that for the same
                                                                  reasons, warmer, more productive forests would support higher
                                                                  densities of introduced mammal omnivores (ship rat Rattus
                                                                  rattus, possum Trichosurus vulpecula), predators (e.g. stoat
                                                                  Mustela nivalis), and herbivores (e.g. ungulates), leading to
                                                                  higher or more continuous predation pressure and/or greater
                                                                  interception of the food resources that would otherwise sustain
                                                                  bird populations.
                                                                       Obligate cavity nesting increases risks to forest birds from
                                                                  predation in New Zealand (although not always elsewhere;
                                                                  Brawn et al. 2011) and has been identified as the strongest
                                                                  predictor of modern range declines (Parlato et al. 2015). Most of
                                                                  the obligate cavity-nesting species in the extant forest avifauna
                                                                  are endemic at the taxonomic level of family (Fig. 1a).
                                                                       The literature suggests that adult birds that are incubating
                                                                  in confined cavities are less able to escape or defend themselves
                                                                  against nest predators (Elliott 1996; O’Donnell 1996), and
Figure 1. Distribution of attributes: (a) cavity-nesting, (b)     nestlings in cavities may be more frequently predated (Massaro
minimum, median (horizontal lines), interquartile range (boxes)   et al. 2013). We therefore expected greater negative effects of
and maximum (whiskers) adult body mass, (c) mobility of 23        cavity nesting on local occupancy where mammal predation
extant native forest bird taxa (Table 2) across four taxonomic    pressure is higher, especially in New Zealand’s warmer
levels of endemism. Non-endemic native species occur elsewhere    forests, where possum capture and ship rat tracking rates are
globally, but the species, genus or family of species-level,      consistently higher (Forsyth et al. 2018; Walker et al. 2019b).
genus-level and family-level endemics occur naturally only in          Large body size is a characteristic of many birds on islands
New Zealand.                                                      (Clegg & Owens 2002; Lomolino 2005) and was identified as a
                                                                  predictor of prehistoric (post-Māori, pre-European) extinctions
                                                                  of New Zealand birds by Duncan and Blackburn (2004) and
                                                                  Bronham et al. (2012). Many larger-bodied species have already
(2) We observe that the adverse effects of large body size and    been selectively extinction-filtered from the New Zealand
limited mobility on local occupancy (Walker et al. 2019a)         avifauna, but species endemic at the level of genus and family
suggest that endemic forest bird distributions are also limited   are nevertheless still larger, on average, than non-endemics
by mechanisms other than predation by introduced mammals.         and species-level endemics in the extant avifauna that arrived
Limits on forest bird occupancy and recovery imposed by           and speciated more recently (Fig. 1b).
these additional mechanisms may become more apparent if                The main explanation advanced for the role of body size in
mammalian predators are made less abundant across more            prehistoric extinctions has been the vulnerability of individuals
extensive areas of New Zealand in future (Parkes et al. 2017).    or species of certain sizes and behaviours to being physically
     We use hypothesised associations between life-history        subdued by the predators (including humans) present at the
traits, geographical gradients, and mechanisms of limitation      time (e.g. Duncan & Blackburn 2004; Bronham et al. 2012).
to disentangle the limiting effects of forest and food resource   However, size can matter for other reasons. Larger-bodied
scarcity on the local occupancy of forest birds from those of     species typically have longer generation times (Peters 1983)
predation. We then apply our mechanistic insights to predict      and lower intrinsic rates of population increase (Sinclair et al.
how future outcomes of predator suppression may differ            2006) and are, therefore, driven to extinction more rapidly
across forest bird taxa and across landscapes with different      by any sustained increase in annual mortality rate, such as
amounts of indigenous forest cover and food resources. We         imposed by novel mammal predation (Brook & Bowman 2005).
Walker et al.: Forest bird traits, vulnerability and recovery 3
Table 1. Mechanisms that may limit local occupancy of forest bird species with different intrinsic life history traits, and
under the influence of different extrinsic factors.
__________________________________________________________________________________________________________________________________________________________________
Limiting characteristic or factor Hypothesised mechanism
__________________________________________________________________________________________________________________________________________________________________
Intrinsic (life-history) trait
Cavity nesting Susceptibility to predation on the nest is greater, and hence vulnerability to population
extirpation through predation is higher.
Large body size Longer generation time means the impact of an increased annual mortality rate is greater
for larger animals than smaller animals over the same number of years.
Populations are at lower densities (number of individuals per unit area) and therefore
more vulnerable to stochastic extinction.
Higher per-individual energetic requirements mean that more extensive habitat and/or
more abundant food resources per unit area are required to sustain a viable population.
Longer generation time means slower population recovery from decline.
Lower intrinsic rate of increase.
Limited mobility Limited mobility constrains the ability to recolonise habitat following local extirpation.
Limited mobility prevents the acquisition of food and other resources from distant sites,
and therefore constrains successful breeding in resource-poor habitats that support lower
densities of mammalian predators more of the time.
__________________________________________________________________________________________________________________________________________________________________
Extrinsic factor
Scarcity of primary natural habitat Smaller areas of natural habitat can sustain smaller avian populations, which are more
susceptible to local extinction.
Pressure from introduced mammalian Higher and/or more continuous predation pressure (e.g. due to higher density of
predators mammalian predators) leads to more rapid extirpation of populations.
Limited food resources Sites offering fewer food resources support smaller bird populations, which are more
susceptible to local extinction due to predation or stochastic events.
Sites offering more food resources support larger populations of omnivores (ship rat,
possums) and herbivores (e.g. ungulates) which intercept the food resource.
__________________________________________________________________________________________________________________________________________________________________
Table 2. Native forest bird taxa (referred to as species in the text) that remain most widespread in New Zealand’s three
main islands. Nomenclature and Endemism level (the highest taxonomic level of endemism) follow Gill (2010) and trait
assignments follow Walker et al. (2019a). Species treated as a single taxon when estimating local occupancy are indicated
by asterisks. Both = the same taxon occurs in both the North Island and the South Island (including Stewart Island/Rakiura);
NI, SI = different species, subspecies or recognised forms occur in the North and South islands; NI = the taxon occurs in
the North Island only; SI = the taxon occurs in the South Island (including Stewart Island/Rakiura) only.
__________________________________________________________________________________________________________________________________________________________________
Common name Name Order Family Island Endemism Maximum Mobility Obligate
level adult body cavity
mass (g) nester
__________________________________________________________________________________________________________________________________________________________________
Whio/blue duck Hymenolaimus malacorhynchos Anseriformes Anatidae Both Genus 900 less mobile no
Kiwi* Apteryx species Apterygiformes Apterygidae NI, SI Order 2800 less mobile yes
Kererū/NZ pigeon Hemiphaga novaeseelandiae Columbiformes Columbidae Both Genus 650 mobile no
Long-tailed cuckoo Eudynamys taitensis Cuculiformes Cuculidae Both Species 125 mobile no
Shining cuckoo Chrysococcyx lucidus Cuculiformes Cuculidae Both none 25 mobile no
Kāreaerea / Falco novaeseelandiae Falconiformes Falconidae Both Species 500 mobile no
New Zealand falcon
Weka Gallirallus australis Gruiformes Rallidae NI, SI Species 1000 less mobile no
Titipounamu/Rifleman Acanthisitta chloris Passeriformes Acanthisittidae NI, SI Family 7 less mobile yes
Grey warbler Gerygone igata Passeriformes Acanthizidae Both Species 6.5 mobile no
North Island kōkako Callaeas wilsoni Passeriformes Callaeidae NI Family 230 less mobile no
Bellbird Anthornis melanura Passeriformes Meliphagidae Both Genus 34 mobile no
Tūī Prosthemadera novaeseelandiae Passeriformes Meliphagidae Both Genus 150 mobile no
Brown creeper Mohoua novaeseelandiae Passeriformes Pachycephalidae SI Family 13.5 less mobile no
Whitehead Mohoua albicilla Passeriformes Pachycephalidae NI Family 18.5 less mobile no
Mohua / yellowhead Mohoua ochrocephala Passeriformes Pachycephalidae SI Family 30 less mobile yes
NZ robin* Petroica longipes / P. australis Passeriformes Petroicidae NI, SI Species 35 less mobile no
NZ tomtit Petroica macrocephala Passeriformes Petroicidae NI, SI Species 11 less mobile no
NZ fantail Rhipidura fuliginosa Passeriformes Rhipiduridae NI, SI Species 8 mobile no
Silvereye Zosterops lateralis Passeriformes Zosteropidae NI, SI none 13 mobile no
Kākā Nestor meridionalis Psittaciformes Nestoridae NI, SI Family 575 mobile yes
Kea Nestor notabilis Psittaciformes Nestoridae SI Family 1000 mobile yes
Kākāriki/parakeet Cyanoramphus auriceps / Psittaciformes Psittacidae Both Species 50 mobile yes
species* C. malherbi / C. novaezelandiae
Ruru/morepork Ninox novaeseelandiae Strigiformes Strigidae Both none 175 mobile yes
_____________________________________________________________________________________________________________________________________________4 New Zealand Journal of Ecology, Vol. 45, No. 2, 2021
Larger animals also typically have lower population densities in two measurement periods (1969–1979, Bull et al. 1985;
(Peters 1983; Stephens et al. 2019), and populations with lower 1999–2004, Robertson et al. 2007) using a consistent survey
numbers of individuals are at greater risk of extinction through protocol. Walker and Monks (2018) estimated probability of
stochastic events (Fischer & Lindenmayer 2007). occupancy for each atlas grid square using a Bayesian mixture
Per-individual energetic needs also increase with body size model for each species that combined probabilities of detection
(Peters 1983; Jetz et al. 2004), so that viable populations of and occupancy to allow for unbiased estimates of occupancy
larger birds need larger areas of forest or forests that produce (MacKenzie et al. 2002; Bailey et al. 2014). The process used
more food per hectare, to meet their energetic requirements. observations from only complete sheets, because incomplete
Conversely, we expect smaller-bodied species (with their lists and casual observations in the Atlas sampled unknown
intrinsically higher population densities, shorter generation proportions of each grid square and its fauna, and thus bias
times, and higher rates of population increase) to be more robust the probability of detection in a grid square downwards by
to extinction by stochastic events, the resource limitations unknown quantities.
imposed by small habitat patches and cooler, less productive Taxonomic level of endemism (sourced from Gill 2010)
forests, and the elevated annual mortality caused by higher was represented in our models by a ordinal variable of four
predation pressure in warmer forests. integers: 1 = non-endemic, 2 = species-level endemic, 3 = genus-
The third endemism-linked trait is limited mobility, which level endemic, and 4 = deep endemic (endemic at subfamily,
we define here as a weak ability to colonise or forage in distant family or order level). We assume that these taxonomic
forested sites across land over a period of years to decades. levels represent increasing lengths of time that lineages have
Flightlessness is a strong indicator of limited mobility and is evolved on New Zealand; this assumption is supported by
common among endemic birds of islands (Diamond 1981), phylogenetic data showing that New Zealand forest bird
but past extinctions and declines have left only two flightless species with higher taxonomic levels of endemism diverged
forest birds among the 23 species in our data set (Table 2). earlier from their closest relatives outside New Zealand (BCM
Endemics in our extinction-filtered set of extant birds are, Potter, unpublished data derived from the global phylogeny
nevertheless, likely to be less mobile than comparatively of Jetz et al. 2012).
recent arrivals (Fig. 1c). Other fixed-effect predictors in the models were time (first
Limited mobility was identified as an influential predictor or second atlas measurement period), percentage of land in the
of bird occupancy by Spurr (1979) and Diamond (1984). square under the indigenous forest land cover class (referred
Diamond’s focus was on water-crossing ability and occupancy to as forest cover) in 2001, and the median mean annual
of “virtual” (i.e. forest patches) and real islands, whereas we, and temperature (MAT) across land in the square (Fig. 2; Walker
Spurr (1979), mainly consider capability to move across land. et al. 2019b; the same forest cover and MAT values were used
Nevertheless, the principal mechanism we invoke is the same: in each time period, as data indicate no significant overall
limited mobility constrains reinvasion and recolonisation after change). We assumed that the percentage of a square covered
population reduction or extirpation, and renders populations by forest best represented the amount of primary (unlogged)
less able to recover from reductions and more susceptible to forest available to birds, and hence best represents availability
local population extinction (Spurr 1979; Diamond 1984). We of the associated food and other resources, such as nesting
also hypothesise that limited mobility exacerbates the adverse sites and shelter; and that squares with higher mean annual
effects of local scarcity of food resources by preventing temperatures produced more food resources per unit area and
individuals from foraging widely (e.g. beyond safe nesting also supported more predators and omnivores. Each model
or roosting locations in less productive forests where there included random effects for bird species and bird family, and
are few predators, or beyond small forest patches) (Table 1). for grid square identity. Exploratory conditional autoregressive
Therefore we predicted that limited mobility would exacerbate (CAR) models showed that indigenous forest cover is correlated
the disadvantages of large body size in endemic species where with spatial terms, so that forest cover parameters were unable
forest or food resource are scarce and that higher mobility to be estimated. However, the concordance of other parameter
would mitigate those disadvantages. estimates in equivalent CAR and lme models suggested that
We tested our hypotheses in two stages. First, we asked those in the lme models were robust despite not accounting
whether local occupancy decreased with endemism level, for spatial autocorrelation.
consistent with McDowall (1969). Then we tested whether Walker & Monks (2018) preserved the variability in their
the three life-history traits are the evolved peculiarities that estimates of local occupancy within grid squares so that this
can explain mechanistically why occupancy is lower, and could be incorporated into future analyses. In this analysis,
continues to decrease faster, in forest birds from lineages that we fitted 1000 replicates of each mixed model, with each
have evolved longer in New Zealand. replicate using a different draw from those preserved posterior
estimates of local occupancy as the response (Walker & Monks
2018; Fig. 3).
Endemism level explains occupancy patterns Fixed effect predictors of local occupancy in Model 1
were a full three-way interaction between time (measurement
Using R software (R Core Team 2020), we fitted linear period), endemism level, and forest availability. We fitted
mixed-effects models (in package lmer; Bates et al. 2015) of these interactions because we expected endemic species
logit-transformed standardised estimates of local occupancy (which evolved in almost wholly forested landscapes before
probabilities for 23 extant native forest bird taxa (hereafter human arrival) to be rarer where forest was scarce, and to have
‘species’) in 2155 grid squares of 10 × 10 km. The estimates substantially completed declines in deforested landscapes
of local occupancy (the probability that a species was by our first measurement period. In Model 2, we substituted
actually present in a particular grid square) were derived by a basis function (a generalised additive model with a 3 df
Walker and Monks (2018) from the Ornithological Society of regression spline smooth of forest cover) for the linear term
New Zealand’s two national atlases of bird distribution, collated to allow non-linear responses of local occupancy to forestWalker et al.: Forest bird traits, vulnerability and recovery 5
Figure 2. (a) Percentage of land under
indigenous forest cover, (b) mean
annual temperature across the 2155
grid squares of 10 × 10 kilometre
for which we have local occupancy
estimates for 23 forest bird taxa.
Figure 3. Medians and 95% intervals of estimates
of the average probability of local occupancy
(‘range occupancy’) across 10 × 10-km grid
squares on New Zealand’s North and South
islands in two measurement periods (1969–1979
and 1999–2004) for the 23 forest bird taxa listed
in Table 2. The estimates were made by Walker
and Monks (2018) for 1083 North Island squares
and 1072 South Island squares, covering similar
areas of land on each island (99 510 and 99 630
km2, respectively).6 New Zealand Journal of Ecology, Vol. 45, No. 2, 2021
scarcity. In Model 3 we introduced a fourth, fully interacting Model 3 was the best of these three models (there was
MAT term, expecting more deeply endemic species to be no overlap with the AICcs for the next-best model), although
rarer where forest was scarce and to have decreased most its fixed-effects r-squared was low (0.19; Table 3). Parameter
rapidly between measurement periods in warmer forests where estimates (Appendix S1 in Supplementary Materials) and
predation rates are higher (Table 3). We used the second-order fitted effects (Fig. 4; Fox & Hong 2009) show interacting and
Akaike Information Criterion (AIC corrected for small sample compounding negative effects of endemism level, indigenous
size or AICc; Burnham & Anderson 2002) across the 1000 forest scarcity, temperature and measurement period on local
replicates to select the best model, and fixed effects r-squared occupancy. Forest bird species that are endemic at higher
to assess model fit. taxonomic levels have lower probabilities of occupancy in
Table 3. Comparisons of fitted models of median local occupancy from most complex to simplest. All models included
random intercept effects for family, species and grid square. k = number of parameters; AICc = the median second order
Akaike’s Information Criterion (Burnham & Anderson 2002); ΔAICc = the difference in median AICc from that of the best
model; βtime = effect of measurement period; βend = effect of endemism level; βcav, βbodsze, and βmob = effects of the
species attributes cavity nesting, body size (maximum adult mass), and mobility; βfor and βtemp = effects of grid-square level
percentage forest cover and median mean annual temperature, respectively; (bs) = a basis function, which is a generalised
additive model with a 3 df regression spline smooth of forest cover. * indicates interacting effects.
__________________________________________________________________________________________________________________________________________________________________
Name Model
Fixed k AICc ΔAICc
effects
r-squared
__________________________________________________________________________________________________________________________________________________________________
Model 6 ~ α + βtime * βcav * βbodsze * βmob * β(bs)for * βtemp + βtime * βend* β(bs) for * βtemp 148 338147.6 0 0.553
Model 5 ~ α + βtime * βcav * βbodsze * βmob * β(bs)for * βtemp + βend 133 339029.5 882.0 0.536
Model 4 ~ α + βtime * βcav * βbodsze * βmob * β(bs)for * βtemp 132 339028.3 880.7 0.557
Model 3 ~ α + βtime * βend* β(bs)for * βtemp 36 348039.7 9892.6 0.190
Model 2 ~ α + βtime * βend* β(bs)for 20 350828.7 12681.6 0.165
Model 1 ~ α + βtime * βend* βfor 12 351109.5 12962.4 0.160
__________________________________________________________________________________________________________________________________________________________________
Figure 4. Medians and 95% intervals of effects on probability of local occupancy in 23 forest bird taxa across New Zealand fitted by our
Model 3, showing: (a) fitted effects of measurement period (solid 1969–1979 in upper row vs 1999–2004 dashed lines in lower row),
environment (with indigenous forest cover on the horizontal axis and temperature in different colours), and endemism level (subplots),
and (b) percentage difference over time between measurement periods (1969–1979 and 1999–2004) in fitted effects of environment (with
temperature on the horizontal axis and indigenous forest cover in different colours) and endemism level.Walker et al.: Forest bird traits, vulnerability and recovery 7
sites that are warmer and/or have low proportions of forest (i.e. endemism effects after accounting for life-history traits;
cover, and higher probabilities of occupancy in squares that Appendix S2; Fig. 5b) differed substantially from those fitted
are colder and are well forested (Fig. 4a). The local occupancy in our Model 3 (Fig. 4), which did not include traits.
of species endemic at higher taxonomic levels decreased Together, our results suggest that cavity nesting, large
significantly between measurement periods, and the largest body size and limited mobility explain most – but not quite
proportional decreases in local occupancy were in family-level all – of the effects of endemism on modern local occupancy
endemic species in warmer, well-forested squares (Fig. 4b). patterns. Notably, the residual effects of endemism level imply
Local occupancy of non-endemic species increased in warmer that our mechanistic framework may fail to capture subtle
squares, and their largest proportional increases were in warm endemism-linked life-history attributes and mechanisms that
squares with little remaining indigenous forest. favour, rather than hinder, the persistence of deep endemics,
These results support McDowall’s (1969) observation especially in cooler and well-forested environments (Fig. 5b).
that more deeply endemic species are more vulnerable to loss,
and our expectations that they would be more vulnerable to
forest scarcity as well as predation by introduced mammals. Life-history traits that limit endemic birds,
mechanisms, and outcomes
Endemism-linked life-history traits explain The interactions among traits and environment in our best
occupancy patterns better model (Model 6) show that warmer temperatures and cavity
nesting (indicating pressure from and susceptibility to predation,
We fitted a further series of models to determine whether respectively) have strong negative effects on local occupancy.
endemism-linked life-history traits (and our associated Negative effects of warm temperatures on the local occupancy
hypothetical mechanisms) were sufficient to explain the effect of endemic forest bird species extended into well-forested
of endemism level on vulnerability to loss. We used the values environments (Figs. 4, 5). This pattern, and more rapid recent
for body size and the assignments for obligate cavity nesting declines in cavity-nesting species in warm forests than in cold
and high or low mobility adopted and explained by Walker forests (third and fourth columns of Fig. 5a), led Walker et al.
et al. (2019b). The binary index of mobility represents species’ (2019b) to conclude that greater occupancy declines in endemic
ability to colonise across land or to forage in distant forested forest birds in warmer indigenous forests were caused by higher
sites within years to decades. Mobile species are flighted rates of mammal predation. However, the model also suggests
and range widely across New Zealand’s main islands. Less that predation is an insufficient explanation for contemporary
mobile species are flightless or have typical dispersal distances patterns of local occupancy in the forest avifauna. Interactions
of individuals within tens of kilometres (although juveniles between species’ body size and mobility and gradients of
may occasionally cross non-forested land, water barriers, and temperature and indigenous forest cover (Fig. 5a) indicate that
larger distances). forest and food scarcity could limit some groups of forest bird
In Model 4, we substituted fixed-effect terms for obligate species more than others even after removing predators. We
cavity-nesting, body size, and mobility for endemism level discuss these indications next.
in Model 3 (Table 3). This model, with six interacting fixed- Here we suggest that if warmth is a reasonable proxy
effect terms (measurement period, the three life-history for median predation pressure, species that remain common
traits, a non-linear basis function of percentage forest cover, in colder squares (which have lower average net primary
and MAT) was the model selected and described by Walker productivity) with little forest (where predators are usually
et al. 2019b, with lower AICc and higher r-squared (0.557) few), but not in warmer squares, will also be robust to forest
than Model 3. We fitted two further models to assess whether and food scarcity when mammal predation pressure is low.
endemism and its interactions were able to explain more than Model 6 shows that small, less-mobile, facultative and non-
traits alone: (1) in Model 5, we added endemism level as a cavity-nesting species (tomtit Petroica macrocephala, robin
non-interactive fixed-effect term to Model 4, and (2) in Model Petroica spp., whitehead Mohoua albicilla, and brown creeper
6, we added the four-way interaction between time, endemism, Mohoua novaeseelandiae) have persisted better in cool squares
temperature and forest cover (i.e. Model 3) to Model 4. AICc than in warm squares, and remain comparatively common in
values indicated that Model 6 was the best supported of the cool places with little forest (lower second column of Fig. 5a).
set, given the data (its model weight was 1, and there was no This outcome supports our prediction that small body size
overlap with AICcs for the next-best model in 1000 replicates). will allow relatively large populations with inherently low
Model 6 had a slightly lower fixed-effects r-squared (0.553) vulnerability to stochastic local extinctions to persist in small
than Model 4 (0.557). The full model r-squared for Model 6 forest patches and other food resource-limited environments.
was 0.713 and the same as for Model 4. It also suggests that their (assumed) limited dispersal ability
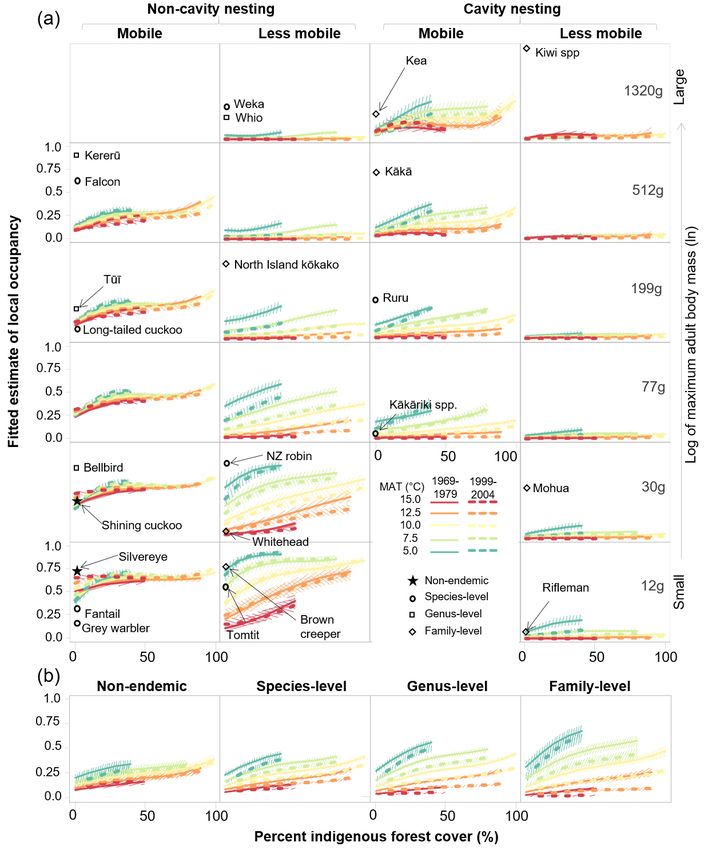
We adopted Model 6 as our best model and Figs. 5a and (Table 2) has not prevented these species from repopulating or
b show the fitted effects of the traits and endemism-level maintaining genetic viability in small or isolated patches of cool
components, respectively. Subplots in Fig. 5a represent the indigenous forest where predation pressure is relatively low
range of combinations of life-history traits in the 23 extant much of the time. We conclude that tomtit, robin, whitehead,
forest bird species, and show that many high-order (5-way and brown creeper would become common even in landscapes
and 6-way) interactions are significant (i.e. 95% confidence with little forest remaining if predation by introduced mammals
limits do not overlap zero; Appendix S2), supporting the were reduced.
presentation of such a complex model. Interacting effects of Three other groups of species have persisted better in cold
time, forest cover, temperature, and traits fitted by Model 6 forests than in warm forests. However, these groups show
were extremely similar to those in Model 4, which excludes distinct decreases in local occupancy as forest cover decreases
endemism and was the best model of Walker et al. (2019b). in cooler squares, indicating a level of dependence on forest
However, the residual effects of endemism level in Model 6 cover regardless of predation.8 New Zealand Journal of Ecology, Vol. 45, No. 2, 2021 Figure 5. Medians and 95% intervals of fitted effects of measurement period (solid 1969–1979 vs 1999–2004 dashed lines), environment, and (a) life history traits, and (b) taxonomic level of endemism on the probability of local occupancy in 23 forest bird taxa (species) in New Zealand’s North and South (including Stewart) Islands, from our best model (Model 6). Percentage indigenous forest cover spans 0 – 100% on the horizontal axes of subplots and median mean annual temperature (MAT) is shown as jade to red coloured lines. In (a), fitted estimates for six levels of adult body mass (on the natural log scale) are shown in different rows of subplots; non-cavity-nesting and cavity-nesting species are shown in the left and right pairs of columns, respectively, and levels of mobility are shown as alternate columns; labelled symbols at the left of each subplot show the taxonomic level of endemism of the contributing forest bird species. The vertical position of each species indicates its maximum adult body mass, and the horizontal column indicates its assignment to mobility and cavity nesting categories. In (b), the four columns show fitted effects on all species within each of the four taxonomic levels of endemism.
Walker et al.: Forest bird traits, vulnerability and recovery                                                                        9

     The first of the three groups is mobile cavity-nesting         and North Island kōkako Callaeas wilsoni) seldom occupied
forest birds of all body sizes (kea Nestor notabilis, kākā          even cool, well-forested squares in 1969–1979 or 1999–2004
Nestor meridionalis, ruru Ninox novaeseelandiae and kākāriki        (upper second and fourth columns of Fig. 5a). Therefore, neither
Cyanoramphus spp.; third column of Fig. 5a). Their continued        lower predation rates in cooler sites, nor reduced need to cross
(albeit declining) occupation of colder, forested landscapes        non-forest gaps (because of larger and more continuous forest
where we assume local food resources may be limited is              areas), appear to have offset the combined disadvantage of
consistent with an ability to forage widely, or to readily re-      large size and limited mobility. The extreme rarity of large,
establish populations following local extirpations. Lower levels    less-mobile species across all New Zealand environments
of predation would probably lead to increased local occupancy       is consistent with four hypothesised mechanisms of decline
of mobile cavity-nesting species in warm forests, where they        and extirpation:
are presently scarce or absent, as well as in cool forests. Local   (1) In larger-bodied species, population densities are inherently
occupancy in this group decreased sharply with decreasing           lower and more constrained by limited food resources in the
indigenous forest cover even in cooler environments. The            cooler, less productive forests, where predator densities are
mechanism leading to a requirement for forest is unknown, and       presently lower.
may involve the need for mature forest trees to provide food or     (2) Limited mobility hinders recolonisation of sites following
nest sites for breeding. Regardless, mobile cavity-nesters may      local extirpation.
not readily reoccupy landscapes with little remaining forest,       (3) Warmer landscapes with little forest are currently inimical
except perhaps as seasonally-foraging non-residents (e.g. kea       because high predation rates combine with elevated risk of
and kākā visiting urban centres in the winter).                     extinction by deterministic and stochastic factors, because
     Large-bodied, mobile, non-cavity nesting species               small forest fragments support few large-bodied individuals
(represented by kererū Hemiphaga novaeseelandiae and                (Brook & Bowman 2005; Fischer & Lindenmayer 2007).
kārearea Falco novaeseelandiae; upper first column of Fig. 5a)      (4) Warmer, well-forested landscapes are also unoccupied
are the second group more likely to occupy cold forests than        because higher predation rates (and possibly pre-emptive
warm forests. However, compared to large, mobile, cavity-           capture of the food resource by omnivorous ship rats and
nesting species (represented by kea and kākā), they occupied        possums, and by introduced herbivores; Innes et al. 2010)
warm forests more often; occupied cool, well-forested squares       prevent persistence of the larger populations that large areas
less often; and decreased in local occupancy more gradually         of productive forest could potentially support.
with decreasing forest cover. This pattern is consistent with            Reduced predation would not mitigate the first and
food being more limiting, and predation and forest cover less       second mechanisms. However, it would moderate extinction
limiting for kererū and kārearea than for the large, mobile,        risk in warm landscapes with little forest, and alleviate the
cavity-nesting parrots. We conclude that lower predation            primary constraint on forest bird populations in large areas
levels would probably lead to increases in local occupancy of       of warm forest. Therefore, large, less-mobile species might
large, mobile, non-cavity-nesting species in warm forests and       successfully reoccupy large, warm, predator-free forest tracts,
in warmer landscapes with moderate forest cover. However,           but their increases in cooler forests would be slower. Large,
we would expect increases to be more modest in cooler forests       less-mobile species may not maintain viable populations in
and other situations where food resources are more limited.         small forest patches, nor recolonise isolated patches following
     The third group (small, less-mobile, cavity-nesting species    local extinctions, so translocation and ongoing population
titipounamu/rifleman Acanthisitta chloris and mohua Mohoua          management would be needed. However, weka (which has
ochrocephala) was effectively absent from warm forests              the greatest dispersal capability of this group; Coleman et al.
and deforested squares in recent decades and became more            1983; Riddell & Riddell 2012) may need limited assistance
strongly confined to the coldest forested squares between our       once re-established.
measurement periods (lower fourth column of Fig. 5a). Lower              Small, mobile, and facultative or non-cavity-nesting forest
levels of predation could allow populations of these species        bird species have been resistant to forest scarcity and predation.
to gradually expand downslope from present cold-forest              Non-endemic silvereye Zosterops lateralis and shining cuckoo
thermal refuges to reoccupy adjacent warmer forests. Our            Chrysococcyx lucidus, species-level endemic grey warbler
model is not informative about whether small, less-mobile           Gerygone igata and fantail Rhipidura fuliginosa, and genus-
cavity nesters can survive in small, isolated forest patches,       level endemic bellbird Anthornis melanura were the species
because their occupancy probabilities were very low even in         most likely to occupy New Zealand’s warm and now largely
the coldest sites with little forest. However, small body size is   deforested landscapes, as well as warmer forests, in 1999–2004
predicted to favour the maintenance of viable populations in        (lower left subplots of Fig. 5a). This was the only group of
small forest patches, some translocated cohorts have survived       species to increase in local occupancy in warmer, largely
and increased on small, predator-free islands (rifleman Leech       deforested and forested environments between 1969–1979
et al. 2007; mohua Miskelly et al. 2017; both species Miskelly      and 1999–2004, and to occupy warmer environments more
& Powlesland 2013), and rifleman has persisted in some very         consistently than the cooler environments where we expect
small mainland forested sites (Withers 2013). Under low             fewer predators.
predation pressure, limited ability to cross non-forest gaps             Lower temperatures had a modest impact on the local
would limit their ability to establish new populations, and to      occupancy of smaller mobile non-cavity-nesters, consistent
re-establish populations following stochastic local extinctions.    with our prediction that small-bodied species would not be
Therefore small, less-mobile cavity-nesting species may not         especially sensitive to scarcity of food. And, rather than a result
reoccupy isolated forest patches without assistance, and could      of food scarcity itself, the negative effect of cold may be an
need ongoing intervention to maintain populations in smaller        outcome of competition (for food or other resources) with the
fragments.                                                          less-mobile, small, non-cavity-nesting species that are more
     Large, less-mobile species (kiwi Apteryx spp., whio            likely to be present in cooler sites (Fig. 5). If so, we would
Hymenolaimus malacorhynchos, weka Gallirallus australis,            predict the outcome we are starting to see in practice (Miskelly
10 New Zealand Journal of Ecology, Vol. 45, No. 2, 2021
2018; Fea et al. 2020) of reduced predation pressure leading to smaller, less-mobile endemic species may be quite capable of
lower indices of abundance in species such as silvereye, grey persisting in relatively small and isolated forest patches, if they
warbler and fantail, concurrent with increases in less-mobile can reach those patches initially (e.g. through translocation).
tomtit, robin, whitehead or brown creeper. Furthermore, as the contribution of predation to local population
extinctions diminishes, limited ability to recolonise sites should
become a less influential constraint on persistence.
Residual effects of endemism level, and
possible mechanisms Warm forests: opportunity and challenge
Because forest scarcity is disadvantageous to most endemic
The significant interacting effects of endemism level, forest forest birds regardless of predation, restoration of populations is
cover, and temperature in our best model indicate that, all likely to be more successful in large tracts of forest. However,
else being equal, deep endemic species (right hand subplot of all large forest tracts are not equal, either for bird species or
Fig. 5b) have an advantage over less deeply endemic species for conservation management. Cooler forests have become the
(subplots to the left of Fig. 5b) in cooler environments. The main refuges of endemic forest bird species today (Walker et al.
fitted effects show that deep endemics are more likely to 2019b). However, they are likely to be intrinsically suboptimal
occupy cooler forests, and are less sensitive to scarcity of environments, especially for larger-bodied species, which
forest cover where temperatures are lower. Our hypotheses did require more food to maintain sizeable populations and are
not anticipate these effects, and we suggest two non-exclusive less capable of travelling distances to obtain it.
causes without (as yet) mechanistic explanations: Warmer, more productive forests offer the best prospects
(1) More deeply endemic species are better adapted to cold for recovery of populations of most endemic bird species,
and to dense forests, and are therefore superior competitors but it is much more challenging to maintain low densities of
for resources in cool, densely forested environments. bird predators at scale in warm forests than in cooler, beech-
Consequently, less deeply endemic species are unlikely to dominated forests (Brown et al. 2015; Elliott & Kemp 2016).
penetrate colder environments and deep forests in the absence Large remaining areas of warm forest still present substantial
(or with a low abundance) of predatory mammals. technical barriers to effective, landscape-scale predator
management, which would need to be overcome to realise this
(2) Endemism level is a proxy for aspects of the evolutionary outcome. Our results suggest that food resource productivity
loss of defences against mammal predation not represented is important for larger avian species, and therefore potentially
by the obligate cavity-nesting trait, and more deeply endemic socially contentious control of introduced herbivores (e.g. deer,
species are superior competitors where mammal predation goats), as well as omnivores (e.g. pigs, possums, ship rats), may
pressure is low. The consequence would be that reduced be needed to assist population recoveries (Innes et al. 2010).
mammal predation will favour recovery of more deeply
endemic species generally over those in lineages that arrived Community reassortment
more recently in evolutionary time.
Reduced predation pressure may result in avian community
reassortment rather than increases in all species (Innes et al.
2010). The warmest and floristically richest forests are likely to
Implications for conservation show the greatest and most rapid increases in local forest bird
richness, especially in more deeply endemic, larger, less mobile
The implications of our results for conservation can be presented or cavity-nesting species. Cooler forests are likely to undergo
as three predictions: similar but more subtle shifts, because they retain more endemic
species now, and because lower food resource productivity will
Recovery potential in deforested landscapes is limited constrain population increases in less mobile, larger-bodied
Forest scarcity will limit the population recovery of some, species. Testing this prediction will require analyses of bird
but not all, forest birds. Our results caution that regardless of outcomes of management across environmental gradients.
predator densities, largely deforested production and urban The rise to dominance of non-endemic and less deeply
landscapes may not readily support populations of larger, endemic small, mobile, non-cavity-nesting species (illustrated
less-mobile endemic species, or breeding populations of most by our results) may be reversed in landscapes with less forest
mobile cavity-nesting species. as small, less-mobile species that appear less dependent on
Some larger, less-mobile and highly predator-vulnerable high levels of forest cover (tomtit, robin, brown creeper) are
species (kiwi, North Island kōkako, tīeke Philesturnus spp.) released from predation pressure. Growing numbers of studies
currently depend for their persistence on intensive predator record displacement of silvereye, grey warbler and fantail by
and population management in small (< 2000 ha) patches less-mobile and/or more deeply endemic species on islands
of warm, mainland forest and on islands. Innes et al. (2010) and in fenced sanctuaries where predator densities have been
point out that some populations have been sustained in small maintained at low levels (Miskelly & Robertson 2002; Miskelly
forest patches for at least some decades (e.g. little spotted 2018; Fea et al. 2020; Binny et al. 2020). Our model shows
kiwi Apteryx owenii, tīeke). Nevertheless, inherently small reciprocal trends in the local occupancy of small insectivorous
population sizes and limited ability to disperse mean this group species along national temperature gradients, consistent with
of species is the most likely to need active management to less-mobile tomtit and robin being competitively superior
top up small isolated sites and maintain genetic variation even to more-mobile silvereye, grey warbler and fantail under
in a predator-free landscape. Mobile cavity-nesting species conditions of low predation pressure.
are also unlikely to establish breeding populations in places The residual effects of endemism level in our model suggest,
with little forest (and, as discussed above, we do not yet fully further, that deeper endemic forest birds generally (and not
understand why). only small endemic non-cavity nesters) may be competitively
A more encouraging inference from our results is that superior to those that are evolutionarily more recent whereWalker et al.: Forest bird traits, vulnerability and recovery 11
predators are few. If this interpretation of our model is correct, atlases on which this study is based. Development of this
competitive interactions following suppression of mammalian work was funded by the Ministry of Business, Innovation and
predators would lead to greater dominance of endemic species. Employment through the Strategic Science Investment Fund
Results of two recent meta-analyses of forest bird outcomes (SSIF) to Manaaki Whenua – Landcare Research. We thank
of management are consistent with these predictions: Binny Ray Prebble for editing.
et al. (2020) showed that deeply endemic birds showed the
greatest benefits from release from predation in ecosanctuaries
compared with less deeply endemic or introduced species; Author contributions
and Fea et al. (2020) showed that deep endemic species, and
(more tentatively) cavity-nesters, benefitted most from both SW: conceptualisation, methodology, formal analysis,
low and high intensities of mammal control. data curation, writing – original draft, review and editing,
visualisation. AM: methodology, formal analysis, writing –
original draft, review and editing. JI: writing – original draft,
Conclusions review & editing.
Changes in local occupancy in New Zealand’s forest avifauna
between 1969–1979 and 1999–2004s were spatially and Data availability
biologically predictable. More deeply endemic species
continued to decline in their remaining forests, while species in All data are held in and available from the permanent data
lineages that arrived most recently in New Zealand expanded storage repository of Manaaki Whenua – Landcare Research
their ranges, especially in warmer environments with little (https://datastore.landcareresearch.co.nz/)
forest. Local occupancy declines were greater in species
with one or more of three endemism-linked life-history traits:
obligate cavity nesting, large size and/or limited mobility. References
Range expansions were greatest in small, relatively mobile
species that do not nest in cavities. Bailey LL, MacKenzie DI, Nichols JD 2014. Advances and
Our combination of intrinsic species’ traits and extrinsic applications of occupancy models. Methods in Ecology
factors reconciles the understanding that predation by and Evolution 5: 1269–1279.
introduced mammals is the primary cause of forest bird declines Baisden WT 2006. Agricultural and forest productivity for
and limitation (Innes et al. 2010), with Diamond’s (1984) modelling policy scenarios: evaluating approaches for
conclusion that the future of New Zealand’s endemic forest New Zealand greenhouse gas mitigation. Journal of the
birds hinges on preserving large tracts of native forest. Three Royal Society of New Zealand 36: 1–5.
life-history traits and two geographical variables (representing Bates D, Mächler M, Bolker B, Walker S 2015. Fitting linear
three extrinsic factors) together provide a coherent explanation mixed-effects models using lme4. Journal of Statistical
for why more deeply endemic extant bird species are more Software 67: 1–48.
vulnerable (McDowall 1969) to both deforestation and Binny R, Innes J, Fitzgerald N, Pech R, James A, Price R, Gillies
predation, and a mechanistic basis for predicting the future of C, Byrom A 2020. Long-term biodiversity trajectories for
different forest bird species with the suppression of introduced pest-managed ecological restorations: eradication versus
mammalian predators in different landscapes. Other traits and suppression. Ecological Monographs:e01439.
mechanisms associated with deep endemism are not captured Bradshaw CJ, Giam X, Sodhi NS 2010. Evaluating the
by the framework, and these may favour deep endemics over relative environmental impact of countries. PLoS One
evolutionarily recent arrivals under reduced pressure from 5(5): e10440.
mammalian predators. Brawn JD, Angehr G, Davros N, Robinson WD, Styrsky JN,
Three predictions emerge about the outcomes for native Tarwater CE 2011. Sources of variation in the nesting
forest birds of the suppression of mammalian predators: success of understory tropical birds. Journal of Avian
(1) The deep-endemic forest avifauna will be most successfully Biology 42: 61–68.
restored in large tracts of warm forest; that is, in the remaining Bronham L, Lanfear R, Cassey P, Gibb G, Cardillo M 2012.
mid to low-elevation tracts of podocarp broadleaved and Reconstructing past species assemblages reveals the
mixed beech forests of the North Island and the northwestern changing patterns and drivers of extinction through time.
South Island. Proceedings of the Royal Society of London B: Biological
(2) Local scarcity of either forest or food will limit the recovery Sciences 279: 4024–4032.
of larger-bodied, less-mobile species and mobile cavity nesters, Brook BW, Bowman DM 2005. One equation fits overkill:
even where predators are successfully suppressed. why allometry underpins both prehistoric and modern body
(3) Interspecific competition will lead to a reassortment of size-biased extinctions. Population Ecology 47: 137–141.
avian forest bird communities, with deeper endemic species Brown K, Elliott G, Innes J, Kemp J 2015. Ship rat, stoat and
replacing those in more recently-arrived lineages that have possum control on mainland New Zealand: an overview
become common in warm and deforested landscapes since of techniques, successes and challenges. Wellington,
human settlement. New Zealand, Department of Conservation. 36 p.
Bull PC, Gaze PD, Robertson CJR 1985. The atlas of bird
distribution in New Zealand. Wellington, New Zealand,
Acknowledgements The Ornithological Society of New Zealand. 296 p.
Burnham KP, Anderson DR 2002. Model selection and
We thank the Ornithological Society of New Zealand and the inference: a practical information-theoretic approach. 2nd
many individuals who collected the data for the two national ed. New York, NY, Springer-Verlag. 533 p.12 New Zealand Journal of Ecology, Vol. 45, No. 2, 2021
Clegg SM, Owens PF 2002. The ‘island rule’ in birds: medium Miskelly CM 2018. Changes in an urban forest bird community
body size and its ecological explanation. Proceedings of in response to pest mammal eradications and endemic bird
the Royal Society of London Series B: Biological Sciences reintroductions. Notornis 65: 132‒151.
269: 1359–1365. Miskelly CM, Powlesland RG 2013. Conservation
Coleman JD, Warburton B, Green W 1983. Some population translocations of New Zealand birds, 1863–2012. Notornis
statistics and movements of the western weka. Notornis 60: 3–28.
30: 93–108. Miskelly C, Robertson H 2002. Response of forest birds to
Diamond JM 1981. Flightlessness and fear of flying in island rat eradication on Kapiti Island, New Zealand. In: Veitch
species. Nature 293: 507–508. CR, Clout MN eds. Turning the tide: the eradication of
Diamond JM 1984. Distributions of New Zealand birds on invasive species. Gland, Switzerland and Cambridge, UK,
real and virtual islands. New Zealand Journal of Ecology IUCN SSC Invasive Species Specialist Group. 410 p.
7: 37–55. Miskelly CM, Tennyson AJ, Edmonds HK, McMurtrie PG
Duncan RP, Blackburn TM 2004. Extinction and endemism 2017. Dispersal of endemic passerines to islands in Dusky
in the New Zealand avifauna. Global Ecology and Sound, Fiordland, following translocations and predator
Biogeography 13: 509–517. control. Notornis 64: 192–205.
Elliott GP 1996. Productivity and mortality of mohua (Mohoua O’Donnell CF 1996. Predators and the decline of New Zealand
ochrocephala). New Zealand Journal of Zoology 23: forest birds: an introduction to the hole-nesting bird and
229–237. predator programme. New Zealand Journal of Zoology
Elliott GP, Kemp JR 2016. Large‐scale pest control in 23: 213–219.
New Zealand beech forests. Ecological Management & Parkes JP, Nugent G, Forsyth DM, Byrom AE, Pech RP,
Restoration 17: 200–209. Warburton B, Choquenot D 2017. Past, present and two
Fea N, Linklater W, Hartley S 2020. Responses of New Zealand potential futures for managing New Zealand’s mammalian
forest birds to management of introduced mammals. pests. New Zealand Journal of Ecology 41: 151–161.
Conservation Biology 35: 35–49. Parlato EH, Armstrong DP, Innes JG 2015. Traits influencing
Fischer J, Lindenmayer DB 2007. Landscape modification range contraction in New Zealand’s endemic forest birds.
and habitat fragmentation: a synthesis. Global Ecology Oecologia 179: 319–328.
and Biogeography 16: 265–280. Peters RH 1983. The ecological implications of body size.
Forsyth DM, Ramsey DS, Perry M, McKay M, Wright EF New York, NY, Cambridge University Press. 329 p.
2018. Control history, longitude and multiple abiotic R Core Team 2020. R: A language and environment for
and biotic variables predict the abundances of invasive statistical computing. R Foundation for Statistical
brushtail possums in New Zealand forests. Biological Computing, Vienna, Austria. https://www.R-project.org/.
Invasions 20: 2209–2225. Riddell DJ, Riddell DW 2012. A swimming North Island
Fox J, Hong J 2009. Effect displays in R for multinomial and weka (Gallirallus australis greyi) in the Hauraki Gulf.
proportional-odds logit models: extensions to the effects Notornis 59: 185–186.
package. Journal of Statistical Software 32: 1–24. Sinclair ARE, Fryxell JM, Caughley G 2006. Wildlife ecology,
Gill B (convenor) 2010. Checklist of the birds of New Zealand conservation, and management. Oxford, Blackwell. 489 p.
and the Ross Dependency, Antarctica. 4th edn. Wellington, Spurr EB 1979 A theoretical assessment of the ability of bird
New Zealand, Ornithological Society of New Zealand. species to recover from an imposed reduction in numbers,
513 p. with particular reference to 1080 poisoning. New Zealand
Innes J, Kelly D, Overton JM, Gillies C 2010. Predation and Journal of Ecology 2: 46–63.
other factors currently limiting New Zealand forest birds. Stephens PA, Vieira MV, Willis SG, Carbone C 2019. The
New Zealand Journal of Ecology 34: 86–114. limits to population density in birds and mammals. Ecology
Jetz W, Thomas GH, Joy JB, Hartmann K, Mooers AO 2012. Letters 22: 654–663.
The global diversity of birds in space and time. Nature Walker S, Monks A 2018. Estimates of local occupancy for
491: 444–448. native land birds from the New Zealand bird atlases.
Jetz W, Carbone C, Fulford J, Brown JH 2004. The scaling of Notornis 65: 223–236.
animal space use. Science 306: 266–268. Walker S, Monks A, Innes J 2019a. Thermal squeeze will
Leech TJ, Craig E, Beaven B, Mitchell DK, Seddon PJ exacerbate declines in New Zealand’s endemic forest
2007. Reintroduction of rifleman Acanthisitta chloris to birds. Biological Conservation 237: 166–174.
Ulva Island, New Zealand: evaluation of techniques and Walker S, Kemp JR, Elliott GP, Mosen CC, Innes JG 2019b.
population persistence. Oryx 41: 369–375. Spatial patterns and drivers of invasive rodent dynamics in
Lomolino MV 2005. Body size evolution in insular vertebrates: New Zealand forests. Biological Invasions 21: 1627–1642.
generality of the island rule. Journal of Biogeography 32: Withers SJ 2013. Population variation of the North Island
1683–1699. rifleman (Acanthisitta chloris granti): implications for
MacKenzie DI, Nichols JD, Lachman GB, Droege S, Royle conservation management. Unpublished PhD thesis.
JA, Langtimm CA 2002. Estimating site occupancy rates University of Auckland, Auckland, New Zealand.
when detection probabilities are less than one. Ecology Worthy TH, Holdaway RN 2002. The lost world of the moa.
83: 2248–2255. Christchurch, Canterbury University Press. 718 p.
Massaro M, Stanbury M, Briskie JV 2013. Nest site selection
by the endangered black robin increases vulnerability to Received: 9 July 2020; accepted: 5 March 2021
predation by an invasive bird. Animal Conservation 16: Editorial board member: George Perry
404–411.
McDowall RM 1969. Extinction and endemism in New Zealand
land birds. Tuatara 17: 1–12.You can also read