INFRASTRUCTURE EVIDENCE BASE - Transport Sector February 2014 - Treasury NZ
←
→
Page content transcription
If your browser does not render page correctly, please read the page content below
INFRASTRUCTURE
EVIDENCE BASE
Transport Sector

February 2014

                                                            Treasury:2832467v1

                   For more information visit: www.infrastructure.govt.nz
EVIDENCE BASE: TRANSPORT SECTOR

                                  Treasury:2832467v1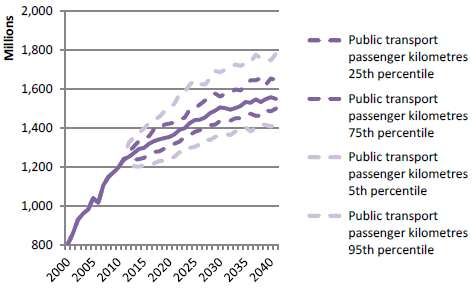
EVIDENCE
BASE
Transport Sector                                                                                                                     February 2014

Introduction
Infrastructure is a crucial part of the New Zealand economy. It supports the day to day activities of New Zealanders, helps to improve
living standards for all, and can be a driver for economic growth. As such, it is vital it is managed as well as possible. Th e National
Infrastructure Plan 2011 sets out a long term vision for New Zealand’s infrastructure and seeks to provide a common direction for how
we plan, fund, build and use all economic and social infrastructure.

                                                                        By 2030 New Zealand’s infrastructure is resilient, coordinated and
                                                           Vision

                                                                           contributes to economic growth and increased quality of life
                                                           Outcomes

                                                                         Better use of existing                  Better allocation of new
                                                                            infrastructure                             investment

                                                                          Investment analysis                 Accountability / Performance
                                                           Principles

                                                                               Resilience                               Regulation

                                                                          Funding mechanisms                          Coordination

A significant constraint identified in the National Infrastructure Plan 2011 was the lack of information about asset condition and
performance to allow more informed decisions and efficient and effective investment. A key part of the National Infrastructure Unit’s
(NIU) work programme over the past two years has been to develop a more robust Evidence Base to address this constraint. In
particular, publishing the Evidence Base enables a discussion identifying the significant issues for New Zealand infrastructure and
options to respond to these. Discussion of these will underpin the NIU’s work programme over 2014, through to the release of the next
National Infrastructure Plan in 2015.

The Evidence Base draws together work on performance indicators (the current state of the infrastructure), scenario and trend analysis
(the future pressures or drivers of demand), the national resilience picture, and the first 10-year Capital Intentions Plan (what is known
about indicative future spend).

This document forms the substantive component of the Evidence Base for the
transport sector, defined by NIU as road, rail, air (airports and air traffic
infrastructure) and sea (ports). It follows from the overview document, which
can be found on the NIU’s website. It draws information from the performance
indicators, scenario and trend analysis, and resilience assessment.

Where data has been provided, this is publically available information, and has
been provided with permission of the information owner.

                                                                                       For more information visit: www.infrastructure.govt.nz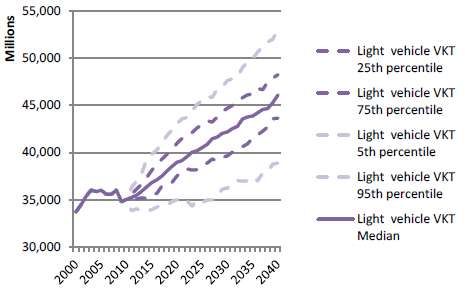
EVIDENCE BASE: TRANSPORT SECTOR

Overview messages
Transport asset quality appears good and management practices adequate across all modes. However, there is limited resilience and
redundancy in some key assets across roads, rail and ports. We are interested in working with the sector to address these areas.

Investment funding varies across modes and consists of a mixture of Crown, local government, regional government, and private
funding. In recent years, the Government has increased investment in key road and rail freight corridors to improve the flow of imports
and exports across the country, and has targeted increased investment towards improvements in State Highways, local roads and
public transport.

The challenge now is to consolidate gains from completed and planned investment, across all modes and to maximise existing network
performance. In Auckland, and elsewhere, investment analysis and the timing and phasing of project implementation will be critical to
achieving network benefits. It will also be important to review how we consider and measure network performance.

It will be essential to balance the level of investment in new infrastructure with spending on maintenance to achieve optimal
performance of the transport network. Investment in safety initiatives, particularly in the road sector, is achieving positive results.

Another challenge will be to optimise the performance of the freight network, and to continue achieving productivity gains in the freight
transport sector. This will involve ensuring that our freight transport and distribution assets are in the right place and support the
Business Growth Agenda target to lift the value of exports to 40% of Gross Domestic Product by 2025. We would encourage more
comprehensive analysis of the relative contribution of road and rail in managing current and future freight demand to help inform
decisions on the appropriate level of investment in each.

Key parts of the network have capacity constraints and these manifest mainly in the larger urban centres. Our cities show similar
levels of urban roading congestion to cities in Australia, despite having lower populations. We consider that opportunities exist to
improve asset performance, in the first instance by managing demand on the network to better utilise existing infrastructure, and
 through better allocation of investment to projects which generate the most benefits, by value of investment. Land use integration
could be improved, with transport systems needing to be given fuller consideration when incorporated into urban design and planning
regimes.

Demand forecasting is generally robust across all modes. Historic assumptions about future revenue growth from fuel taxes are being
re-evaluated in light of international trends such as driving less, increasing fuel prices, e-commerce, increasing fuel efficiency and
alternate fuels. We encourage further analysis of the potential impact on revenue from these longer term trends as well as
consideration of alternative means to deliver improved network performance at less cost.

Context
Transport is important to all New Zealanders. Strong links between road, rail,
shipping, and aviation are vital for moving people and freight around the country
and overseas and for supporting our country’s social and economic performance,
and contribute to higher living standards.

The transport sector employs more than 80,000 people and accounts for about
5.2% of New Zealand’s gross domestic product. The transport sector also has
strategically important assets of high value, such as the State Highway network,
local roads, ports, airports and the rail network. The sector is extensively regulated
by government to: protect and maintain the infrastructure; ensure the modes can
coexist; maintain safety; and meet international standards.

The strategic focus for transport is to ensure a well functioning network for the safe
and efficient movement of people and freight, in order to maximise the economic
contribution of investment in the sector.

                                                                                                                               2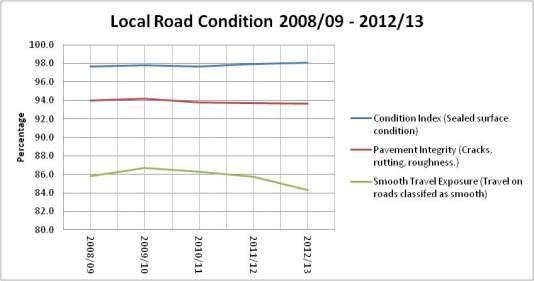
EVIDENCE BASE: TRANSPORT SECTOR

There are many interdependencies within the transport sector and between it and other sectors. Examples of these include the inter-
modal nature of freight transport and the reliance on the transport network to deliver fuel and maintenance materials for other sectors
(e.g. construction, energy).

What do we have?
Overall, New Zealand has a mature transport system with good intra-urban and inter-urban connectivity which enables people and
goods to get to their destinations.

Road

New Zealand has approximately 62,000 kilometers of sealed and 32,000 kilometers of unsealed roads, owned by both local and central
government.

The State Highway network links New Zealand’s town and cities and provides access to key transport hubs such as ports and airports.
It is managed by the New Zealand Transport Agency and
consists of 11,000 kilometres of State Highways and over
4,000 bridges. The current State Highway network is valued at
approximately $26 billion.

The local roading network consists of 66,000 kilometres of rural
routes and 18,000 kilometres of urban routes. This network is
valued at $50 billion, excluding land values (based on an
estimate by the Office of the Auditor General).1

While the State Highway network accounts for only 11.6% of
the total road network, almost half of all kilometres New
Zealanders drive each year are on State Highways, signifying
their contribution to the economy by enabling the mobility of
freight and people.2

Rail

New Zealand has approximately 4000 kilometres of rail
track,1656 bridges, and 1400 public road level crossings.
KiwiRail owns 198 mainline locomotives and 4585 freight
wagons.

KiwiRail owns and operates the rail network and freight fleet,
while local governments contract metro services and own the
metro fleet. KiwiRail also operates passenger services through
KiwiRail Scenic Journeys.

The rail network and operations are valued at $1.035 billion,
excluding the land beneath the rails which is valued at $3.2
billion.

1
    Data about the roading network length can be found here http://www.nzta.govt.nz/planning/data/networks.html
2
    Data about travel on the roading network can be found here http://www.nzta.govt.nz/planning/data/networks.html

                                                                                                                             3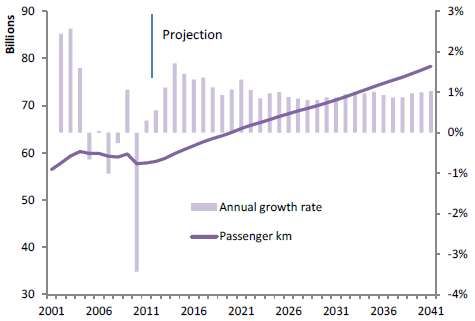
EVIDENCE BASE: TRANSPORT SECTOR

Air

New Zealand has 8 international airports and 28 regional airports.3 Most airports are owned by local government, while some have part
ownership by central government, private parties or shareholders (notably for the largest airport in Auckland).

Airways New Zealand, a state-owned enterprise, provides air navigational infrastructure.

26 domestic and 23 international passenger carriers operate in New Zealand.4 Air New Zealand carries approximately 80% of
domestic traffic and 40% of international traffic. About 95.6% of passenger seat hours are flown on large planes (greater than 30
seats) operated by airlines.5 Total air capacity of 13.6m domestic seats and 6.6m inbound international seats (approximately half of the
total) was available in 2013.6

In the year to June 2013, air freight made up 0.3% of New Zealand’s exports by volume (109,000 tonnes), and 13.8% by value ($5.5
billion). It also made up 0.5% of imports by volume (91,000 tonnes) and 26% of imports by value ($9.5 billion) in the same year.

Sea

New Zealand has 16 ports servicing both international and domestic movements. Many are owned by local government, while some
ports have part private ownership.

36 million tonnes were exported and 20 million tonnes imported by sea in the year to June 2013. Of that, 70% was bulk and 30% was
containerised. The total value of exports by sea was $41 billion, of which $32 billion was containerised. The total value of imports by
sea was $37 billion, of which $21 billion was containerised.

There were 1.7 million shipping container movements in New Zealand during the year to June 2013. 1.2 million were made with full
containers and 500,000 with empty containers. The mean size of international container ships visiting New Zealand was 2,400 TEU
(twenty-foot equivalent units).

There is a fleet of two rail-enabled ferries and three roll-on roll-off vehicle ferries linking the North and South Islands.

Is it where it needs to be?
Road

As noted above, the State Highway network links New Zealand’s towns and cities and provides access to key transport hubs such as
ports and airports. The local roading network meets local needs and often serves as the ‘last mile’ of freight and light vehicle journeys.
Information on whether roads (built and maintained to the required specification for current and future demand) are in the right place is
not readily available; however, a national road classification system is being implemented by the NZ Transport Agency and local
government which will improve the Agency’s ability to maintain roads at levels of service appropriate to their use.

The NZ Transport Agency and local government are also developing routes for high productivity motor vehicles (HPMVs). The
Agency’s analysis, together with feedback from the freight plan work, has shown that using these vehicles will provide significant long-
term safety and productivity benefits and can be achieved relatively quickly and with modest investment in infrastructure and new
vehicles, relative to the benefits. HPMVs will undertake 10-20 percent less travel to move the same amount of freight as standard
trucks. This reduction in travel offers significant commercial benefits, such as reduced vehicle operating costs, driver hours and fuel.

3
      Note that only six airports currently receive international flights – Auckland, Christchurch (long-haul), Wellington, Queenstown,
      Dunedin and Rotorua (short-haul).
4
    Ministry of Transport.
5
      Aviation Safety Summary April-June 2013, Civil Aviation Authority, www.caa.govt.nz.
6
      Tourism Industry Association, Tourism 2025 Analysis. 2013 is an estimate as at July 2013.

                                                                                                                                4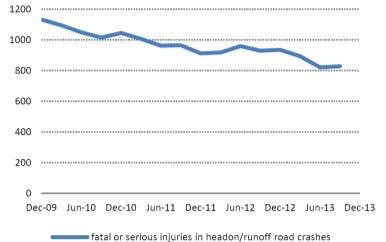
EVIDENCE BASE: TRANSPORT SECTOR

Rail

The maximum extent (5,656km) of the rail network was reached in 1953. Since that time, the network has evolved to link
New Zealand’s main industrial and agricultural centres and ports. As part of the Turnaround Plan, KiwiRail is identifying which parts of
the existing network will remain viable in the longer term. As part of the process, to ensure resources are deployed to the most utilised
parts of the network, KiwiRail has recently mothballed the Stratford-Ohakura and Napier-Gisborne lines and is investigating the viability
of the North Auckland Line.

Air and Sea

The Ministry of Transport estimates that 94.6% of New Zealanders live within 50 kilometres of an airport with scheduled services.

In the year to June 2013, 81% of export air freight and 92% of imports by volume was handled by Auckland Airport. Christchurch
Airport was the second largest freight handling airport.

Ports are spread across the country with each port serving a hinterland (which requires effective road and rail connections) with many
ports competing with each other for trade. The question of which ports the country chooses to operate is at the discretion of individual
ports and international shipping companies.

What quality is it?
Overall, based on the data available, the quality of assets in the transport sector appears adequate to enable the movement of people
and freight.

The World Economic Forum Global Competitiveness report 2013/14 also shows a perceived improvement in the quality of
New Zealand’s overall infrastructure since the previous report in 2011/12. However, the assessment process used by the Forum is
survey based, rather than a quantitative comparison of the quality of infrastructure. It should also be noted that New Zealand’s overall
competitiveness ranking was reduced by a perceived constraint from inadequate supply of infrastructure (particularly road and rail),
where New Zealand is rated as below the peer group mean. New Zealand is ranked 18th for overall competitiveness out of the 148
countries assessed, an improvement of seven places since 2011/12.7

                                     World Economic Forum Global Competitiveness Report 2013/14

                                                        SCORE 2011/12      SCORE 2013/14     GLOBAL RANK       GLOBAL RANK
          TYPE
                                                              (MAX 7)            (MAX 7)          2011/12           2013/14
          Quality of Roads                                           5.5               5.0               45                37
          Quality of Railways                                        3.3               3.7               47                39
          Quality of port infrastructure                             5.5               5.5               24                19
          Quality of air transport infrastructure                    6.2               6.0               12                17
          Overall Infrastructure                                     4.7               5.2               50                43
          Overall Competitiveness                                    4.9              5.11               25                18

                                                                                                                Source: OECD

7
    http://www.weforum.org/reports/global-competitiveness-report-2013-2014

                                                                                                                                5
EVIDENCE BASE: TRANSPORT SECTOR
Roads
State Highway Network
The condition of the roads is assessed by the NZ Transport State Highway Condition
Agency through a number of measures:
100
Smooth ride: the percentage of travel on the network that
is made on a surface smoother than a defined roughness 99
standard.
Percent
98
Rutting:8 the proportion of rutting over the network that
is deeper than 20mm. 97
Skid Resistance: the percentage of travel on the network 96
that is on a surface above a specified skid threshold,
95
based upon meeting surface texture standards.
2009 2010 2011 2012 2013
Most travel in New Zealand is made on surfaces that have a Smooth Ride Rutting < 20mm Safe Stopping
smooth surface and meet skid resistance standards. The
level of rutting is one of the key indicators of the health of the Source: NZTA
underlying pavement and can reduce skid resistance. Over
the past five years there has been a decrease of around 10% in the amount of rutting that exceeds the 20mm depth threshold.
Road Safety
The level of fatalities or serious injuries in crashes provides a
measure of how safe the road system is. While there are Road & Roadside Death/ Serious injuries from collisions
significant differences between regions in the levels of
fatalities and deaths, overall there has been a declining trend
over the past 10 years.
Management of the road network plays a significant part in
road safety but it is not the only contributor to lower deaths
and injuries. Compared globally, New Zealand ranks slightly
above the OECD average for road fatalities per million
vehicles and per million inhabitants.9 The Safer Journeys
strategy launched by the Government in 2010 focuses on
creating a road system that is increasingly free of death and
serious injury by creating safer roads and roadsides, safer
speeds, safer vehicles and safer road use.
Source: NZTA
8
Long shallow channels generally found in wheel paths.
9
OECD Factbook 2013: Economic, Environmental and Social Statistics, www.oecd-ilibrary.org
6EVIDENCE BASE: TRANSPORT SECTOR
Road Fatalities (2010 or latest available year)
Per million vehicles Per million inhabitants
381 429 654 1 298
300
250
200
150
100
50
0
Source: OECD
Local Roads
Information available on the condition of local roads shows that the condition and integrity of local roads has remained fairly constant
over the period 2008/09 to 2012/13. Smooth travel exposure rose initially, but has fallen since 2009/10. This information is derived
using a different method to the State Highway condition information, and therefore cannot be directly compared.
Source: NZTA
Rail
KiwiRail shows better than target results for delays to freight services, and for reducing shunting derailments as a result of
infrastructure defects (an improvement of 30% between 2009 and 2012), although the Annual Safety Performance Report 2011/12
does note a small increase in overall shunting derailments for that year compared to the previous year. The same is true for running
7EVIDENCE BASE: TRANSPORT SECTOR
derailments, although again these have decreased significantly over the longer period. Of the 26 running derailments in 2011/12, 15
were caused by track faults or rail vehicle defects.
A selection of rail performance indicators (2009/10-2011/12)
Source: Kiwirail Annual Reports, Statistics New Zealand
Air
There is a lack of published information on condition of assets across all airports, although a range of metrics detail the quality of
assets for the three airports which fall under Commerce Commission disclosure regime (Auckland, Wellington, Christchurch) showing
passenger satisfaction and reliability of assets. All three airports are reported by consumers to provide very good terminal facilities.
The quality of New Zealand’s airport infrastructure was ranked at 17th in the world in 2013/14 by the World Economic Forum.
Sea
Information is not readily available on the asset condition of ports. By volume, 99% of all import and export trade is shipped by sea
through ports. The quality of New Zealand port infrastructure was ranked at 19 th in the world in 2013/14 by the World Economic Forum.
What capacity is it at?
Some capacity issues apply to the transport network. As
mentioned in the congestion section below, this is particularly the State Highway Capacity Utilisation
case for roading in the main urban centres (Auckland,
150
Christchurch, Hamilton and Wellington).
125
Road
Index Level
The NZ Transport Agency measures capacity, congestion, and
morning and afternoon peak road productivity indicators, on 100
both the state highway network and urban roads. All of this can
be used to assess the capacity of the network.
Auckland
75 Waikato
Wellington
State Highway Capacity Utilisation Canterbury
Rest of NZ
Pressure on the road network is obtained by assessing the total 50
area of road in use compared with the level of traffic it has
capacity for. The utilisation of this capacity can be measured
through the number of vehicle kilometres travelled (VKT) per Source: NZTA
8EVIDENCE BASE: TRANSPORT SECTOR
network kilometre of state highway. The index based chart to the right shows a slight increase in utilisation over the past ten years as a
result of a greater increase in VKT compared to the level the network increases, largely outside of the Auckland and Wellington
regions.
Congestion
Congestion also provides a reflection of the ability of the road network Congestion
60
to meet traffic demand pressures. The NZ Transport Agency
measures congestion levels in the five major metropolitan areas –
Seconds delay per km travelled
50
Auckland, Hamilton, Tauranga, Wellington and Christchurch - based
on seconds of delay, per kilometre travelled.10 These measurements 40
include State Highways and local roads during the morning peak
period. 30
Over the past ten years, there have been fluctuations across the five 20
areas. There has been notable progress in Auckland since 2009, Auckland
Hamilton
which shows evidence of improvement in travel times during the 10 Tauranga
Wellington
morning peak period, despite population increases. Christchurch
0
New Zealand cities show similar levels of overall congestion as cities
in Australia.11 Sydney is the most congested, with Auckland and
Christchurch ranked 2nd and 3rd. Sydney and Auckland rank 14th and
Source: NZTA
15th against all cities globally. We note that the population of Auckland
is 1.4 million and Sydney is 4.7 million, and the congestion rating is only slightly higher in Sydney. Consistent with the congestion data
above, the morning peak congestion component of this indicator has generally declined for Auckland, Christchurch and Wellington over
the period observed, although overall congestion has increased.
Road Congestion in Australasian Cities 2012-13
POPULATION RANKING RANKING CONGESTION % CONGESTION % % CHANGE
CITY (MILLION) Q2 2012 Q2 2013 Q2 2012 Q2 2013 2012-2013
Sydney 4.7 1 1 34 35 1
Auckland 1.4 3 2 30 34 4
Christchurch 3.8 5 3 29 32 3
Perth 1.9 2 4 31 29 -2
Adelaide 1.3 6 5 28 29 -1
Melbourne 4.2 4 6 29 28 -1
Wellington 0.4 8 7 25 28 3
Brisbane 2.2 7 8 25 25 -
Canberra 0.4 9 9 18 19 1
Source: TomTomTraffic Index
10
Based on the annual March surveys of morning peak periods. This measure has not been applied to Christchurch subsequent to
the earthquakes.
11
TomTom Traffic Index Q2 2013 – a report comparing congestion levels in over 169 cities across six continents.
http://www.tomtom.com/en_nz/trafficindex/
9EVIDENCE BASE: TRANSPORT SECTOR
Road Productivity
Source: NZTA
Roads in Auckland and Wellington operate more than a third below free flow conditions, and the network in Christchurch is currently
operating at only 40 percent of free flow conditions in the peak periods. High productivity is achieved if both speed and flow are
maintained near 100 percent.
A multi-faceted approach of demand management of the existing network (including intelligent transport systems), regulatory reforms
within the transport-using sector as well as new investment in public transport and road capacity, has been adopted by the NZ
Transport Agency to manage the State Highway network in New Zealand.
In general land use integration could be improved, with transport systems needing to be given fuller consideration when incorporated
into urban design and planning regimes.
Rail
Passenger Rail Boardings NZ 2000-2013
Metro rail passenger boardings per year have increased from
12.2 million passengers to 21.4 million passengers over the 25
Passenger Boardings (m)
period 2000 to 2013.12 The majority of increased boardings 20
have been in Auckland, reflecting the significant metro rail
investment by the Government and resulting service 15
improvements and capacity.
10
As shown in the rail section above, capacity utilisation on the rail
freight network has improved by 15 index points since 2009/10. 5
0
Auckland Wellington Total
Source: Ministry of Transport
12
Ministry of Transport, Transport Monitoring Indicator Framework, www.transport.govt.nz
10EVIDENCE BASE: TRANSPORT SECTOR
Air
A process of independent ‘slot scheduling’ applies to international airline arrivals and departures at Auckland, Wellington and
Christchurch Airports, and domestic and international movements at Queenstown Airport. Internationally accepted practices are
applied to resolve potential runway and terminal congestion that might otherwise arise at peak times, and to ensure arrivals and
departures in New Zealand match airport slot availability at the overseas origin/destination.
Freight
In addition to the data above, the Ministry of Transport conducted a study in 2008 into freight demand; “The National Freight Demand
Study”. It forecasted that freight volumes would double over the next 30 years. An updated version of the study is due to be published
in early 2014.
The Government has also set the target of lifting export earnings to 40% of GDP. The transport sector will need to respond to the
challenge of increasing domestic and export volumes if the current range of export freight products remains the same. A change in the
mix of export freight products may be required to achieve this target. For example, in the year to June 2013, wood products made up
about 50% of New Zealand’s sea exports by volume and only 8% of sea exports by value. The export value of logs was about $125
per tonne, processed timber $712 per tonne and pulp and paper product $691 per tonne. By comparison, the average value per tonne
of export air freight was $59, 601 in the same year.
The NZ Transport Agency is coordinating a series of ‘Freight Stories’, bringing together government, regional and private interests, to
identify opportunities to improve the performance of the freight network (road, rail, air and sea). 13
Current policy settings allow the market to decide what the best combination of ports and airports is for New Zealand. Improving the
evidence base will help to inform whether these policy settings are correct and what is the best balance between collaboration and
competition.
Market decisions on which ports and Total and Median Quarterly Container Ship TEU Capacity
airports to use (particularly ports) have
600000 3000
flow on implications for road and rail
network requirements. This may be
especially so if bigger container ships 500000 2500
(i.e. 6000 container capacity plus) begin
to service the New Zealand market, with
corresponding demand for more 400000 2000
capacity on the road and rail systems
connecting the ports. The Ministry of
Transport is currently investigating 300000 1500
potential future freight scenarios
associated with the longer term make-up
of port infrastructure in New Zealand. 200000 1000
We expect this investigation to inform
our understanding of the sector.
100000 500
The graph shows total and median Total ship TEU capacity Median ship TEU capacity
capacity of container ships visiting
New Zealand between 2007 and 2013. 0 0
07Q3 08Q1 08Q3 09Q1 09Q3 10Q1 10Q3 11Q1 11Q3 12Q1 12Q3 13Q1 13Q3
Following a decline in total capacity after
the Global Financial Crisis in 2008, total
Source: Ministry of Transport
13
http://www.nzta.govt.nz/planning/process/freight.html
11EVIDENCE BASE: TRANSPORT SECTOR
capacity visiting New Zealand has recovered to almost 600,000 twenty-foot equivalent containers (TEU). The median capacity
(indicating size) of ships has grown to about 2750 TEU. The latest generation container ships running on key trade routes between
Asia, North America and Europe have capacities of up to 15,000 TEU.
At present the largest container ships visiting New Zealand on a regular basis have capacity of about 4500 TEU. Based on the
evidence, the NIU does not expect a dramatic increase in the size of container ships visiting New Zealand over the short to medium
term, but considers planning should be undertaken now, to accommodate this scenario in the future.
Finally, discussions with stakeholders have identified a number of specific challenges in managing New Zealand’s freight task:
Freight routes in south Auckland – these issues are being investigated as part of the East West Link project.14
Availability of high quality rail rolling stock – this is being addressed through investment in the KiwiRail Turnaround Plan15.
Conflict of freight and commuter rail – this is a potential issue in Auckland and Wellington as converging commuter and freight
routes become more congested.
Availability of cargo space for air freight – this is interdependent with growth in air passenger services (as some space on these
services is allocated to cargo).
Freight routes connecting major ports and inland ports in urban centres – a key challenge for the sector, particularly as freight
volumes grow and in the event that bigger ships come to New Zealand.
Availability of land for marshalling and storage space at ports – some major ports are currently constrained by the area available to
them resulting in the implementation of demand management practices, the development of inland port options and/or area
expantion through land reclamation.
Space for high seasonal freight volumes on domestic and international shipping routes – due to the seasonal nature of many of
New Zealand’s key agricultural exports, export capacity is at a premium in the productive season. Smoothing the availablity of
export services to meet demand is a continuing challenge for the sector. 16
How resilient is it?
Resilience is a key issue for the transport network. Disruption in one area of the network (e.g. Manawatu Gorge or inter-island ferries)
can have significant knock-on effects further along the network and create impediments to freight and population mobility with
economic and social consequences.
A network wide view that considers the most efficient and effective means of providing an appropriate level of resilience needs to be
developed. The Ministry of Transport and NZ Transport Agency have a number of initiatives underway to develop a resilience evidence
base. NZ Transport Agency have undertaken a preliminary review of the road transport sector and have a research project yet to be
published entitled “Measuring the Resilience of Land Transport”.
In addition, KiwiRail, NZ Transport Agency and Transpower have developed a Joint Resiliency Operating Framework and are
continuing to apply this.
14
www.aucklandtransport.govt.nz/improving-transport/east-west-link/Pages/default.aspx
15
http://www.kiwirail.co.nz/media/publications.html
16
Freight Information Gathering System Report, Ministry of Transport, www.transport.govt.nz
12EVIDENCE BASE: TRANSPORT SECTOR
In the table to the right resilience expectations from a national Key: Levels of Resilience
perspective are identified as low medium or high. When making High
these judgements a wide range of aspects require
Medium
consideration. To demonstrate; under Local Roads “Strategic
freight routes” are those routes generally to and from airports Low
and ports generally with a very high economic value associated
with them and generally carrying freight of a time critical nature.
Expectations
Resilience
Resilience
Desired
Movement
Transport E
Assessed
Also, generally throughout the country these are identified routes to
better manage heavy vehicles particularly through the urban areas
with associated safety and urban amenity values. A high level of
“Resilience Expectation” is therefore attributed to them. An
“Assessed Resilience” of medium reflects the significant Local Roads G
vulnerabilities of some of these routes both from limited alternate Suburban − I
options and urban pressures for example. In contrast “Suburban Main arterial with alternate − I
roads” have a low “Resilience Expectation” in part due to the Main arterial – no alternate − R
relatively low economic value associated with them and also the Strategic freight routes ↑ T
generally large number of alternate access options. “Suburban National Roads 6
roads” are also a good example of level of resilience being National with alternate − 1
dependent on your perspective; if you reside in a particular
National – no alternate ↑ 2
suburban road you a likely to expect a high level of resilience and in
Road/Rail Link Span H
many cases this probably exists.
Cook Straight ferries & terminals − D
Ports have been the subject of specific attention recognising their Rail
- E
critical importance to New Zealand’s productive economy. The Suburban (incl rolling stock) ↑ D
University of Auckland and others have been undertaking research National (incl rolling stock) ↑ D
considering tsunami vulnerabilities to port network operations and National Train Control Centre ↑ D
structures. The Port of Lyttelton, and the strategic freight routes Ports R
servicing it is a particular case in point as it looks to recover from Individual Ports − R
damage sustained during the earthquake events. Ports with specialist facilities ↑ C
The assessment included here has been created by the National Ports Network ↑
Infrastructure Unit, taking a national level perspective, and thus may Airports
differ from other perspectives. Further work is needed to develop Regional airports −
this with robust supporting evidence; however, this does provide a Airways NZ −
starting point for prioritising efforts. Based on this assessment, key
areas of attention are; Strategic freight routes, National Roads with no
reasonable alternate routes, Rail and Ports.
What are we investing?
A key principle underlying the funding of transport infrastructure is that the cost of providing the infrastructure should be borne by those
that use it as far as possible.
Investment funding varies across modes via a mixture of Crown, local and regional government, and private funding. In recent years,
the Government has increased investment in key road and rail freight corridors to improve the flow of imports and exports across the
country. It has also increased overall investment in State Highways, local roads and public transport.
13EVIDENCE BASE: TRANSPORT SECTOR
Land Transport Investment
Crown funding for land transport infrastructure investment in roads is hypothecated through Fuel Excise Duty, Road User Charges and
Motor Vehicle Registration fees. The New Zealand Transport Agency is charged with assessing which projects should be progressed
and allocating funds accordingly. Ports, airports and the rail freight network operate on a commercial basis.
Total Government Transport Expenditure as a percentage
of Gross Domestic Product
2.2%
2.0%
1.8%
1.6%
1.4%
1.2%
1.0%
0.8%
0.6%
1975 1980 1985 1990 1995 2000 2005 2010 2015
Note: Includes, NLTF, Super Gold Card, KiwiRail Turnaround Plan expenditure, Metro Rail expenditure and other
non-NLTF expenditure. Excludes costs associated with the purchase of KiwiRail
Source: New Zealand Treasury, Ministry of Transport, New Zealand Transport Agency, Statistics New Zealand
The 2012-15 National Land Transport Programme (NLTP) represents a $12.28 billion investment by Government and local authorities
in New Zealand’s land transport system. Priority is given to activities that advance the strategic direction of the Government Policy
Statement on Land Transport Funding: economic growth and productivity, value for money, road safety and travel choice.
Rail
The rail network continues to undergo a significant investment programme to address the legacy of underinvestment. In total, over $2
billion has been invested in the rail network since 2011. Through the Turnaround Plan, the Government has made a significant
investment to support KiwiRail in repositioning itself to operate as a successful business ($845 million has been appropriated over
2010/11-2013/14). Government has also provided separate capital investments in Auckland and Wellington to support metro rail
improvements (an example of this is the Auckland electrification project).
Air and Sea
Central government makes a much more limited investment in aviation and maritime infrastructure, which is generally provided at cost
to users. In the past there have been some Crown contributions to Joint Venture Airports and Crown entities (e.g. Maritime NZ).
Recent and ongoing funding reviews by the Civil Aviation Authority and Maritime NZ are providing greater clarity around appropriate
price adjustments to user charges, balanced against the cost incurred by agencies to deliver services.
14EVIDENCE BASE: TRANSPORT SECTOR
How productive is it?
As with all sectors, data on the transport sector’s overall productivity is incomplete; however, there is information in the public domain,
such as the information published by airports under the Commerce Commission disclosure regime (Auckland, Wellington and
Christchurch).
In addition, in 2012 the New Zealand Productivity Commission published the findings of its inquiry into International Freight Transport
Services.17 The key findings were:
Productivity in New Zealand’s transport and storage industry grew strongly in the 1990s, but hardly at all in the 2000s.
Productivity measures indicate that New Zealand ports and airports compare favourably with Australian counterparts. By
international comparison, New Zealand customs services are efficient.
Container productivity indicators show considerable variation in the performance of New Zealand’s ports, with Tauranga the
strongest performer. There may be opportunities to either lift the performance of the lower performers or to shift freight towards the
top performers.
Compared internationally, New Zealand has low volumes of freight per kilometre of rail, and smaller trains and trucks.
There is little information about the productivity of freight handling at airports. Auckland Airport’s overall productivity (passenger
and freight) compares favourably with other Asian and Pacific airports, while Christchurch is average.
Ad valorem sea freight costs (measured as the price paid for freight relative to the value of the goods being transported) have
been coming down over the last 20 years, although the rate of improvement slowed in the 2000s. However, after accounting for
compositional factors, ad valorem sea freight costs are about 21% higher in New Zealand than in Australia. Given that a high
proportion of New Zealand’s exports are shipped by sea, this is a considerable cost difference. The onshore components of
New Zealand’s air and sea freight costs, particularly its port handling costs, compare favourably with Australia and other OECD
countries.
17
Source: NZ Productivity Commission, International Freight Transport Services Inquiry, April 2012.
15EVIDENCE BASE: TRANSPORT SECTOR
The following is a summary of the Government’s response to the New Zealand Productivity Commission’s 2012 International Freight
Transport Services Inquiry:
The Commission identified five top opportunities for improving the international freight system, which it considers would make the
largest difference to New Zealand’s future economic performance and prosperity. The Government agrees with the Commission
about the importance of these opportunities and intends to make progress against them all:
1. Lift the quality of infrastructure planning and coordination
The Government intends to make more use of ‘facilitated discussion’ models of cooperation in coordinating investment planning.
The New Zealand Transport Agency is currently initiating facilitated freight planning processes, which will include representatives
from the Government, councils, freight producers, and transport operators. The Government is also currently progressing reforms
to improve the planning and coordination of infrastructure investment through the Better Local Government reform programme and
phase two of the Resource Management Act reforms. The Commission has made a number of useful recommendations that will
inform this work.
2. Better governance of ports and airports
The Government will work together with councils to clarify the objectives of port ownership, to better manage conflicts of interest,
and to improve monitoring and information in order to support better decision making. Part of this work will be progressed through
the Better Local Government reform programme.
3. Make competition regimes for freight more pro-competition
The Government is currently progressing the Commerce (Cartels and Other Matters) Amendment Bill, which is designed to
encourage pro-competitive collaborations between businesses, while at the same time deterring anti-competitive cartel behaviour,
by narrowing the exemptions from competition law.
4. Build more productive workplaces at ports
Good workplace relationships between employers and employees are essential for developing high-productivity workplaces. The
Government supports the proposed improvements to governance and information infrastructure, a number of which are for local
authorities and port companies to consider. Recent changes to the Employment Relations Act have also been designed to
encourage more productive employer and employee relations in all workplaces.
5. Develop a richer information infrastructure
The Government intends to develop more comprehensive systems for gathering and disseminating freight data in order to support
better individual and co-ordinated decision making, monitoring and policy development. In designing these systems, the
Government will seek to minimise compliance costs imposed on the freight services sector.
The full government response to the Productivity Commission’s inquiry into International Freight Transport Services can be
found at http://www.treasury.govt.nz/publications/informationreleases/transport.
An area for further investigation is the performance and productivity of the transport construction sector. Recent measurement
adjustments by Statistics New Zealand18 have revised the picture of declining productivity in the construction sector. While there are still
challenging measurement issues, it appears from these that productivity performance of the sector has flat-lined for 20 years and there
is still a growing productivity deficit relative to Australia; there is scope for improvement. The productivity performance may be due to a
range of systemic issues, rather than under-investment in capital. The civil construction sector is closely coupled to government as
central and local governments are by far the major purchasers of civil works. Government policies, regulations and procurement
systems influence the productivity performance of the sector. Improving performance therefore requires a coordinated approach
between government and industry.
18
Industry Productivity Statistics 1978-2008 (2010), Statistics New Zealand
16EVIDENCE BASE: TRANSPORT SECTOR
How well are we managing it?
Roads
The Government Policy Statement on Land Transport Funding (GPS) 2012-2015 describes Government’s funding priorities for ten
years 2012/13 – 2021/22 and outlines the expected expenditure levels by broad transport type. 19 The NZ Transport Agency is required
by legislation to allocate funding to activity classes within the funding ranges set out in the GPS. The NZ Transport Agency gives effect
to the GPS through the National Land Transport Programme (NLTP). The NLTP has a 10 year outlook and lists transport activities and
packages of activities which are expected to be considered for funding over the next three years. The NZ Transport Agency uses a
three factor assessment framework for investing National Land Transport Fund revenue. These are:
Strategic fit – how projects and policies align with the Government Policy Statement priorities ( economic growth and productivity,
value for money and road safety)
Effectiveness criteria – ensuring that whole-system options have been considered and have been given appropriate considerations
Efficiency criteria – the value of the solution in relation to the resources used (based on cost-benefit analysis calculations in the
Transport Agency’s Economic Evaluation manual).20
The NZ Transport Agency currently considers all three of the above criteria in its decision-making process for transport projects and
programmes. Therefore, cost-benefit analysis is at present only one factor in the project prioritisation process and there is a risk that
construction and maintenance initiatives implemented do not deliver the highest possible value to the network.
We would encourage consideration of more comprehensive use of cost benefit analysis, with a view to consistently accounting for
effectiveness, efficiency and strategic criteria, thereby improving transparency and confidence that the highest value projects are being
prioritised.
The accuracy of NZ Transport Agency demand forecasting is generally good. It is the role of the Ministry of Transport to forecast
revenue. Historic assumptions about revenue growth from fuel taxes are being tested in light of international trends such as driving
less, increasing fuel prices, e-commerce, increasing fuel efficiency and alternate fuels. The Ministry of Transport is undertaking further
analysis of the potential impact on revenue of these longer term trends.
Rail
KiwiRail is operating in a commercial environment and is implementing the Turnaround Plan. Capital investment through the plan is
focused on improving key freight services and maintaining the reliability and safety of the rail network. Revenue growth has been
positive but it is less than originally forecast in the Plan, though volumes are increasing. Rail continues to provide for the high bulk,
less time sensitive sector of the freight market and complements road in managing New Zealand’s overall land freight task. We would
encourage more comprehensive analysis of the relative contribution of road and rail in managing current and future freight demand to
help inform decisions on the appropriate level of investment in each.
Sea and Air
The Port Companies Act and Airport Authorities Act assign a commercial focus to port and airport companies. The principal purpose of
a port company, specified in the Port Companies Act, is to operate as a successful business. Similarly the Airport Authorities Act
specifies that an airport company is to be managed as a ‘commercial undertaking’, which has been interpreted in case law to m ean
maximising the commercial value of the company over time. By and large this model operates effectively although improved
governance arrangements could, in some cases, improve the sector’s overall efficiency.
19
A new GPS is drafted every three years and GPS 2015-2018 is currently under development
20
For more information see: http://www.nzta.govt.nz/about/newsletters/keeping-connected/3048/news.html
17EVIDENCE BASE: TRANSPORT SECTOR
Sector-wide View
The Office of the Auditor General (OAG) recently published an overview of its work in the transport sector. The key findings were:
Central government transport entities have good systems and controls. These entities have improved the quality of their service
performance reporting in recent years.
The OAG found that some local authorities’ service performance reporting has improved through explaining their longer-term
results.
In 2010 and 2011, OAG completed two performance audits into how NZ Transport Agency is maintaining and renewing the State
Highway network. The audits found that, overall, NZ Transport Agency effectively and efficiently maintains the State Highway
network to the required condition by ensuring that quality and timely maintenance and renewal work is completed on the network.
OAG’s 2011/12 annual audit of KiwiRail found that it is making steady progress to improve its asset management and
recommended where we think further attention is required.
OAG’s audits of local authorities’ 2012-22 long-term plans found that local authorities face many challenges planning transport
activities – these include how best to replace ageing infrastructure, responding to changing land use, and managing higher input
costs. There is evidence that local authorities are well placed for long-term sustainability of transport assets because of forecast
investment and reinvestment. However, the investment forecast relies on good asset management planning.21
6
What future trends and scenarios may impact transport infrastructure?
As part of the development of the Evidence Base for New Zealand’s infrastructure, the NIU has undertaken an investigation into future
pressures placing demand on our infrastructure for a range of plausible scenarios: a central scenario (best estimate of future
infrastructure demand), an upside scenario (high infrastructure demand) and a downside scenario (low infrastructure demand).
Each scenario has an associated set of projections of future infrastructure demand. Rather than developing new demand models or
forecasts, the NIU relies upon existing sector forecasts where they are applicable and relevant. In the transport sector, our analysis
relies on extensive modelling and forecasting undertaken by NZ Transport Agency and the Ministry of Transport.
The full results of our scenario modelling investigation have been published in a separate document available on the NIU website, but
relevant extracts for the Transport sector are reproduced below.
Implications for transport infrastructure in the central scenario
The demands placed on our transport infrastructure in the central scenario can be separated into freight movements (export and
domestic) and household travel (including tourism). In this analysis, we draw upon information from the National Freight Demands
22 23
Study (Richard Paling Consulting, 2008), published outputs from the land transport demand model (Stephenson & Zheng, 2013),
and supporting data from NZ Transport Agency and the Ministry of Transport. We note that the Freight Demands Study is currently
being updated by the Ministry of Transport and will be published in early 2014. Results from the revised study will supersede the
forecasts shown below.
21
Office of the Auditor General, Transport Report 2013, http://www.oag.govt.nz/2013/transport-audits
22
The Ministry of Transport commissioned Deloitte to carry out an update of the National Freight Demand study and to undertake a
Future Freight Scenarios study. Each of these studies may provide an improved outlook on future transport demands. The reader is
referred to the Ministry of Transport website (http://www.transport.govt.nz/research/nationalfreightdemandsstudy/), where these
reports will be published upon their completion (expected to be in early 2014).
23
Several agencies are working with NZIER to undertake further demand modelling across the transport modes (completion date
unknown).
18EVIDENCE BASE: TRANSPORT SECTOR
Key implications for our transport infrastructure as reported in the 2008 National Freight Demands Study include:
From 2006 to 2031, the number of freight tonnes lifted (and tonne-kms transported) is expected to increase by 70 - 75%. Freight
growth will be in both basic commodities (typically transported short distances) and sophisticated products (longer distances)
Rail freight demand is projected to increase by 70% between 2006 and 2031 – with its modal share remaining approximately the
same over that period
Coastal shipping is projected to reach between 8.5 and 9.0 million tonnes by 2031 – approximately double the level in 2006 (this is
driven in part by planned expansion of the Marsden Point refinery)
Substantial growth in traffic generation is forecast for Waikato with an increase in forestry and dairy traffic as well as increased
movement of aggregates to serve both Waikato and Auckland. Canterbury is also forecast to experience high growth in traffic
generation due to an increase in dairy production
Auckland is projected to have the highest growth in terms of traffic that is attracted to the region – reflecting the movement of
primary products from Northland and Waikato
At the household level, transport demand is affected by demographic shifts, economic changes and fuel prices (among other factors).
The land transport demand model developed by NZIER contains an extensive range of inputs that allow various scenarios to be
modelled. The base case modelled by NZIER relies on the following assumptions:
Macroeconomic – generally based on long-run historical averages and best estimates (e.g. an oil price of $300 in 30 years,
roughly aligned with the IEA’s World Energy Outlook projection published in 2012)
Industry – industry GDP is a function of total GDP, but with shares modeled using a VAR
Technology – gradual improvements in fuel economy (0.2% per annum) and various assumptions on the share of alternative fuels
used by vehicles
Price and income responsiveness – base case assumptions linking travel behaviour to changes in income or the cost of travel
Regional dimensions – GDP and industries are included by region, as are other variables such as household incomes, freight
demand, etc
Tax rates – assumed to grow in line with inflation
From the NZIER report produced for NZ Transport Agency, the key implications for our infrastructure in the base case include:
Household travel demand is projected to grow nationally by 1.0% per annum over the next 30 years, although the kilometres
travelled per vehicle are projected to decline
Two thirds of travel demand growth is due to population growth. Regionally, this translates to increased pressure on transport
networks in our urban centres
Public transport demand is projected to grow by 0.95% per annum over the next 30 years. The public transport share of travel is
projected to gradually decline over time (as incomes grow, enabling private vehicle use)24
24
We note that, although the NZIER / NZTA model predicts a gradual decline in the future, the public transport share of passenger
kilometres has shown a steady growth trend over the past decade. This may merit further monitoring and consideration as time
progresses.
19EVIDENCE BASE: TRANSPORT SECTOR
Graphs of selected results are shown below:
Growth in travel demand (passenger-kilometres) Growth in public transport demand (passenger-kms)
Source: National Long-Term Land Transport Demand Model, NZIER and NZTA (2013)25
Implications for transport infrastructure in the upside and downside scenarios
A limited set of stochastic results from the long term demand model have been published by NZ Transport Agency and NZIER. Of the
results that have been published, demand uncertainty is due mainly to price and income variations. Graphs that show a possible range
of demand for vehicle travel and public transport usage are reproduced below:
Public transport demand (stochastic estimate) Vehicle kilometres travelled (stochastic estimate)
Source: National Long-Term Land Transport Demand Model, NZIER and NZTA (2013)
25
The information provided by NZIER information provides an indication of structural trends and underlying demand pressures only,
and deliberately exclude policy/supply-side initiatives.
20EVIDENCE BASE: TRANSPORT SECTOR
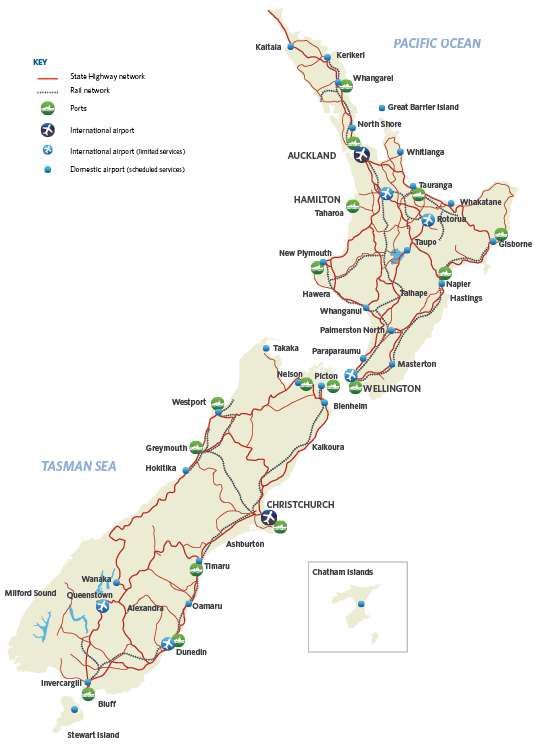
Notably, as our population ages in the downside scenario, the NZIER model shows an increase in public transport demand by the
elderly (and an increase in private vehicle usage for those who are ‘middle-aged’ – driven by relatively high income growth in this
scenario). The following graph demonstrates this concept:
Demand impacts by age distribution
Source: National Long-Term Land Transport Demand Model, NZIER and NZTA (2013)
21EVIDENCE BASE: TRANSPORT SECTOR
Sources
NZIER, Stephenson, J., & Zheng, L. (2013). National long-term land transport demand model (NZTA research report 520).
Richard Paling Consulting. (2008). National Freight Demands Study (commissioned by the Ministry of Transport).
Freight Information Gathering System Report (June 2013), Ministry of Transport.
Investing in a transport system to connect New Zealanders (6 December 2013), NZ Transport Agency Newsletter.
Industry Productivity Statistics 1978-2008 (2010), Statistics New Zealand.
Office of the Auditor General, Transport Report (2013).
Ministry of Transport, Transport Monitoring Indicator Framework.
NZ Productivity Commission, International Freight Transport Services Inquiry (April 2012).
TomTom Traffic Index (Q2 2013). www.tomtom.com/en_nz/trafficindex.
OECD Factbook 2013: Economic, Environmental and Social Statistics, OECD, www.oecd-ilibrary.org
Quarterly Outcomes Report (July-September 2013), NZ Transport Agency.
Quarterly Outcomes Report, (October - December 2013), NZ Transport Agency.
Global Competitiveness Report 2013/14, World Economic Forum.
Roading network data 2013, NZ Transport Agency, www.nzta.govt.nz/planning/data/networks.html.
Aviation Safety Summary (April-June 2013), Civil Aviation Authority, www.caa.govt.nz.
Tourism 2025 Analysis (2013), Tourism Industry Association.
Airport Information Disclosure (2013), Commerce Commission.
22You can also read