Plasmasphere and topside ionosphere reconstruction using METOP satellite data during geomagnetic storms
←
→
Page content transcription
If your browser does not render page correctly, please read the page content below
J. Space Weather Space Clim. 2021, 11, 5
Ó F.S. Prol et al., Published by EDP Sciences 2021
https://doi.org/10.1051/swsc/2020076
                                                                                                                                     Available online at:
                                                                                                                                    www.swsc-journal.org

    RESEARCH ARTICLE                                                                                                             OPEN          ACCESS

Plasmasphere and topside ionosphere reconstruction using
METOP satellite data during geomagnetic storms
Fabricio S. Prol1,*, Mohammed M. Hoque1, and Arthur A. Ferreira1,2
1
    Institute for Solar-Terrestrial Physics, German Aerospace Center (DLR), Kalkhorstweg 53, 17235 Neustrelitz, Germany
2
    Department of Electrical Engineering, Universidade de Brasília (UNB), 71910-900 Brasília, Brazil

              Received 20 July 2020 / Accepted 7 December 2020

              Abstract – As part of the space weather monitoring, the response of the ionosphere and plasmasphere to
              geomagnetic storms is typically under continuous supervision by operational services. Fortunately, Global
              Navigation Satellite System (GNSS) receivers on board low Earth orbit satellites provides a unique
              opportunity for developing image representations that can capture the global distribution of the electron
              density in the plasmasphere and topside ionosphere. Among the difficulties of plasmaspheric imaging based
              on GNSS measurements, the development of procedures to invert the total electron content (TEC) into elec-
              tron density distributions remains as a challenging task. In this study, a new tomographic reconstruction
              technique is presented to estimate the electron density from TEC data along the METOP (METeorological
              OPerational) satellites. The proposed method is evaluated during four geomagnetic storms to check the
              capabilities of the tomography for space weather monitoring. The investigation shows that the developed
              method can successfully capture and reconstruct well-known enhancement and decrease of electron density
              variabilities during storms. The comparison with in-situ electron densities has shown an improvement
              around 11% and a better description of plasma variabilities due to the storms compared to the background.
              Our study also reveals that the plasmasphere TEC contribution to ground-based TEC may vary 10–60%
              during geomagnetic storms, and the contribution tends to reduce during the storm-recovery phase.

              Keywords: space weather / algebraic reconstruction technique / constrained tomography / DMSP / St. Patrick day

1 Introduction                                                                        Many imaging systems have been developed in the past few
                                                                                  decades to describe the plasmasphere electron density
     The Earth’s plasmasphere is an ionized region of the                         (Gulyaeva et al., 2011; Katus et al., 2015). Most of the systems
atmosphere sensitive to the geomagnetic activity. During quiet                    rely on whistler data (Carpenter & Anderson, 1992), climatolog-
geomagnetic conditions, the plasmasphere is dominated by the                      ical models (Gallagher et al., 2000; Webb & Essex, 2000) and
dayside plasma that flows from the ionosphere upwards along                        in-situ observations (O’Brien & Moldwin, 2003; Huang et al.,
the magnetic field lines (Belehaki et al., 2004). This dayside                     2004; Liu et al., 2015; Zhelavskaya et al., 2017). More recently,
ionospheric filling in the presence of the Earth’s rotation pro-                   the Global Navigation Satellite System (GNSS) has provided a
duces a quite large torus of cold plasma, which becomes quite                     unique opportunity to observe the electron density of the plas-
disturbed during active geomagnetic conditions. Numerous                          masphere with global and continuous coverage. Considerable
studies have analyzed the disturbed plasmasphere with particu-                    progress using GNSS observations has been achieved to repre-
lar interest in the internal dynamics (Singh et al., 2011), bound-                sent the plasmasphere in Vertical TEC (VTEC) maps projected
aries (Verbanac et al., 2015; Heilig & Lühr, 2018), erosion                       on a thin shell located at a specific altitude above the Earth’s
by enhanced magnetospheric convection (Carpenter, 1970;                           surface (Chen et al., 2017). The developed VTEC calculations
Zhelavskaya et al., 2017) and coupling processes with the mag-                    are useful tools for applications concerned with the horizontal
netosphere (Borovsky & Valdivia, 2018) and ionosphere                             morphology of the plasmasphere; however, since the GNSS
(Pierrard & Voiculescu, 2011). However, the electron density                      signal travels at large altitude regions through the plasmasphere,
description during active geomagnetic conditions is still a rele-                 tomographic algorithms allow the extraction of the vertical
vant challenge for any imaging systems aiming describing the                      distribution, i.e., the exponential decay of the electron density
plasmasphere dynamics and structure.                                              with the increasing altitude.
                                                                                      Tomographic reconstruction techniques are widely applica-
*
    Corresponding author: Fabricio.DosSantosProl@dlr.de                           ble approaches to solve inverse problems and estimate the

     This is an Open Access article distributed under the terms of the Creative Commons Attribution License (https://creativecommons.org/licenses/by/4.0),
                  which permits unrestricted use, distribution, and reproduction in any medium, provided the original work is properly cited.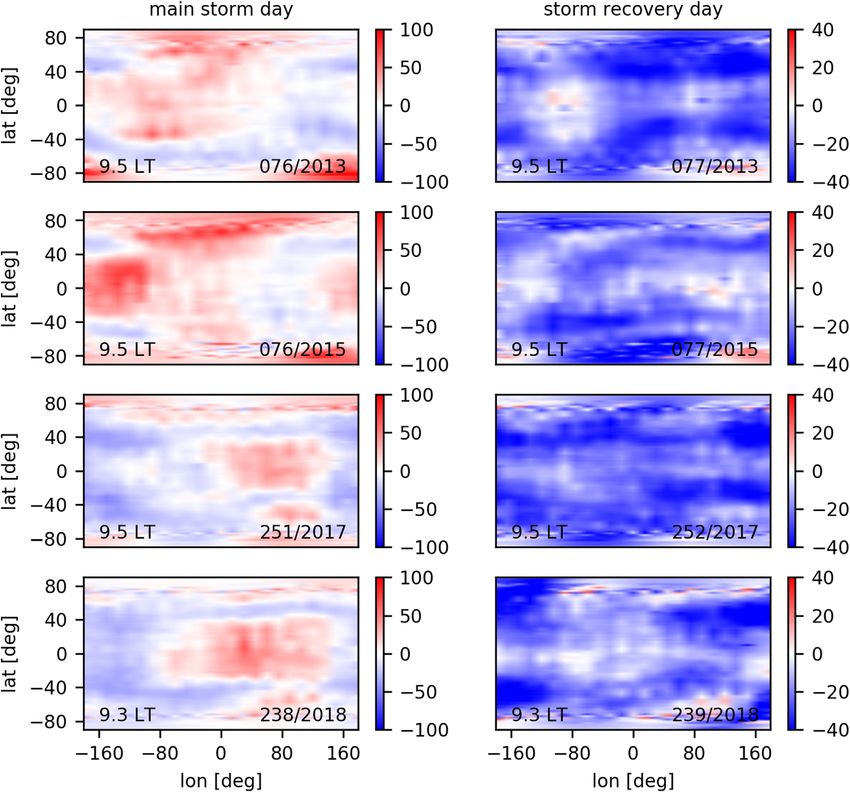
F.S. Prol et al.: J. Space Weather Space Clim. 2021, 11, 5

electron density based on TEC measurements. Despite the plas-         to perform the tomographic reconstruction. The METOP TEC
masphere can contribute about 10–60% in the ground TEC                data were processed by the University Corporation for
measurements (up to GNSS height at 20,000 km), a few                  Atmospheric Research (UCAR) and obtained through the
approaches were specifically developed to perform tomographic          COSMIC Data Analysis and Archive Center (CDAAC) via
reconstruction in the region. Main difficulties are related to the     the portal http://cdaacwww.cosmic.ucar.edu/. A detailed review
low number of available satellites that can provide TEC obser-        of the TEC estimation procedure as well as its quality evaluation
vations, requiring severe underconstrained methods. Early stud-       is provided by Yue et al. (2011). All measurements with nega-
ies using tomographic reconstructions and satellite-based TEC         tive TEC values were neglected in the reconstructions. A cut-off
observations are given by Rius et al. (1997) and Hajj et al.          elevation mask of 20° was defined. For the performance assess-
(2000). Later, Heise et al. (2002) developed a technique which        ment of the reconstructed images, the DMSP electron density
provides electron density estimations of 2D meridional cross-         (Ne) data were used as reference values. The Ne measurements
sections of each orbit plane of the CHAMP (Challenging                were processed by the Center for Space Sciences at the Univer-
Minisatellite Payload) satellite. Gerzen et al. (2015) evaluated      sity of Texas (Dallas) and obtained through the Madrigal portal
the accuracy of these CHAMP reconstructions against                   at http://cedar.openmadrigal.org/. A statistical review of the
IMAGE/RPI (Radio Plasmas Imager) data, showing improve-               DMSP Ne quality is provided by Garner et al. (2010). GIMs
ments in comparison to the model used as the background.              were used to compute the VTEC contribution of the plasmas-
Spencer & Mitchell (2011) had also proposed a tomographic             phere under geomagnetic storm events by comparing the ground
algorithm of the plasmasphere, in which they assumed the              TEC data with the onboard LEO data. The maps released by the
electron distribution as constant along the Earth’s magnetic field     Jet Propulsion Laboratory (JPL) were obtained at https://
lines in the lower plasmasphere. Spencer & Mitchell (2011)            cdaweb.gsfc.nasa.gov/pub/data/gps/ with a spatial resolution
used data of the Constellation Observing System for Meteorol-         of 5° longitude  2.5° latitude and a temporal resolution of
ogy, Ionosphere, and Climate/Formosa Satellite Mission 3              2 h. JPL products provide smoother solutions in comparison
(COSMIC/FORMOSAT-3) and Pinto Jayawardena et al.                      to products with higher temporal resolution. The obtained
(2016) have shown this method as an efficient tool to correctly        tomographic reconstructions also provide smooth VTEC distri-
represent some trends and patterns of plasmaspheric TEC distri-       butions due to the used regularization process, so that, the JPL
butions during quiet geomagnetic conditions. Another method           distributions were selected in order to provide more uniform
was developed by Wu et al. (2015) based on a 3DVar approach,          VTEC ratios.
which has presented a general improvement in comparison to                 Four weeks were chosen for probing the capabilities of the
the global core plasma model (GCPM) when performing an                developed tomographic method during geomagnetic storm
internal quality check.                                               conditions. Figure 1 shows the Dst and Kp values during the
    In this work, a new tomographic reconstruction method has         four space weather events selected during the solar cycle 24.
been developed to describe the plasmasphere using METOP               The two first events are related to the St. Patrick storms of
(METeorological OPerational) data. In comparison to previous          2013 and 2015 and the two last events are related to 2017
methods, our developed method is the first based on a single           and 2018, where very low Dst values were observed during
METOP satellite and we are imposing a set of new constraints          all events. Based on the Kp index, the storms can be classified
into the Simultaneous Iterative Reconstruction Technique              as strong G3 (2013), severe G4 (2015), severe G4 (2017) and
(SIRT) (Pryse & Kersley, 1992). Previous methods were                 strong G3 (2018).
applied in quiet conditions; however, the main goal here is to
present the potential of the proposed tomographic reconstruction
for space weather monitoring during geomagnetic storms. In            3 Tomographic reconstruction
this direction, a total of four space weather events of the last        of the plasmasphere
solar cycle 24 were chosen. As input observations, we have
used GNSS TEC data from METOP satellite. Since the satellite
is flying at about 800 km, the topside TEC data already                    The basic quantity required to perform plasmaspheric
excludes a significant part of ionospheric contribution below          tomography based on GNSS data is the total electron content
the low Earth orbit (LEO). In-situ electron density observations      (TEC). Typically, TEC is defined as the integral of the electron
from the Defense Meteorological Satellite Program (DMSP)              density (Ne) along the path between the GNSS satellite and the
were used as reference for validation purposes. Section 2 shows       receiving antenna, in a column with cross-sectional area of
more details about the dataset. Section 3 presents the mathemat-      1 m2. In tomographic applications, however, the plasmasphere,
ical formulation of the developed method. Section 4 shows the         or the ionosphere, is broken down into a 3D grid of numerous
experimental results and Section 5 presents the conclusions.          cells (voxels) and TEC is approximated by a finite sum. It can
                                                                      be written as:
                                                                                                     XJ

2 Dataset                                                                                    TECi ¼     Nej d ij                  ð1Þ
                                                                                                      j¼1

    Three primary datasets were used in this study: GNSS TEC          where Nej is the electron density in el/m3 for a cell j and dij is
data observed from METOP satellite, electron density measure-         the path length in meters of each signal i inside the boundaries
ments from DMSP satellite, and ground-based VTEC data from            of the voxels.
global ionospheric maps (GIMs). TEC measurements from the                 The main goal of tomography is to estimate the electron
dual-frequency GNSS precise orbit determination (POD) recei-          density Ne based on TEC measurements. In this sense, a tomo-
vers of METOP-A satellite were used as the main observations          graphic system is created as below:

                                                             Page 2 of 12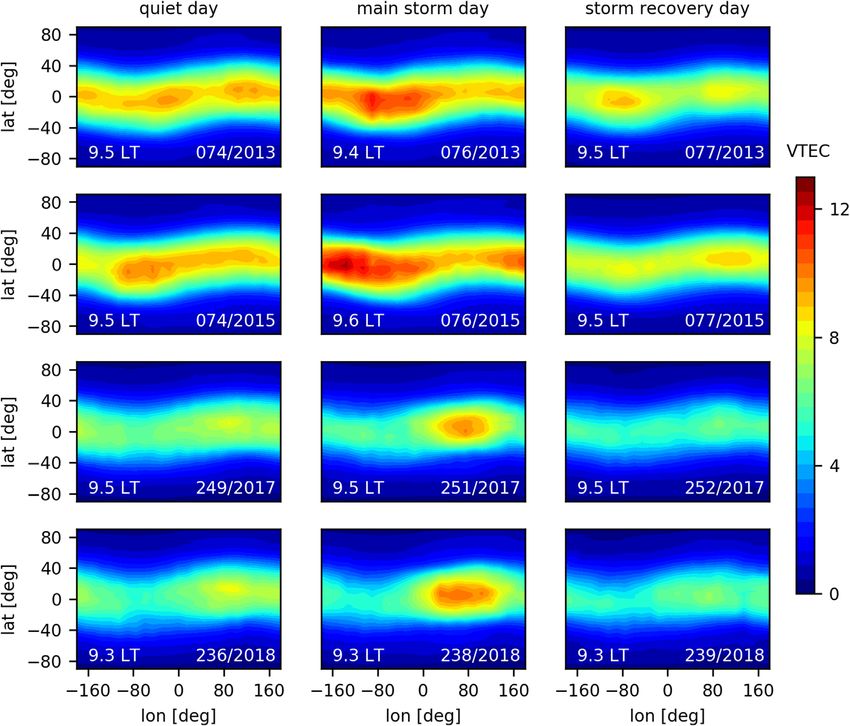
F.S. Prol et al.: J. Space Weather Space Clim. 2021, 11, 5

Fig. 1. Dst and Kp values observed in the selected storm events. Indices values were obtained from the OMNI data set provided by the
Goddard Space Flight Center.

                          y ¼ Ax þ                           ð2Þ     NTCM, NPDM, NPHM and NPSM provide a good estimate
                                                                      of the main features of the ionosphere and plasmasphere in
where y is a TEC vector of observations, x is the unknown             terms of local time, geographic/geomagnetic location, solar
vector of electron density, A is the design matrix composed           irradiance and solar activity.
of the path lengths inside the boundaries of the voxels, and               After defining the background, the tomographic reconstruc-
 consists of the measurement noises.                                 tion is performed using a 3D grid specifically built to fit into the
     The solution of equation (2) involves many unknowns.             orbital geometry of the METOP satellite. Figure 2, for instance,
In the case of high vertical resolutions, the problem is also         shows the coverage of the METOP-A satellite for day of year
ill-conditioned due to the limited number of GNSS viewing             (DOY) 076 of 2013. Our investigations shows that when
angles. To overcome this, a priori estimate is required as an         superimposing METOP data collected during the rising (or
initial solution known as a background. The background is             setting) orbit phase for an entire day, the measurements covers
usually obtained from a climatological model to fill in each           the entire globe with a very repetitive pattern in terms of local
voxel of the grid. Then, the final solution is obtained based          time (LT). This means that the local time of the observations
on the distribution of the difference between the background          repeats approximately at the same latitude for each revolution.
TEC and the observed TEC into the resulting grid.                     In this regard, it is possible to superimpose the TEC data of
     In this study, the background was obtained from a family of      the entire day and represent the system geometry with two
electron density models developed at the German Aerospace             3D grids: one for satellite rising phase and another for setting
Center (DLR) in Neustrelitz. They are named Neustrelitz TEC           phase.
Model (NTCM) (Jakowski et al., 2011), Neustrelitz Peak                     Both grids were defined with a temporal resolution of 1 day
Density Model (NPDM) (Hoque & Jakowski, 2011), Neustrelitz            in order to cover the entire globe. The horizontal resolution of
Peak Height Model (NPHM) (Hoque & Jakowski, 2012) and                 the 3D grids was defined as 2°  15° in latitude and longitude,
Neustrelitz Plasmasphere Model (NPSM) (Jakowski & Hoque,              respectively, with a vertical resolution of 50 km, ranging from
2018). The models are driven by the solar radio flux index             800 to 20,000 km in order to cover the entire trajectory of the
F10.7 and a Chapman layer to describe the basic structure of          GNSS signals. The low longitude resolution of 15° was defined
the ionosphere and plasmasphere. The plasmasphere model               due to the longitudinal gaps between each METOP revolution,
(in this case NPSM) is superposed to the topside of the               but the 15° resolution was enough to guarantee a reasonable
Chapman layer. Using such an approach we have introduced              level of intersections between signals from distinct orbital
required variability in the topside scale height as a function of     revolutions. A total of 880,425 cells are then created for each
height, since it is an important point to be considered in            satellite revolution scenario.
Chapman layers, as demonstrated by (Olivares-Pulido et al.,                Given the high amount of unknowns to cover the large
2016). Despite a small number of coefficients and parameters,          region of the plasmasphere, a relatively light solution is required

                                                             Page 3 of 12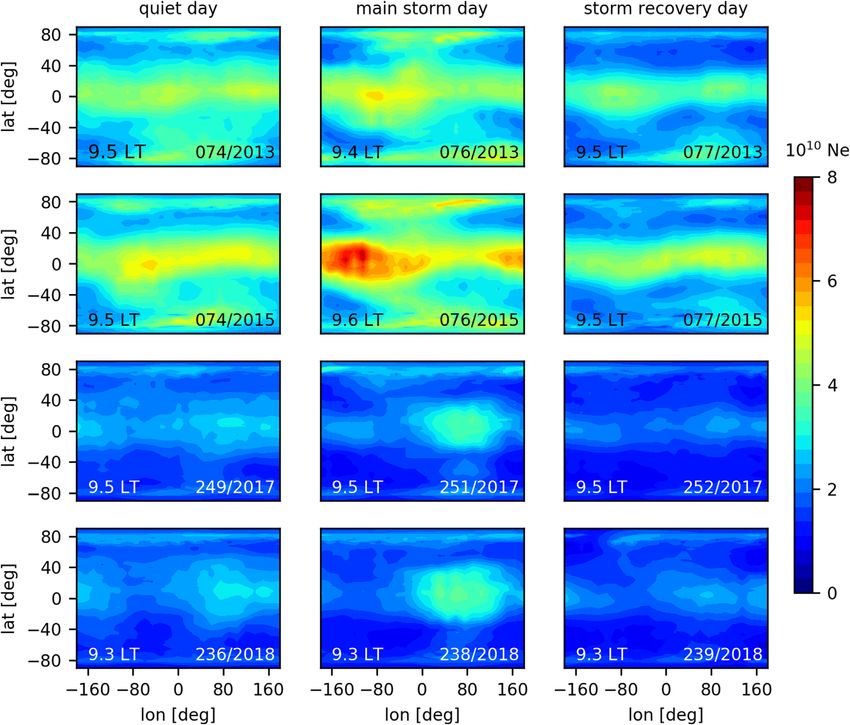
F.S. Prol et al.: J. Space Weather Space Clim. 2021, 11, 5

Fig. 2. METOP-A orbit footprints for DOY 076 of 2013 in terms of latitude, longitude and local time. Left panel shows the satellite rising
phase and the right panel shows the setting phase. The unit of the color bar is local time.

to solve the equation (2), such as the Algebraic Reconstruction                      As reported in previous studies (Hobiger et al., 2008; Wen
Technique (ART) (Austen et al., 1988). ART is defined as a                        et al., 2010; Norberg et al., 2018), the use of constrained
basis for the developed approach since it is very efficient for                   methods can efficiently stabilize the ill-conditioned solution in
providing fast updates of the tomographic system. ART is based                   the presence of noises at altitudes of the ionosphere, from
on the following iteration process:                                              50 to 2000 km. In addition, constrained methods can reduce
                                                                                 excessive dependence on the background information, which
                                         P
                                         N
                                                                                 helps to detect local and regional structures that are missing
                                  yi              Aij xkj
                                             j                                   in the climatological models. The region of interest now, how-
                 xkþ1 ¼ xkj þ c                              Aij         ð3Þ     ever, is much larger and composed by very few electron densi-
                  j
                                     P
                                     N
                                                 A2ij                            ties at high altitudes. Any small TEC error or mismodelling
                                         j                                       given by the background can effectively introduce artifacts in
where c is a relaxing parameter, yi is the ith TEC observation,                  the reconstruction at high altitude regions. In order to stabilize
Aij is the value of the corresponding i and j position in the A                  the ill-conditioned geometry, the proposed algorithm employs
matrix, x0j is the electron density given by the background, xkj                 a significant dependence on the background specifications in
is the electron density at iteration k obtained after each update.               regions with very low electron density. This is performed using
Typically, ART produces minimum residuals after a few                            the following relaxing parameter:
iterations, however the final solution is unlikelly to be stable                                        cij ¼ 0:2ðx0j =x0max Þw/m                 ð4Þ
due to the poor observation geometry. In order to stabilize
the tomographic reconstruction, three main adaptations were                      where x0j is the background electron density at cell j and x0max
used: (1) a simultaneous approach; (2) incorporation of VTEC                     is the maximum electron density of the background in signal i.
values; and (3) a set of contraints.                                             Differently from equation (3), c varies with each signal i and
     ART updates the electron density voxels after each TEC                      voxel j and, now, the incorporation of the ratio (x0j =x0max ) keeps
observation is analyzed. This approach is affected by the way                    the profile shape of the final iteration very similar to the pat-
the observation vector is sorted. To overcome this problem,                      terns provided by the background, mainly when the electron
the Simultaneous Iterative Reconstruction Technique (SIRT)                       density x0j is very small. Similar constant values of 0.2 were
(Pryse & Kersley, 1992) is used in this work, where the final                     adopted by Pryse et al. (1998) and Prol et al. (2018) to guar-
image is obtained by taking the average correction after the                     antee a certain control in the iteration convergence. The
                  P
differences y i  Nj Aij xkj of all i signals have been computed.                weight w/m is a factor dependent on the geomagnetic latitude,
     In addition to slant TEC, VTEC values are included as                       and its use allows a reconstruction which relies more on the
observations. Two values were therefore used in the iterative                    background in the high-latitudes. The weighting factor is
reconstruction: the slant TEC, related to the voxels of the real                 defined as:
                                                                                                       w/m ¼ 1 þ sin2 ð/m Þ                       ð5Þ
GNSS observation geometry, and the vertical TEC, related to
the vertical column of voxels above and below the pierce points.                 where /m is the geomagnetic latitude.
As pointed out by Prol et al. (2019), the combination of VTEC                        It is worthy to mention that a similar regularization than
and slant TEC is viable to increase the number of voxels with                    proposed by Heise et al. (2002) is used for voxels without
TEC measurements without significantly affecting the slant                        any ray passing through. Three gaussian functions are used to
TEC estimations. The mapping function developed by Foelsche                      determine the amount of influence to the nearby voxels, where
& Kirchengast (2002) is used in this study, with a single-shell                  two equations are used to control the horizontal variability and
height of 1300 km, since it has demostrated better results in                    the third one is used to keep the general characteristics of the
the recent study by Zhong et al. (2016).                                         vertical structure of the background. The Gaussian half widths

                                                                        Page 4 of 12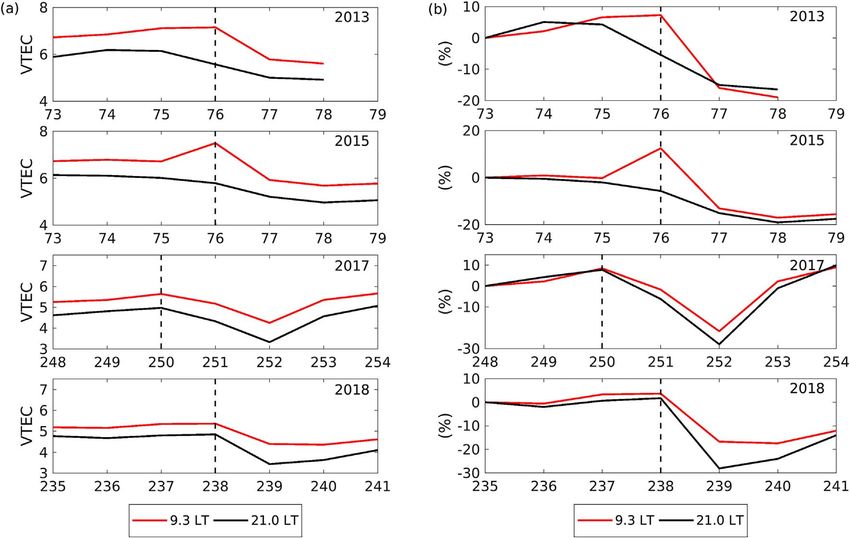
F.S. Prol et al.: J. Space Weather Space Clim. 2021, 11, 5

Fig. 3. Comparison between VTEC maps obtained with the developed tomography, background, and used METOP observations (DOY 076/
2015). Images of the top panel are related to the METOP orbit rising phase and in bottom panel are related to the METOP orbit setting phase.
The unit of the color bar is TECU.

Fig. 4. Daily VTEC maps above LEO orbit height during analyzed storm days obtained with tomographic reconstruction based on METOP
TEC measurements during satellite rising. The unit of the color bar is TECU and the given LT hour is computed in the equatorial region.

                                                               Page 5 of 12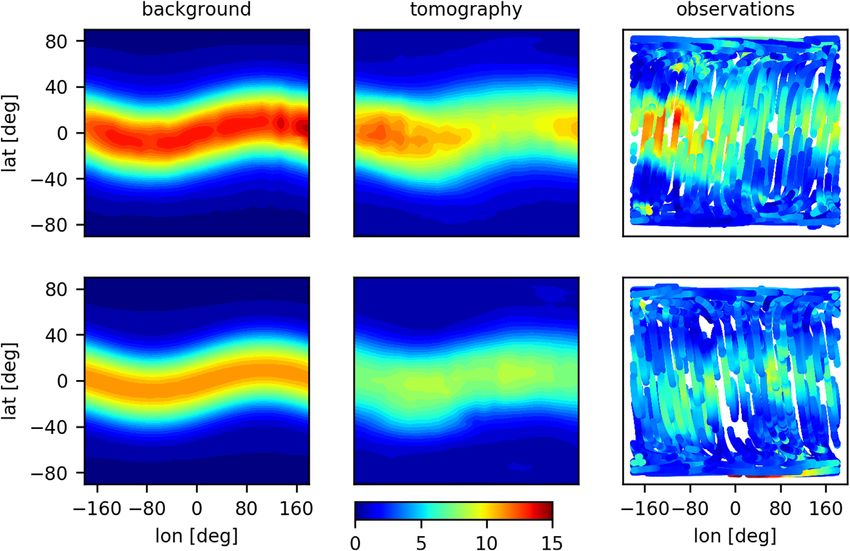
F.S. Prol et al.: J. Space Weather Space Clim. 2021, 11, 5

Fig. 5. Electron density distributions at height 800 km for analyzed storms obtained by tomographic reconstruction using METOP during
satellite rising. The unit of the color bar is el/m3 and the given LT hour is computed in the equatorial region.

are taken as r/ = 7° and rk = 21° along the latitude and longi-         represent corresponding VTEC maps during the setting phase.
tude direction, respectively.                                           The rising phase occurred during the daytime around 9.5 h LT
     In comparison to previous methods (Heise et al., 2002;             where the setting phase occurred around 21 LT, explaining the
Spencer & Mitchell, 2011; Wu et al., 2015), the proposed                high level of ionization in the top panels. Despite the
method has the following new features: (1) it uses observations         background is quite constant along the longitudinal VTEC
only from single METOP satellites; (2) it performs tomographic          distributions, there are specific variabilities that tomography
reconstruction using two 3D grids distributed in local times for        has correctly updated, such as the larger TEC values in the
rising and setting phase of the satellite orbit; (3) it imposes a set   west-sector (180 to 0) and smaller TEC values in the east-
of new constraints into SIRT; and (4) the number of signal              sector (0–180) especially during the rising scenario. These results
cross-sections are increased since we include a whole day of            indicate that the developed algorithm is not so constrained to the
data. Despite 3D grids are provided, our method was not                 background and capable to capture the general distributions of
developed to show the 3D distribution every hour. We can only           the observations, mainly at low- and mid-latitude regions.
show the global distributions of the fixed local times related to            To investigate the capability of the developed method for
the rising and setting hours of the single METOP satellite.             capturing plasmaspheric and ionospheric responses to the geo-
                                                                        magnetic storms, Figure 4 shows the tomographic results in
                                                                        terms of VTEC maps above LEO orbit height (up to GNSS
                                                                        satellite height) during selected space weather events. For com-
4 Results and discussions                                               parisons, the VTEC images are given during a quiet day, the
4.1 Tomographic responses to geomagnetic storms                         day when the main phase of the storm has perturbed the plasma-
                                                                        sphere and the day after the main phase. The geometrical posi-
    Figure 3 demonstrates how well the developed tomography is          tions of the satellite are related to the rising phase of the
adapting to the spatial distribution of the observations. Images of     MTEOP-A, where TEC observations were taken around 9 h
the top panels represent VTEC maps during the rising phase of           LT in the low-latitude region of the plasmasphere. In general,
the METOP-A satellite and images in the bottom panel                    the ionization is enhanced during the main phase of the storm

                                                                Page 6 of 12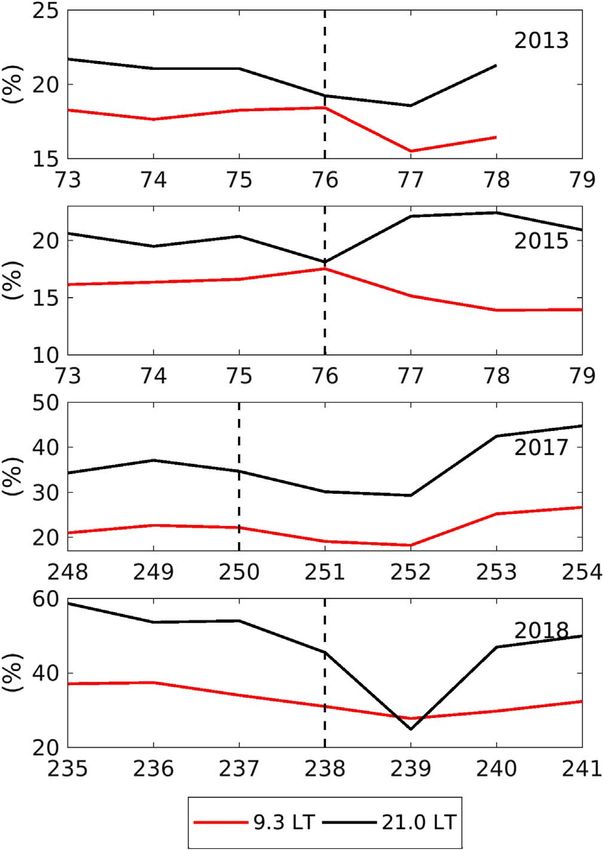
F.S. Prol et al.: J. Space Weather Space Clim. 2021, 11, 5

Fig. 6. Percentage of enhancement of the electron density at 800 km during the days of the storm in comparison to quiet days (74/2013, 74/
2015, 249/2017 and 236/2018). Units of the color bars are given in percentage.

and significantly reduced in the day during the recovery phase.         explain that the TEC enhancement in the ionosphere during
This indicates a positive and negative TEC bias compared to            storm involves the increases in the oxygen density, changes in
quiet day values. It is worthy to mention that the background          the meridional winds, intensification of eastward electric fields,
TEC maps during the storm phases are very similar to each              traveling ionospheric disturbances and penetration of electric
other since the background is mainly driven by the F10.7 index         fields. Negative biases are suggested to be caused by changes
and not geomagnetic or disturbance indices. However, the               in neutral composition associated with the decrease in the
tomography has represented a subtle daily variation due to the         O/N2 density ratio. In the case of the plasmasphere, however,
geomagnetic events, meaning that the developed technique is            the ionospheric TEC variabilities are not a direct factor, but
capable of updating the background for displaying positive             act as a precursor to the enhancement or decreasing of the
and negative TEC bias during the storm events. Additionally,           dayside ionospheric filling related to the Earth’s rotation. Addi-
we can observe longitudinal asymmetries in the reconstructions.        tionally, Lemaire et al. (2005) demonstrated the role of the Ring
They can be related to several reasons, such as: (1) the irregular     Current betatron mechanism for up-lifting the altitudes of the
geometrical distribution of TEC observations, (2) daily variabil-      mirrors points and guiding centers of all ionospheric and
ities of the solar ionization, (3) longitudinal variations of the      magnetospheric particles when the equatorial magnetic field
zonal electric field and (4) distinct ionization level due to the       intensity decreases during the main phase of geomagnetic
geomagnetic field configuration, i.e. magnetic declination, mag-         storms. Conversely, during storm recovery phases, the geomag-
netic field strength, and displacement of the geographic and            netic betatron mechanism moves the mirror points of all charged
magnetic equators (Kil et al., 2011).                                  particles downwards back into the denser layers of the atmo-
     The positive and negative variabilities presented here            sphere. These upward and downward motions of ionospheric
corroborates to previous studies, when analyzing the same              ions and electrons contribute respectively to the positive and
events of the ionosphere (Astafyeva et al., 2015; Fagundes             the negative variation of the ionization density observed during
et al., 2016; Yue et al., 2016; Krypiak-Gregorczyk, 2019).             geomagnetic storms in the topside ionosphere. During the
These studies, together with the work of Sharma et al. (2011),         successive main and recovery phases the kinetic energy of all

                                                              Page 7 of 12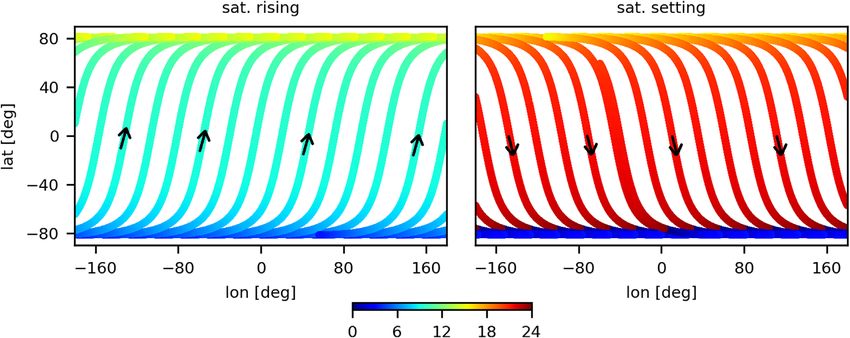
F.S. Prol et al.: J. Space Weather Space Clim. 2021, 11, 5

Fig. 7. (a) Daily average of the VTEC derived from the tomography method at 9.3 and 21.0 LT. The average was computed based on data
between 40° S and 40° N latitude. METOP data was missing to perform reconstructions at DOY 79/2013. (b) VTEC percentage relative to the
first day of the time series, considered here as a quiet day (low Kp values). The dashed lines indicate the day of the storm onset. The VTEC unit
is given in TECU.

charged particles is decreasing and increasing, as a result of the        4.2 Plasmaspheric contribution to ground-based TEC
betatron mechanism which has been called the LBS mechanism,
according to the initials of the authors who pointed it out. The              In order to assess the percentage contribution of the plasma-
LBS betatron mechanism adds on top of the various other geo-              spheric VTEC to the total VTEC observed from ground sta-
physical mechanisms proposed previously for accounting of                 tions, daily mean VTEC values obtained from ground-based
positive and negative ionospheric storm effects of the analyzed           GIMs. For each storm event, a daily mean VTEC value of
storms.                                                                   two different local times (9.3 and 21.0 LT) corresponding to
     Figure 5 shows similar images as Figure 4, but the recon-            the satellite raising and setting passages is computed. Figure 7
structed maps are now showing the electron density at 800 km              presents the evolution of the mean VTEC derived from the
height. Figure 4 shows signatures of enhanced ionization at               tomographic method during the period under investigation in
high-latitudes regions especially during the Saint Patrick storm          absolute values (Fig. 7a) and its percentage variation relative
days although corresponding VTEC maps in Figure 4 (main                   to a quiet day (Fig. 7b). The global mean VTEC value was
storm day at high-latitudes) do not show such enhancement.                computed for each day considering latitudes between 40° S
After the main storm phase, we can observe the negative bias              and 40° N. One can note that the model is capable capturing
related to the recovery phase. Similar analyses have been pro-            the daily variations of the quiet plasmasphere (first three days
vided by numerous previous studies (Astafyeva et al., 2015;               of each week) and also the VTEC depletion after the geomag-
Fagundes et al., 2016; Yue et al., 2016; Krypiak-Gregorczyk,              netic storms (last three days of each week).
2019). Our investigation, however, shows that the storm signa-                In order to determine the daily mean percentage contribution
tures at high-latitudes are more evident in the electron density          of the plasmasphere, the global mean plasmaspheric VTEC
level than those in VTEC level.                                           from tomography is then divided by the global mean JPL
     A clear indication of the positive and negative biases is            GIM VTEC. It is important to highlight that since the GIMs
provided by Figure 6. This figure shows the percentage of                  and plasmaspheric model present different spatial and temporal
enhancement of the electron density in comparison to quiet                resolution, a bilinear interpolation in time and space of the
days, defined here as DOYs 74/2013, 74/2015, 249/2017 and                  GIMs has been performed. Figure 8 shows the evolution of
236/2018. It is noticeable that the positive bias can lead to             the mean percentage contribution of the plasmaspheric VTEC
general electron density enhancements of 50–80% at all                    in comparison to the global VTEC values derived from the
latitudes, depending on the solar activity, while there is a major-       JPL GIMs. As expected, comparing plots at 9.3 and 21 LT
ity of negative bias in the recovery phase, reaching 40% dur-            we see that the plasmasphere contribution is higher during the
ing the daytime especially at mid- and high-latitudes.                    nighttime hour in comparison to the day time hour. During

                                                                 Page 8 of 12
F.S. Prol et al.: J. Space Weather Space Clim. 2021, 11, 5
daytime, the ionospheric electron content is rapidly enhanced
due to the increasing of solar radiation, therefore reducing the
percentage contribution of the plasmasphere. At night, the
ionospheric electron content decreases considerably in one hand
due to the absence of photo ionization on the other hand due to
ongoing recombination (of free ions and electrons) and transport
processes. Therefore, the percentage contribution of the
plasmaspheric TEC to the GIM TEC is increased (Chen &
Yao, 2015). In addition, one can note that the percentage
contribution of the plasmaspheric TEC increases from 2013 to
2018. This is expected, since during the descending phase of
the solar cycle the ionospheric TEC is reduced more than the
plasmaspheric TEC.
The presented analysis shows that the contribution of the
plasmaspheric electron content to GPS TEC is in agreement
with previous investigations suggesting that ground-based
VTEC values may be impacted from about 10% up to 60%
during the daytime and nighttime, respectively (Yizengaw
et al., 2008; Chen & Yao, 2015). Figure 8 also shows that this
contribution is considerably deviated during geomagnetic
events. Indeed, one can note in all the investigated events
that the mean percentage contribution of the plasmaspheric
VTEC to the GIMs VTEC tends to reduce on the day following
the main phase of the storm. The absolute values of the
plasmaspheric VTEC (Fig. 7a) are likely reduced on the day fol-
lowing the storm onset due to the reduced plasma supply form
the ionosphere (Cherniak et al., 2014). After the ionospheric
recovery, the plasmasphere density starts to slowly rise and
present an plasmaspheric contribution enhancement, such as
shown in DOYs 78/2013, 253/2017 and 240/2018. These
patterns are observed at 9.3 and 21.0 LT, except for the
St. Patrick’s Day event of 2015. This is a more intense storm,
with extreme lower Dst values during prolonged time. As result, Fig. 8. Percentage contribution of the plasmaspheric VTEC to the
we observe prolonged time with lower plasmasphere contribu- global VTEC derived from the JPL GIMs for 9.3 and 21.0 LT. The
tion in the daytime (9.3 LT), which is referred to a long period dashed lines indicate the day of the storm onset.
with reduced plasma supply form the ionosphere. During the
nighttime of 2015, an enhancement of the percentage contribu-
tion on the day right after the storm main phase occurs due to a few minutes are spent in the equatorial region, which creates
strong decrease on the global JPL GIM TEC mean, whereas the near straight line of high ionization in the graphs.
global plasmaspheric TEC mean reduces slightly. The white line of Figure 9 indicates the beginning of each
corresponding storm. We can see slight enhancements of the
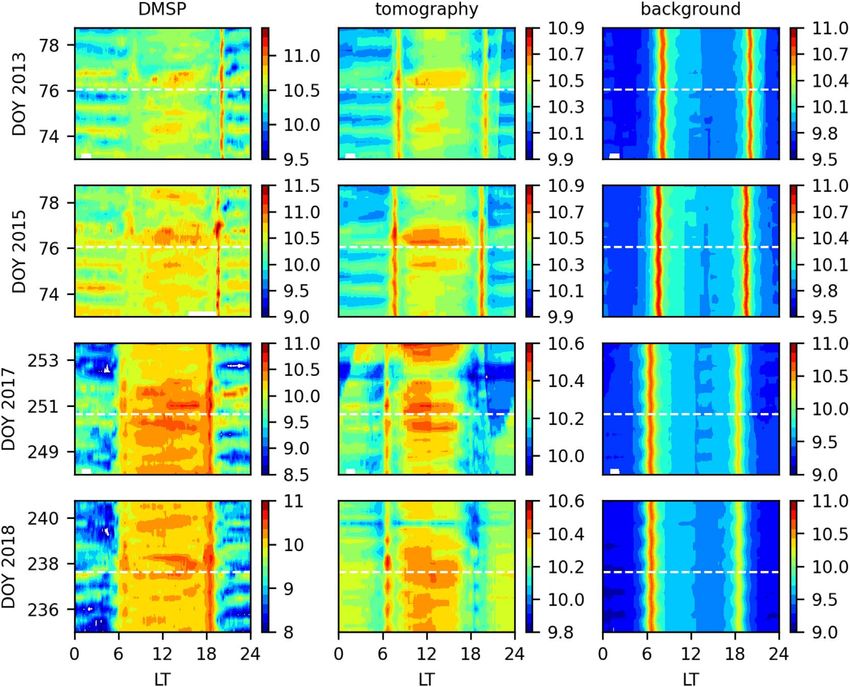
4.3 Comparison with DMSP electron density data DMSP in-situ electron density measurements after the begin-
ning of the four storms. Qualitatively, Figure 9 shows that
In order to evaluate the retrieved tomographic images using tomography does an excellent job at replicating DMSP in-situ
DMSP data as reference, we present in Figure 9 six-hour electron density and capturing enhanced structures after the
averages of electron density values from DMSP, tomography storm trigger, especially considering that the background was
and background. For better visualization, the units are given the initial point. The background underestimates the electron
in log(Ne) and the color bar scales are not fixed. DMSP-18 density at middle- and high-latitudes and overestimates the
was selected for years 2013 and 2015, and DMSP-17 was nighttime equatorial region. It can be seen a great agreement
selected for years 2017 and 2018. Such satellite numbers were of the tomography to represent almost all hours and not only
selected because their orbit is relatively coincident with the during the storm events. The total RMSE considering all DOYs
METOP orbits in the selected days. Indeed, the DMSP satellite was 1.96 and 2.20 el/m3 for tomography and background,
geometry is very repetitive through the corresponding days. For respectively. Therefore, the RMSE has revealed a general
the days used in the assessment, DMSP satellites are located improvement of about 11% by the developed tomography. A
near middle- and high-latitudes of the southern hemisphere at major problem, however, was found to represent the equatorial
0 h LT. The nighttime equator measurements are taken around region in the dusk (18 LT). As shown in Figure 3, the back-
03 h LT. Several measurements are observed between 06 and ground VTEC maps are presenting higher values in comparison
12 LT in the middle- and high-latitudes of the northern to the METOP TEC observations at low-latitudes. On the
hemisphere. Measurements between 18 and 24 h LT are referred contrary, as shown in Figure 9, the background electron density
to the southern hemisphere. Due to the orbit geometry, just a is lower than the DMSP values for the same instances and
Page 9 of 12F.S. Prol et al.: J. Space Weather Space Clim. 2021, 11, 5
Fig. 9. Electron density distributions of DMSP, tomography and background in terms of local time and days of year. White line indicates the
beginning of the corresponding storm. DMSP-18 was selected for years 2013 and 2015 and DMSP-17 was selected for years 2017 and 2018.
Color scale varies within each plot to adapt to a better visualization of the spatial distributions. Units of color bar are in log(Ne) with base 10.
locations. Since the electron density given by tomography is proposed. Although we have imposed strict constraints in the
adapting to the METOP TEC observations, the tomographic re- developed tomographic algorithm, the proposed method was
sults in the daytime equator are further underestimated when capable to adapt well to the input TEC observations and
compared to DMSP. A plausible explanation is a misspecifica- describe the electron densities during geomagnetic storms. We
tion of the background to describe the shape of the profiles of have checked maximum electron density enhancements around
the topside ionosphere and plasmasphere. Indeed, the electron 80% in comparison to quiet days and minimum negative bias
density at DMSP orbit high can be larger than the background around 40% in the recovery phase. In comparison to
while the METOP TEC presents lower values. The real electron ground-based VTEC, the results suggested that the plasmas-
density profile is likely uplifted in comparison to the back- pheric VTEC contribution may vary during geomagnetic events,
ground profile, despite the lower TEC from the real profile. tending to reduce during the day following the Dst minima.
At the dusk instances, the well-known pre-reverse enhancement A slow plasmaspheric contribution enhancement then occurs
of the ionosphere (Prol et al., 2019) intensifies the vertical drift after the ionospheric recovery due to the increased plasma sup-
of the equatorial ionosphere upward due to the resultant force of ply. In general, the tomographic method allowed verifying that
the electric field, increasing the peak height and displacing the the averaged plasmasphere VTEC contribution can vary from
plasma to higher altitudes. This strong upward vertical drift dur- 10% to 60% in geomagnetic storm conditions. Additionally,
ing the evening pre-reversal enhancement is difficult to be cap- the tomographic method was capable at replicating DMSP
tured by any climatological model due to its relatively small in-situ electron density and capturing enhanced structures after
spatial and temporal scales, which makes reasonable to obtain the storm trigger, revealing a general improvement of about
errors at such specific instants. 11% in comparison to background specifications. The proposed
methodology, therefore, contributes to the few attempts to per-
form tomographic estimations in order to use METOP data and
describe the electron density of such a large region as the plas-
5 Conclusions masphere during geomagnetic storms. In future, a key point
would be to improve background representations, mainly
A tomographic technique to reconstruct the electron density regarding to the shape of the electron densities, since major
based on TEC measurements of the METOP satellites is problems were identified at the dusk period in the equatorial
Page 10 of 12F.S. Prol et al.: J. Space Weather Space Clim. 2021, 11, 5
region, when typical vertical drifts of the ionosphere are effec- its performance. Geophys Res Lett 29: 111-1–111-4. https://doi.org/
tive to produce an intensified ionization at the altitudes of the 10.1029/2001GL013744.
DMSP orbit. Gallagher DL, Craven PD, Comfort RH. 2000. Global core plasma
model. J Geophys Res Space Phys 105: 18819–18833. https://doi.
Acknowledgements. The authors would like to thank the org/10.1029/1999JA000241.
University Corporation for Atmospheric Research, Boulder, Garner TW, Taylor BT, Gaussiran TL II, Coley WR, Hairston MR,
CO, USA, and European Space Agency, for providing Rich FJ. 2010. Statistical behavior of the topside electron density
METOP TEC data (http://cdaac-www.cosmic.ucar.edu/). They as determined from DMSP observations: A probabilistic climatol-
would also like to thank the developers of the Defense Mete- ogy. J Geophys Res Space Phys 115: A07306. https://doi.org/
orological Satellite Program (DMSP), in which data was gath- 10.1029/2009JA014695.
ered from the Madrigal database (http://cedar.openmadrigal. Gerzen T, Feltens J, Jakowski N, Galkin I, Denton R, Reinisch B,
org/). Ground-based VTEC data were provided by JPL and Zandbergen R. 2015. Validation of plasmasphere electron density
obtained at https://cdaweb.gsfc.nasa.gov/pub/data/gps/. This reconstructions derived from data on board CHAMP by IMAGE/
work has been funded by the Deutsche Forschungsgemein- RPI data. Adv Space Res 55: 170–183. https://doi.org/10.1016/j.
schaft (DFG) under the Grant No. HO 6136/1-1 and by the asr.2014.08.005.
“Helmholtz Pilot projects Information & Data Science II” Gulyaeva TL, Arikan F, Stanislawska I. 2011. Inter-hemispheric
(Grant support from the Initiative and Networking Fund of imaging of the ionosphere with the upgraded IRI-Plas model
during the space weather storms. Earth Planets Space 63: 929–
the Hermann von Helmholtz-Association Deutscher
939. https://doi.org/10.5047/eps.2011.04.007.
Forschungszentren e.V. (ZT-I-0022)) with the project named
Hajj GA, Lee LC, Pi X, Romans LJ, Schreiner WS, Straus PR, Wang
MAchine learning based Plasma density model (MAP). The C. 2000. COSMIC GPS ionospheric sensing and space weather.
editor thanks Joseph Lemaire and an anonymous reviewer Terr Atmos Ocean Sci 11: 235–272. https://doi.org/10.3319/
for their assistance in evaluating this paper. TAO.2000.11.1.235(COSMIC).
Heilig B, Lühr H. 2018. Quantifying the relationship between the
plasmapause and the inner boundary of small-scale field-aligned
References currents, as deduced from Swarm observations. Ann Geophys 36:
595–607. https://doi.org/10.5194/angeo-36-595-2018.
Astafyeva E, Zakharenkova I, Förster M. 2015. Ionospheric response Heise S, Jakowski N, Wehrenpfennig A, Reigber Ch, Lühr H. 2002.
to the 2015 St. Patrick’s Day storm: A global multi-instrumental Sounding of the topside ionosphere/plasmasphere based on GPS
overview. J Geophys Res Space Phys 120: 9023–9037. https://doi. measurements from CHAMP: Initial results. Geophys Res Lett 29:
org/10.1002/2015JA021629. 44-1–44-4. https://doi.org/10.1029/2002GL014738.
Austen JR, Franke SJ, Liu CH. 1988. Ionospheric imaging using Hobiger T, Kondo T, Koyama Y. 2008. Constrained simultaneous
computerized tomography. Radio Sci 23: 299–307. https://doi.org/ algebraic reconstruction technique (C-SART) – a new and simple
10.1029/RS023i003p00299. algorithm applied to ionospheric tomography. Earth Planets Space
Belehaki A, Jakowski N, Reinisch BW. 2004. Plasmaspheric electron 60: 727–735. https://doi.org/10.1186/BF03352821.
content derived from GPS TEC and digisonde ionograms. Adv Hoque MM, Jakowski N. 2011. A new global empirical NmF2
Space Res 33: 833–837. https://doi.org/10.1016/j.asr.2003.07.008. model for operational use in radio systems. Radio Sci 46: RS6015.
Borovsky JE, Valdivia JA. 2018. The Earth’s magnetosphere: a https://doi.org/10.1029/2011RS004807.
systems science overview and assessment. Surv Geophys 39: Hoque MM, Jakowski N. 2012. A new global model for the
817–859. https://doi.org/10.1007/s10712-018-9487-x. ionospheric F2 peak height for radio wave propagation. Ann
Carpenter DL. 1970. Whistler evidence of the dynamic behavior of Geophys 30: 787–809. https://doi.org/10.5194/angeo-30-797-2012.
the duskside bulge in the plasmasphere. J Geophys Res 75: Huang X, Reinisch BW, Song P, Green JL, Gallagher DL. 2004.
3837–3847. https://doi.org/10.1029/JA075i019p03837. Developing an empirical density model of the plasmasphere using
Carpenter DL, Anderson RR. 1992. An ISEE/Whistler model of IMAGE/RPI observations. Adv Space Res 33: 829–832.
equatorial electron density in the magnetosphere. J Geophys Res https://doi.org/10.1016/j.asr.2003.07.007.
Space Phys 97: 1097–1108. https://doi.org/10.1029/91JA01548. Jakowski N, Hoque MM. 2018. A new electron density model of the
Chen P, Yao Y. 2015. Research on global plasmaspheric electron plasmasphere for operational applications and services. J Space
content by using LEO occultation and GPS data. Adv Space Res Weather Space Clim 8: A16. https://doi.org/10.1051/swsc/
55: 2248–2255. https://doi.org/10.1016/j.asr.2015.02.004. 2018002.
Chen P, Yao Y, Li Q, Yao W. 2017. Modeling the plasmasphere based Jakowski N, Hoque MM, Mayer C. 2011. A new global TEC model
on LEO satellites onboard GPS measurements. J Geophys Res Space for estimating transionospheric radio wave propagation errors. J
Phys 122: 1221–1233. https://doi.org/10.1002/2016JA023375. Geod 85: 965–974. https://doi.org/10.1007/s00190-011-0455-1.
Cherniak IV, Zakharenkova IE, Dzubanov D, Krankowski A. 2014. Katus RM, Gallagher DL, Liemohn MW, Keesee AM, Sarno-S
Analysis of the ionosphere/plasmasphere electron content variability mith LK. 2015. Statistical storm time examination of MLT-
during strong geomagnetic storm. Adv Space Res 54: 586–594. dependent plasmapause location derived from IMAGE EUV.
https://doi.org/10.1016/j.asr.2014.04.011. J Geophys Res Space Phys 120: 5545–5559. https://doi.org/
Fagundes PR, Cardoso FA, Fejer BG, Venkatesh K, Ribeiro BAG, 10.1002/2015JA021225.
Pillat VG. 2016. Positive and negative GPS-TEC ionospheric Kil H, Kwak Y-S, Oh S-J, Talaat ER, Paxton LJ, Zhang Y. 2011. The
storm effects during the extreme space weather event of March source of the longitudinal asymmetry in the ionospheric tidal
2015 over the Brazilian sector. J Geophys Res Space Phys 121: structure. J Geophys Res 116: A09328. https://doi.org/10.1029/
5613–5625. https://doi.org/10.1002/2015JA022214. 2011JA016781.
Foelsche U, Kirchengast G. 2002. A simple “geometric” mapping func- Krypiak-Gregorczyk A. 2019. Ionosphere response to three extreme
tion for the hydrostatic delay at radio frequencies and assessment of events occurring near spring equinox in 2012, 2013 and 2015,
Page 11 of 12F.S. Prol et al.: J. Space Weather Space Clim. 2021, 11, 5
observed by regional GNSS-TEC model. J Geod 93: 931–951. Geophys Res Lett 24: 2291–2294. https://doi.org/10.1029/
https://doi.org/10.1007/s00190-018-1216-1. 97GL52283.
Lemaire JF, Batteux SG, Slypen IN. 2005. The influence of a Sharma S, Galav P, Dashora N, Alex S, Dabas RS, Pandey R. 2011.
southward and northward turning of the interplanetary magnetic Response of low-latitude ionospheric total electron content to the
field on the geomagnetic cut-off of cosmic rays, on the geomagnetic storm of 24 August 2005. J Geophys Res 116:
mirror points positions of geomagnetically trapped particles, and A05317. https://doi.org/10.1029/2010JA016368.
on their rate of precipitations in the atmosphere. J Atmos Sol-Terr Singh AK, Singh RP, Siingh D. 2011. State studies of Earth’s
Phys 67: 719–727. https://doi.org/10.1016/j.jastp.2004.09.008. plasmasphere: A review. Planet Space Sci 59: 810–834.
Liu X, Liu W, Cao JB, Fu HS, Yu J, Li X. 2015. Dynamic https://doi.org/10.1016/j.pss.2011.03.013.
plasmapause model based on THEMIS measurements. J Geophys Spencer PSJ, Mitchell CN. 2011. Imaging of 3-D plasmaspheric
Res Space Phys 120: 10543–10556. https://doi.org/10.1002/ electron density using GPS to LEO satellite differential phase
2015JA021801. observations. Radio Sci 46: RS0D04. https://doi.org/10.1029/
Norberg J, Vierinen J, Roininen L, Orispää M, Kauristie K, Rideout 2010RS004565.
WC, Coster AJ, Lehtinen MS. 2018. Gaussian markov random Webb PA, Essex EA. 2000. An ionosphere-plasmasphere global
field priors in ionospheric 3-D multi-instrument tomography. IEEE electron density model. Phys Chem Earth 25: 301–306. https://doi.
Trans Geosci Remote Sens 56: 7009–7021. https://doi.org/ org/10.1016/S1464-1917(00)00021-0.
10.1109/TGRS.2018.2847026. Wen D, Liu S, Tang P. 2010. Tomographic reconstruction of
O’Brien TP, Moldwin M. 2003. Empirical plasmapause models from ionospheric electron density based on constrained algebraic
magnetic indices. Geophys Res Lett 30: 1152. https://doi.org/ reconstruction technique. GPS Solut 14: 375–380. https://doi.org/
10.1029/2002GL016007. 10.1007/s10291-010-0161-0.
Olivares-Pulido G, Hernández-Pajares M, Aragón-Àngel A, Garcia- Wu MJ, Guo P, Xu TL, Fu NF, Xu XS, Jin HL, Hu XG. 2015. Data
Rigo A. 2016. A linear scale height Chapman model supported by assimilation of plasmasphere and upper ionosphere using COS-
GNSS occultation measurements. J Geophys Res Space Phys 121: MIC/GPS slant TEC measurements. Radio Sci 50: 1131–1140.
7932–7940. https://doi.org/10.1002/2016JA022337. https://doi.org/10.1002/2015RS005732.
Pierrard V, Voiculescu M. 2011. The 3D model of the plasmasphere Verbanac G, Pierrard V, Bandic M, Darrouzet F, Rauch J-L,
coupled to the ionosphere. Geophys Res Lett 38: L12104. Décréau P. 2015. The relationship between plasmapause, solar wind
https://doi.org/10.1029/2011GL047767. and geomagnetic activity between 2007 and 2011. Ann Geophys 33:
Pinto Jayawardena TS, Chartier AT, Spencer P, Mitchell CN. 1271–1283. https://doi.org/10.5194/angeo-33-1271-2015.
2016. Imaging the topside ionosphere and plasmasphere with Yizengaw E, Moldwin MB, Galvan D, Iijima BA, Komjathy A,
ionospheric tomography using COSMIC GPS TEC. J Geophys Res Mannucci AJ. 2008. Global plasmaspheric TEC and its relative
Space Phys 121: 817–831. https://doi.org/10.1002/2015JA021561. contribution to GPS TEC. J Atmos Sol-Terr Phys 70: 1541–1548.
Prol FS, Hernández-Pajares M, Muella MTAH, Camargo PO. 2018. https://doi.org/10.1016/j.jastp.2008.04.022.
Tomographic imaging of ionospheric plasma bubbles based on Yue X, Schreiner WS, Hunt DC, Rocken C, Kuo Y-H. 2011.
GNSS and radio occultation measurements. Remote Sens 10: 1529. Quantitative evaluation of the low Earth orbit satellite based slant
https://doi.org/10.3390/rs10101529. total electron content determination. Space Weather 9: S09001.
Prol FS, Camargo PO, Hernández-Pajares M, Muella MTAH. 2019. https://doi.org/10.1029/2011SW000687.
A new method for ionospheric tomography and its assessment by Yue X, Wang W, Lei J, Burns A, Zhang Y, Wan W, Liu L, Hu L,
ionosonde electron density, GPS TEC, and single-frequency PPP. Zhao B, Schreiner WS. 2016. Long-lasting negative ionospheric
IEEE Trans Geosci Remote Sens 57: 2571–2582. https://doi.org/ storm effects in low and middle latitudes during the recovery phase
10.1109/TGRS.2018.2874974. of the 17 March 2013 geomagnetic storm. J Geophys Res Space
Pryse SE, Kersley L. 1992. A preliminary experimental test of Phys 121: 9234–9249. https://doi.org/10.1002/2016JA022984.
ionospheric tomography. J Atmos Terr Phys 54: 1007–1012. Zhelavskaya IS, Shprits YY, Spasojevic M. 2017. Empirical
https://doi.org/10.1016/0021-9169(92)90067-U. modeling of the plasmasphere dynamics using neural networks.
Pryse SE, Kersley L, Mitchell CN, Spencer PSJ, Williams MJ. 1998. J Geophys Res Space Phys 122: 11227–11244. https://doi.org/
A comparison of reconstruction techniques used in ionospheric 10.1002/2017JA024406.
tomography. Radio Sci 33: 1767–1779. https://doi.org/10.1029/ Zhong J, Lei J, Dou X, Yue X. 2016. Assessment of vertical TEC
98RS01613. mapping functions for space-based GNSS observations. GPS Solut
Rius A, Ruffini G, Cucurull L. 1997. Improving the vertical 20: 353–362. https://doi.org/10.1007/s10291-015-0444-6.
resolution of ionospheric tomography with GPS occultations.
Cite this article as: Prol FS, Mainul Hoque M & Ferreira AA 2021. Plasmasphere and topside ionosphere reconstruction using METOP
satellite data during geomagnetic storms. J. Space Weather Space Clim. 11, 5. https://doi.org/10.1051/swsc/2020076.
Page 12 of 12You can also read