National Antibiotics Utilization Trends for Human Use in Tanzania from 2010 to 2016 Inferred from Tanzania Medicines and Medical Devices Authority ...
←
→
Page content transcription
If your browser does not render page correctly, please read the page content below
Preprints (www.preprints.org) | NOT PEER-REVIEWED | Posted: 11 August 2021 doi:10.20944/preprints202108.0263.v1

 Type of the Paper (Article, Review, Communication, etc.)

 National Antibiotics Utilization Trends for Human Use in
 Tanzania from 2010 to 2016 Inferred from Tanzania Medicines
 and Medical Devices Authority Importation Data
 Raphael Zozimus Sangeda 1*, Habibu A Saburi 1,2, Cassian Faustine2, Beatrice Godwin Aiko3, Alexander Erick4,
 Sonia Mkumbwa2, Adonis Bitegeko2, Yonah Hebron2, Emmanuel Alphonse2, Mhina Chambuso6, Hiiti Baran
 Sillo5, Adam Fimbo2, Pius Gerald Horumpende7,8,9

 1Department of Pharmaceutical Microbiology, Muhimbili University of Health and Allied Sciences, Dar es Salaam,
 Tanzania
 2Tanzania Medicines and Medical Devices Authority, Dar es Salaam, Tanzania
 3Department of Pharmaceutics and Pharmacy Practice, Muhimbili University of Healthy and Allied Sciences, Dar es
 Salaam, Tanzania
 4Department of Epidemiology and Biostatistics, School of Public Health and Social Sciences, Muhimbili University of
 Healthy and Allied Sciences, Dar es Salaam, Tanzania
 5 Regulation and Prequalification Department, World Health Organization, Geneva, Switzerland
 6Department of Pharmacy, Kampala International University in Tanzania, Dar es Salaam, Tanzania
 7Department of Biochemistry and Molecular Biology, Kilimanjaro Christian Medical University College, Moshi,
 Tanzania
 8Kilimanjaro Clinical Research Institute (KCRI), Moshi, Tanzania
 9Lugalo Infectious Diseases Hospital and Research Centre, General Military Hospital (GMH) and Military College of
 Medical Sciences (MCMS), Dar es Salaam, Tanzania
 * Correspondence: sangeda@gmail.com;

 Abstract: Antimicrobial use (AMU) is one of the major drivers of emerging antimicrobial resistance (AMR). Surveillance
 of AMU, a pillar of AMR stewardship (AMS), helps devise strategies to mitigate AMR. This descriptive, longitudinal
 retrospective study quantified the trends in human antibiotic utilization between 2010 and 2016 using data on all
 antibiotics imported for systemic human use into Tanzania's mainland. Regression and time series analyses were used
 to establish trends in antibiotics use. A total of 12,073 records for antibiotics were retrieved, totaling 154.51Daily Defined
 Doses per 1,000 inhabitants per day (DID) with a mean (± standard deviation) of 22.07 (±48.85) DID. The private sector
 contributed 93.76%% of utilized antibiotics. The top-ranking antibiotics were amoxicillin, metronidazole, tetracycline,
 ciprofloxacin and cefalexin. The DDIs and percentage contribution of these antibiotics were 53.78 (34.81%), 23.86 (15.44),
 20.53 (13.29), 9.27 (6.0) and 6.94 (4.49), respectively. The time series model predicted significant increase in utilization(p-
 value =0.002). The model forecasted that by 2022, the total antibiotics consumed would reach 89.6 DIDs, corresponding
 to a 13-fold increase compared to 2010. Government intervention to curb inappropriate antibiotic utilization to mitigate
 the rising threat of antibiotic resistance should focus on implementing AMS programs in pharmacies and hospitals in
 Tanzania.

 Keywords: antimicrobial; antimicrobial use; antimicrobial resistance; antibiotic utilization; Tanza-
 nia; defined daily dose, Anatomical Therapeutic and Chemical Classification

 © 2021 by the author(s). Distributed under a Creative Commons CC BY license.
Preprints (www.preprints.org) | NOT PEER-REVIEWED | Posted: 11 August 2021 doi:10.20944/preprints202108.0263.v1

 1. Introduction
 Antimicrobial use (AMU) is one of the major drivers of the emergence of antibiotic-
 resistant microbes. Antimicrobial resistance (AMR) is also a natural evolutionary phe-
 nomenon [1–3]. In the past decade, AMU has continuously increased globally, contributed
 mainly by the dramatic increase in consumption rates in low-and-middle-income coun-
 tries (LMICs). The increase in AMU has also been partly due to increased consumption of
 the "new and last resort" antibiotics, carbapenems, polymyxins, glycylcyclines, and oxa-
 zolidinones [4–6].
 It is well established that AMU influences resistance [1]. Thus changes in AMU pat-
 terns may be a proxy reflecting the change in the AMR patterns, which then influences
 the antimicrobial prescribing of antibiotics. In LMICs and higher-income countries (HICs),
 there has been a generally increased utilization of broad-spectrum antibiotics, including
 broad-spectrum penicillins, carbapenems and polymyxins. However, consumption of
 some classes of antibiotics such as cephalosporins, fluoroquinolones, macrolides, and sec-
 ond-line oxazolidinones have increased in the LMICs but have decreased in the HICs [4,5].
 The implication of the increase in consumption of some antibiotics, such as third-genera-
 tion cephalosporins, is that they influence the emergence of extended-spectrum beta-lac-
 tamase-producing bacteria, which then confer resistance to other beta-lactam antibiotics
 [1,7]. Moreover, once present in the pool of bacteria, these resistant genes can hardly be
 removed and can be quickly passed to other bacteria through vertical transmission or
 through lateral transmission, which can even be passed to bacteria of different species
 [1,2,8].
 The increase of antibiotic consumption, especially in the LMIC, is linked to economic
 growth as access to services and goods improves. However, economic growth is also
 linked with urbanization, facilitating infectious diseases such as enteric fevers, dengue,
 chikungunya, and viral diarrheal diseases. Also, there is an increase in respiratory ill-
 nesses due to declining air quality [5,9–11]. All these influence antibiotics use, especially
 in the communities in LMICs where access is poorly controlled. Furthermore, despite eco-
 nomic growth and access to antibiotics, the utilization is somewhat influenced by the so-
 cial and cultural norms towards prescribing and using antibiotics [4,12–16].
 Tanzania is one of the fastest-growing economies on the African continent, with an
 average growth of 7% since 2000. Moreover, as access to medicines has recently improved
 in Tanzania, measures such as training a cadre of dispensers to dispense various medi-
 cines in the outlets have been implemented. This was designed to increase accessibility to
 medicines as well as dispense appropriately [17]. However, studies in Tanzania indicate
 a high burden of inappropriate use of antibiotics in the communities, driven mainly by
 inadequate knowledge of individuals who pressure these dispensers and the need to
 make profits, which influence dispensers to abandon their knowledge and training ra-
 tional dispensing. Similarly, inappropriate prescribing and use of antibiotics have been
 documented in hospital settings [10,12,18–21].
 Consequently, resistance to the commonly available antibiotics has been rapidly and
 continuously increasing. Reports show the presence of up to 100% resistance of E. coli and
 Klebsiella pneumoniae to the commonly available penicillins and over 50% resistance to
 the third-generation cephalosporins [22,23]. Resistance to the "new and last resorts" such
 as meropenem has been documented in Tanzania to almost 10% and MRSA to about two-
 thirds of microbes [7,22,24].
 These reports of inappropriate prescribing, dispensing and use, emanate from differ-
 ent areas, as we lack national surveillance on the use of antibiotics. Similarly, national
 antibiotic resistance surveillance is lacking. The reports on overall antibiotic consumption
 can serve as a baseline evaluation of antibiotic use for future efforts to control antibiotics
 use. It will further enable the trend analyses of antibiotic use and resistance over time and,
 thus, affirm the enforcement of policies to reduce antibiotic use in the country [5,25,26].
 The standard method for estimating medicine utilization uses prescription data from
 hospitals and the sales estimates from community medicine outlets. However, this
 method is limited by a lack of or inaccuracy of records; and there is a paucity of such data

 2
Preprints (www.preprints.org) | NOT PEER-REVIEWED | Posted: 11 August 2021 doi:10.20944/preprints202108.0263.v1

 properly organized in our setting. Medicines regulatory authorities, such as the Tanzania
 Medicines and Medical Devices Authority (TMDA), are responsible for supervising the
 importation of medicines. Therefore, their medicine's importation data can be used as a
 tool to estimate medicine utilization.
 The need for accurate and more detailed antibiotic consumption data has led to the
 development of the Anatomical Therapeutic Chemical (ATC) and Defined Daily Dose
 (DDD) classification systems which are used to measure medicine utilization based on the
 usual daily dose for a given drug, defined as the assumed average maintenance dose per
 day for a drug used for its main indication in adults [27,28]. We report the trend of antibi-
 otic consumption in Tanzania based on human medicine importation data as a proxy for
 antibiotic utilization.

 2. Results
 A total of 14,301 records for antibiotics importation from 2010 to 2016 were retrieved.
 Of these, 12,073 were of antibiotics for systemic use in humans. A total of 2,228 records
 did not meet inclusion criteria either due to being antibiotics for topical use or outside the
 study range or antibiotics for veterinary use. A total of 154.51 DDD per 1000 inhabitants
 per day (DID) was utilized in Tanzania between 2010 and 2016 (Table 1) with a mean
 (standard deviation) of 22.07 (±48.85) DID.
 Table 1: Yearly distribution of DIDs and number of permits

 Year Number of permit DID

 2010 1154 6.78

 2011 1578 13.26

 2012 2008 9.78

 2013 2000 14.65

 2014 2136 29.86

 2015 1551 31.98

 2016 1646 48.19

 Total 12073 154.51

 The public and private sectors contributed 6.24 % and 93.76%, respectively, of all
 DIDs all antibiotics utilized.
 The oral and parenteral dosage forms contributed 151.18 (97.85%) and 3.33 (2.15%)
 DIDs (%), respectively (Figure 1). On further sub-dividing the antibiotics into respective
 dosage forms, capsules comprised the major form of consumption of antibiotics (Supple-
 mentary Table A3).

 3
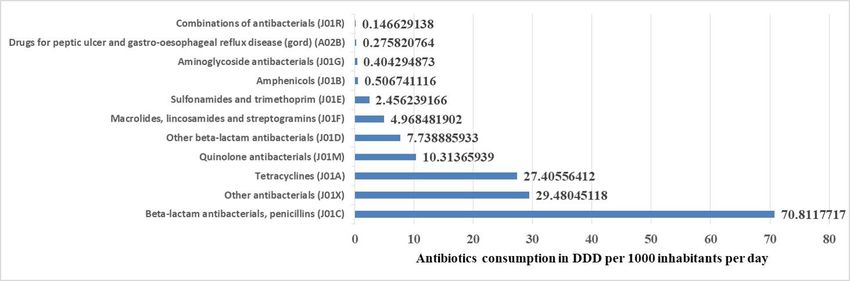
Preprints (www.preprints.org) | NOT PEER-REVIEWED | Posted: 11 August 2021 doi:10.20944/preprints202108.0263.v1

 Figure 1: Contribution of oral A) and parenteral B) route of medicine administration for
 systemic antibiotics utilized over seven years.

 According to ATC Level 3 groups (Figure 2), we found that utilization of the beta-
 lactam antibiotics, penicillins (J01C), followed by the top five, the other antibacterials
 (J01X), tetracyclines (J01A), quinolones (J01M) and other beta-lactam antibiotics (J01D)
 and macrolides lincosamides and streptogramins (J01F)(Figure 2). These top 5 classes con-
 tributed 97.55% of all consumption, with the beta-lactam antibiotics, penicillins (J01C)
 alone contributing 45.83% of all antibiotics utilized.

 Figure 2: Contribution of each class (ATC level) antibiotics utilized over seven years. From
 2010 to 2017 in Tanzania.

 The beta-lactam antibiotics, penicillins (J01C) was the most important level 3 ATC
 class that contributed the most. The individual antibiotics that made up the volumes of
 this class include Amoxicillin (J01CA04) (Figure 3 A) and then followed by ampicillin,

 4
Preprints (www.preprints.org) | NOT PEER-REVIEWED | Posted: 11 August 2021 doi:10.20944/preprints202108.0263.v1

 ampicillin + cloxacillin, cloxacillin, phenoxymethyl penicillin, procaine benzylpenicillin,
 amoxicillin + clavulanate, benzathine penicillin, ampicillin + cloxacillin, benzyl penicillin,
 amoxicillin + flucloxacillin, flucloxacillin, sultamicillin, piperacillin + tazobactam, ampicil-
 lin combination and ampicillin + sulbactam in increasing order (Figure 3 B) and Supple-
 mentary Table A4.

 Figure 3: Contribution of each antibiotic in ATC class level J01C A) for amoxycillin per
 year and B) for the other antibiotics in class J01C utilized over seven years from 2010 to
 2017 in Tanzania.

 The other antibacterials (J01X), metronidazole, was the most important utilized anti-
 biotic other antibiotics. The individual antibiotics that make up the volumes of this class
 include tinidazole, nitrofurantoin, ornidazole, linezolid and vancomycin (Figure 4) in in-
 creasing order of DIDs.

 5
Preprints (www.preprints.org) | NOT PEER-REVIEWED | Posted: 11 August 2021 doi:10.20944/preprints202108.0263.v1

 Figure 4: Contribution of each antibiotic in ATC class level J01X for the other an-
 tibiotics utilized over seven years from 2010 to 2017 in Tanzania.

 For tetracyclines (J01A), the order of increasing order was tetracycline, doxycycline,
 oxytetracycline combinations and chlortetracycline. For quinolones (J01M), the order was
 ciprofloxacin, levofloxacin, ofloxacin, norfloxacin, perfloxacin, sparfloxacin, nalidixic acid
 and moxifloxacin (Supplementary Table A4) and for other beta-lactam antibiotics (J01D)
 was cefalexin, cefuroxime, cefadroxil, cefixime, cefpodoxime, ceftriaxone, ceftazidime,
 cefaclor, cefotaxime, cefprozil, meropenem, cefepime, ceftriaxone combinations, cefopera-
 zone, combinations and cefazolin (Supplementary Table A4). For macrolides, lincosa-
 mides and streptogramins (J01F) were erythromycin, azithromycin, clarithromycin,
 clindamycin and roxithromycin (Supplementary Table A4). All DIDs of individual antibi-
 otics are ranked in Supplementary Table A4 per year to show the annual trends.

 According to the WHO AwaRe classification, the distribution of Access, Watch and
 Reserve groups was 83.1%, 10.1% and 0.008%, respectively (Table 2). There were combi-
 nations of antibiotics not recommended in the WHO AwaRE classification contributing to
 6.8% of the antibiotics in Tanzania from 2010 to 2016.

 6
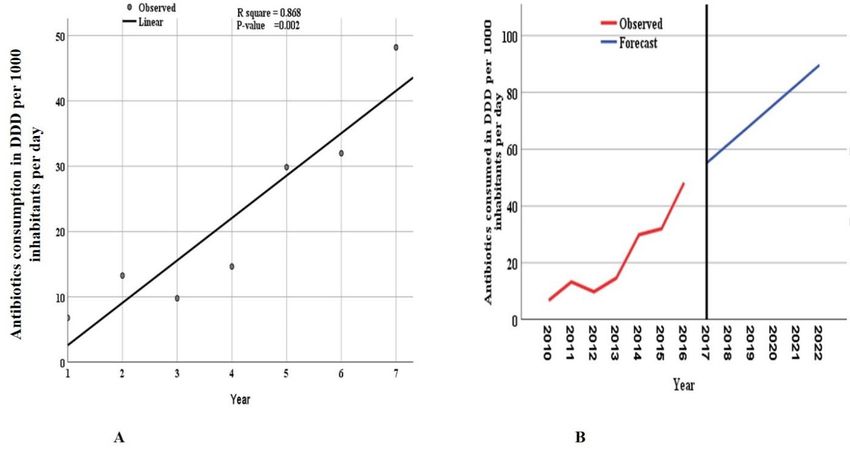
Preprints (www.preprints.org) | NOT PEER-REVIEWED | Posted: 11 August 2021 doi:10.20944/preprints202108.0263.v1

 Table 2: Distribution of Defined Daily Dose (DDD per 1000 inhabitants per day (DID)
 antibiotics per World Health organizations' AwaRe class for antibiotics utilized in Tanza-
 nia from 2010-2016
 Defined Daily Dose (DDD per 1000 inhabitants per day (DID)

 All year’s
 AwaRe class 2010 2011 2012 2013 2014 2015 2016 % of class
 total

 Access 5.060 11.238 6.307 10.049 25.382 28.879 41.456 128.371 83.083

 Watch 1.253 1.454 2.445 2.000 2.655 2.020 3.729 15.554 10.067

 Other 0.466 0.572 1.029 2.596 1.827 1.080 3.001 10.571 6.842

 Reserve 0.0 0.010 0.002 0.001 0.012 0.008

 Total 6.779 13.263 9.781 14.654 29.865 31.979 48.187 154.509 100.000

 The model that included the data for the years 2010 to 2016 could significantly predict
 the future utilization of antibiotics (Figure 5). The ARIMA model could significantly (p-
 value =0.002) predict the increase in utilization and forecast the trends of antibiotics up to
 the period 2022. The model estimated that by 2022, the total antibiotics consumed would
 reach 89.60 DIDs (Supplementary Table A5). This increase corresponds to about a 13-fold
 increase compared to the year 2010.

 Figure 5: Trends of total consumed antibiotics over seven years from 2010 to 2016.
 Period 1 corresponds to 2010 and year 7 to 2016. The linear curve estimation for (A)
 overall consumption of antibiotics shows an increasing trend, (B) The autoregressive
 integrated moving average (ARIMA, 0, 1, 0) model forecasted the utilization between
 2010 - 2022.

 7
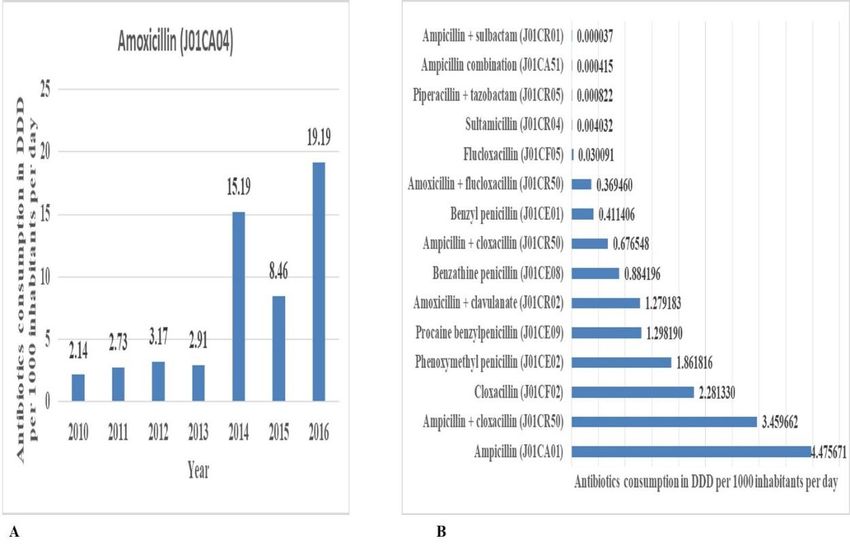
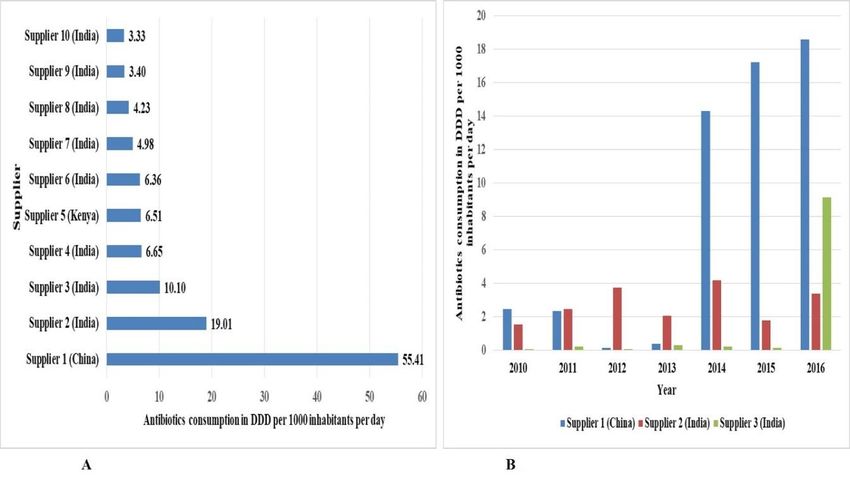
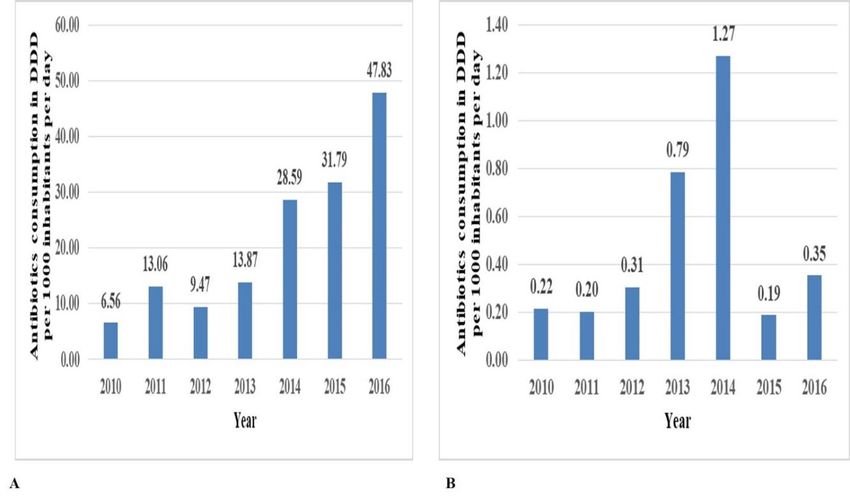
Preprints (www.preprints.org) | NOT PEER-REVIEWED | Posted: 11 August 2021 doi:10.20944/preprints202108.0263.v1

 The top ten most important foreign antibiotics suppliers and local antibiotics import-
 ers are shown in Figures 7 and 8.

 Figure 2: Top (local) importers of antibiotics utilized in Tanzania between 2010
 and 2016. Panel A) shows the top 10 importers and B) annual distribution of the top 3
 importers
 The top supplier of antibiotics in the study period is from China. Eight of the top ten
 suppliers are from India and one company is from Kenya.

 Figure 3: Top (foreign) suppliers of antibiotics utilized in Tanzania between 2010
 and 2016. Panel A) shows the top 10 importers and B) annual distribution of the top 3
 importers
 Medical Stores Department is the eighth top importer of antibiotics in the study pe-
 riod.

 8
Preprints (www.preprints.org) | NOT PEER-REVIEWED | Posted: 11 August 2021 doi:10.20944/preprints202108.0263.v1

 3. Discussion
 The Global Action Plan of antimicrobial resistance stipulates the surveillance of AMR
 and AMU to guide antimicrobial stewardship (AMS) in member countries [29]. In Tanza-
 nia, the implementation of AMS has just begun [26,30]. One of the critical elements of AMS
 is the monitoring of AMU in both animals and humans. Recently we conducted a study
 to report the trend of AMU on antibiotics for veterinary use, which showed that tetracy-
 cline, sulfonamides and trimethoprim, quinolones, aminoglycosides beta-lactams and an-
 tibacterial combinations were the frequently used antibiotics, with tetracycline on the top
 of the list in Tanzania. [31]. The current study complements the trends of AMU in humans
 to a recent report by Mbwasi and colleagues [31]. The linear curve estimation for overall
 antibiotic consumption and the Autoregressive Integrated Moving Average (ARIMA)
 model that forecasted antibiotic utilization between 2010- 2022 show an increasing trend.
 This is one of the few studies in sub-Saharan Africa that attempt to estimate antibiotic
 utilization at the national level. Our data suggest an increase in the consumption of anti-
 biotics, as reflected by a linear regression model. A total of 154.51 DIDs of antibiotics with
 a mean of 57.4 (±48.85) DID (standard deviation) were utilized in Tanzania between 2010
 and 2016. This average amount is slightly less than that reported for years 2017 to 2019 in
 Tanzania [32], in which the mean consumption of antibiotics was 80.8 DIDs over three
 years. This difference can be due to changing utilization patterns over the years and the
 latter had a shorter duration of observation. According to our data, there is an increase in
 utilization from 2010 to 2016. The utilizations seem to peak in 2017, according to the study
 by Mbwasi and colleagues [32], then decline in 2018 and 2019. The difference in the two
 reports is due to the fact that there is an increase in the trends of the utilization of antibi-
 otics and the additional data used in the study by Mbwasi and colleagues [32].
 A similar study performed in Kenya in 2004 showed a net decrease in antibiotic con-
 sumption [33]. Another similar study in Iran compared the utilization of antibiotics from
 2000 to 2016 with the Organization for Economic Co-operation and Development (OECD)
 countries. In the Iranian study, antibiotic consumption ranged from 33.6 DID to 60 DID.
 The study noted a general increase in the consumption of antibiotics in certain classes of
 antibiotics such as sulfonamide and aminoglycosides decreased [34]. A study comparing
 antibiotic utilization among European Countries revealed an increase in antibiotic con-
 sumption by 36% from 2000 to 2010 [4]. In Sierra Leone, the total consumption of antimi-
 crobials for the years 2017-2019 was 19 DDIs which is much lower than the rates found in
 our study [35].

 We noted a significant annual increase in antibiotic utilization in Tanzania from 2010
 to 2016. Using an autoregressive integrated moving average (ARIMA) model, we found a
 significant increase in antibiotic use in the study period in Tanzania. The model predicted
 that consumption of antimicrobials for 2017, 2018, 2019, 2020, 2021 and 2022 would be
 55.09, 61.99, 68.90, 75.80, 82.70 and 89.60 DIDs, respectively. These predicted values are
 slightly more than those reported by the study of 2017-2019 [32] because the latter study
 noted a peak in 2017, followed by a decline in 2018 and 2019. Therefore validating the
 ARIMA prediction model would require a dataset of more than seven years. The current
 model predicts that by 2022, antibiotic utilization will reach 89.90 DIDs, which is a 13 fold
 increase in antibiotics utilization. This is an alarming excessive antibiotic consumption
 likely to escalate AMR. An urgent need to institute AMS in Tanzanian hospitals and phar-
 macies is warranted.
 The current study shows that the public sector contributed 6.2% of all antibiotics in
 Tanzania between 2010 and 2016. These data were mainly contributed by the Medical
 Stores Department (MSD), the government authority for procuring medicines in Tanza-
 nia. This was less than the 35% public sector contribution in a previous study [32] in Tan-
 zania. We found greater consumption of oral antibiotics (97.85%) compared to parenteral
 ones (2.15%) for antibiotics for systemic use. This may imply that there are successful cam-
 paigns by the Ministry of Health on the safe use of oral products compared to injections,

 9
Preprints (www.preprints.org) | NOT PEER-REVIEWED | Posted: 11 August 2021 doi:10.20944/preprints202108.0263.v1

 given that Tanzania has just begun implementing AMS [26,30]. This same reason may
 have applied to the decline of antibiotic utilization in 2018 and 2019 [32].
 According to ATC Level 3 groups, we found that utilization of the beta-lactam anti-
 biotics, penicillins (J01C), other antibacterials (J01X), tetracyclines (J01A), quinolones
 (J01M), other beta-lactam antibiotics (J01D), and macrolides lincosamides and strepto-
 gramins (J01F) were the top 5 classes that contributed 97.55% of all antibiotic utilization,
 with the beta-lactam antibiotics, penicillins (J01C) alone contributing 45.83% of all antibi-
 otics utilized.
 The five top-ranking individually utilized antibiotics in the study periods were
 amoxicillin (J01CA04), metronidazole (J01XD01), tetracycline (J01AA07), ciprofloxacin
 (J01MA02) and cefalexin (J01DB01). The DDIs and percentage contribution of these anti-
 biotics were 53.78 (34.81%), 23.86 (15.44), 20.53 (13.29), 9.27 (6.0) and 6.94 (4.49), respec-
 tively.
 These top five antibiotics are recommended for various conditions in Tanzania Main-
 land's Standard Treatment Guidelines (STG). Amoxicillin is recommended to treat acute
 respiratory infections [36], metronidazole is used in anaerobic bacterial infections. On the
 other hand, tetracycline has been replaced by doxycycline in treating cholera, pelvic in-
 flammatory diseases, and sexually transmitted diseases. Ciprofloxacin is mainly used for
 the treatment of urinary tract infections. Cefalexin is used in regional referral hospitals to
 replace penicillins [36]. The resistance levels to these antibiotics in this setting have been
 noted to be increasing [24]. The extensive use of amoxicillin in Tanzania may be attributed
 to its use in accredited drug dispensing outlets (ADDO). The program provides training
 to dispensers, including the Integrated Management of Childhood Illness (IMCI), which
 includes managing acute respiratory tract infections (ARIs) and diarrhea in children. The
 program guides to when antibiotics are indicated for pneumonia and severe pneumonia
 only [18]. However, there are reports where antibiotic overuse and inappropriate antibi-
 otic use have been observed [12,16–18] among ADDO dispensers. This may have driven
 the overuse of amoxicillin in Tanzania.
 In the class beta-lactam antibiotics, penicillins, the other most consumed antibiotic
 were ampicillin and cloxacillin alone or in combination. In the class, other antibacterials
 were tinidazole and nitrofurantoin. In case quinolone antibacterial ciprofloxacin, levoflox-
 acin and ofloxacin contributed to the most in the group. For the group, macrolides, lin-
 cosamides, streptogramins, erythromycin azithromycin, clindamycin, clarithromycin and
 roxithromycin were the only imported products.
 We found a higher dominance of suppliers of antibiotics from India. In the top ten
 suppliers of antibiotics in Tanzania, this trend has also been shown in other studies [37],
 indicating a good trade between Tanzania and India in the sales of pharmaceutics. How-
 ever, the antibiotic quality determination was beyond the scope of this study.
 Limitation of this analysis
 It is assumed that almost most of the antibiotics imported are used, where the Medi-
 cal Stores Department (MSD) imports 80% of all antibiotics. The proper inventory control
 means in medicine outlets also ensure that a few medicines end up expired. However, the
 contribution of public data from MSD was low in this dataset, exclusively from TMDA.
 Nevertheless, this study provides baseline data on antimicrobial drug usage, and it
 helps interpret any current or future emergence of antibiotic resistance.

 4. Materials and Methods
 4.1 Study Design
 This was a retrospective, longitudinal analytical study that assessed consumption
 trends of standard units of antibiotics for human systemic use from the importation data
 on human medicine from 1st January 2010 to 31st December 2016 in Tanzania mainland.
 4.2 Study setting
 This study was done in The United Republic of Tanzania. The country is located at a
 latitude of 6.3690° S. and longitude 34.8888° E, bordered by eight countries with the Indian
 Ocean along the eastern border. Uganda is to the north, Malawi and Mozambique are

 10
Preprints (www.preprints.org) | NOT PEER-REVIEWED | Posted: 11 August 2021 doi:10.20944/preprints202108.0263.v1

 found to the south. Zambia is on the southwest border and Kenya is northeast. The Dem-
 ocratic Republic of Congo, Rwanda, and Burundi are three countries on the western bor-
 der. These borders are the entry points of imported medicines into the country through
 the sea harbor and airports. The ports of entries of medicines include Dar es Salaam air-
 port and sea harbor (6.7924° S, 39.2083° E), Kilimanjaro airport (3.4245° S, 37.0651° E) Na-
 tional terrestrial border checkpoints at Sirari at 1.2512° S, 34.4763° E, Horohoro ay 6.369°
 S and 34.8888° E, Namanga (Kenya border), Tunduma at 9.3096° S, 32.7689° E (Zambia
 border) and Mutukula at 1.0007° S, 31.4156° E (Uganda border).

 4.3 Data sources
 The study used data on all antibiotics imported for human systemic use into Tanza-
 nia's mainland obtained from the Tanzania Medicines and Medical Devices Authority
 (TMDA). The data included the port of entry identification at both air, sea and border
 checkpoints at Sirari, Horohoro, Namanga, Tunduma, Mutukula and the seaport in Dar
 es Salaam. Importation data can serve as a proxy to estimate the utilization of antibiotics
 as information on all medicines imported into the country are available. This method as-
 sumes that all medicines imported are utilized in Tanzania and that all medicines entering
 the country are through the normal legal pathway as regulated by TMDA. We also assume
 that there is no illegal importation of medicines that would go undocumented [27]. An-
 other assumption is that proper inventory control measures are generally taken to mini-
 mize expiry and losses in the retail medicine stores. Almost all antibiotics imported are
 utilized for systemic use by humans.
 The antibiotics used for systemic use were extracted, including those assigned the
 code J in the ATC system. Within this group, there are several subgroups. The defined
 daily dose is defined as the average dose required for maintenance.
 Data were adjusted to the WHO/Anatomic Therapeutic Classification (ATC) classifi-
 cation system and expressed as a number of defined daily doses (DDD). DDD is a func-
 tion of the total amount in grams of the antibiotics consumed and the DDD for as a par-
 ticular dosage form is shown by the equation following equation: [38]

 (( × × . ))
 ⁄ (( )

 ATC classification system as a tool for medicine utilization research was used. This
 is a gold standard for medicines utilization research worldwide. The defined daily doses
 of the antibiotics were calculated as shown in the formula.
 ( )) ⁄ (( )
 Reference was made to the DDD list available at www.whocc.no for the DDD val-
 ues assigned to different antibiotics. Then the amounts in defined daily doses/1000 inhab-
 itants-day were determined for each antibiotic and the overall amount was determined
 using the function
 DDD/1000 inhabitants-day = (Total DDDs in grams ∗ 1000)/(Population ∗ 365)
 Reference was made to population estimates from the National Bureau of Statistics
 for the covered years (Supplementary Table A1).

 4.4 Exclusion criteria
 All records, including topical products such as lotion, cream, ointment, pessaries and
 shampoos and ophthalmic solutions, were excluded from the analysis. In addition, rec-
 ords without permit numbers, reference numbers, or permit issue dates were also ex-
 cluded because, for these, the importation year could be derived to be included in the
 analysis. In addition, records including dates out of the study range were also omitted.

 11
Preprints (www.preprints.org) | NOT PEER-REVIEWED | Posted: 11 August 2021 doi:10.20944/preprints202108.0263.v1

 4.5 Data collection
 TMDA is a medical products regulatory authority regulating and approving the im-
 portation of medicines into the Tanzanian mainland market. TMDA outlined regulations
 and procedures that oblige importers to apply for an importation permit. After success-
 fully evaluating the application, import permits are issued and archived using the
 TMDA's Management Information System (MIS). Records were retrieved from the TMDA
 database of imported medicines.
 The importation data collected include the date, generic and brand name of medicine,
 strength, category, quantity, the ATC classification of the antibiotic, company (suppliers
 or importer), price, currency, product manufacturer and country of origin. Data were ad-
 justed to the WHO Anatomical Therapeutic Classification (ATC) system and expressed as
 Defined Daily Dose (DDD) measurement units. Utilization was expressed in DDD per
 1000 inhabitants per day (DID). Antiviral and antifungal substances were grouped accord-
 ing to their main indications.
 We also classified antibiotics according to the AWaRe classes. According to this clas-
 sification, the Access group consists of antibiotics with activity against a wide range of
 commonly encountered susceptible bacteria with lower resistance potential than antibiot-
 ics in the other groups. The watch class consists of antibiotics with higher resistance po-
 tential and includes most of the highest priority agents among the critically important
 antimicrobials for human use. The reserve group includes antibiotics and antibiotic clas-
 ses that should be reserved to treat confirmed or suspected infections due to multi-drug-
 resistant organisms. Reserve group antibiotics should be treated as "last resort" options
 [39].

 4.6 Data cleaning
 Years were computed from dates, and where a date was missing, the reference num-
 ber of the import permit that contains the year of approval was considered.
 Data were reorganized to calculate milligrams (mg) and subsequent DDDs, as shown
 in the expression above. It involved rearranging pack size and strength to determine the
 total amount in mg for individual dosage units in different dosage forms.
 Data were checked for accuracy, completeness and reliability before analysis. The
 total grams of the medicines utilized were quantified by grouping the total amounts of
 active ingredients across the various formulations, accounting for the differences in
 strengths, dosage forms, and pack sizes.
 We calculated the DDD of each antibiotic using the formula [40,41], where the total
 amount consumed in grams was divided by the DDD of antimicrobial in grams. Reference
 was made to the DDD list available at www.whocc.no. The amounts in defined daily
 doses/1000 inhabitants-day were determined for each antibiotic, and the overall amount
 was determined using the equation;
 DDD/1000 inhabitants-day = (Total DDDs in grams *1000) / (population * 365)
 Reference was made to population estimates from the Tanzania Bureau of Statistics
 (TBS) to adjust the antivirals and antifungals consumption trends to the country popula-
 tion (Supplementary Table A2).
 According to the AwaRE classes of antibiotics, we re-categorized the data proposed
 by the WHO [39,42]. The system comprises three groups of antibiotics: Access, Watch and
 Reserve (AwaRe) antibiotics.

 4.7 Data analysis
 Data files were combined, pivoted and aggregated using Microsoft Excel 2013 (Mi-
 crosoft Corporation, Redmond, Washington, USA). We converted the strength, pack size
 and the quantity of the antibiotic product into milligrams, grams and kilograms. Generic
 names were harmonized to match the names in the ATC mapping file. We assigned each
 product a corresponding ATC code by matching it with the imported product's generic
 name. This mapping allowed the matching of the ATC category and the pharmaceutical
 category. The amount in milligram and DDD of an antimicrobial agent's active ingredient

 12
Preprints (www.preprints.org) | NOT PEER-REVIEWED | Posted: 11 August 2021 doi:10.20944/preprints202108.0263.v1

 was calculated and aggregated for each class collected. Tables and graphs were plotted to
 depict the trends in antibiotic utilization. Annual utilization data, aggregated per year,
 were entered into the Statistical Package for the Social Sciences (SPSS) version 20 (IBM
 Corp., Armonk, NY, USA). Time series and regression analyses were performed to ascer-
 tain the annual trend of antibiotic utilization. An autoregressive integrated moving aver-
 age (ARIMA) model was established to predict the trends of antibiotic use. A p-value of
 less than 0.05 was considered statistically significant.

 5. Conclusions
 Overall, our data indicate an increase in the actual and projected use of antibiotics.
 Beta- lactams antibiotics comprised 45.8% of all utilized antibiotics in Tanzania. Therefore,
 there is a need for a Government intervention to curb inappropriate antibiotic utilization
 to mitigate the rising threat of antibiotic resistance should be a focus of the National Ac-
 tion plan on AMR and AMR stewardship.
 However, this study should be considered a baseline for further studies that account
 for the local manufacturers' and export records, as some imported medicines may be ex-
 ported to other countries. In addition, a population-based prescription database for anti-
 biotics may be developed for easy antibiotics prescription monitoring and gathering of
 information for medicine utilization studies in Tanzania and other sub-Saharan African
 countries.
 .
 Author Contributions: Conceptualization, R.S. and H.S.; methodology, R.Z and H.S.; validation,
 C.F., B.A., S.M., A.B. and E.A.; formal analysis, R.S., H.S and A.E.; writing—original draft prepara-
 tion, H.S. and R.S.; writing—review and editing, E.A, and P.H, H.B., A.F. and M.C.; visualization,
 R.Z.; supervision, P.H, H.B., A.F. and M.C. All authors have read and agreed to the published ver-
 sion of the manuscript.
 Funding: This research received no external funding
 Institutional Review Board Statement: The study was conducted according to the guidelines of the
 Declaration of Helsinki, and approved by the Institutional Research Ethics Committee) The Mu-
 himbili University of Health and Allied Sciences (protocol code DA.25/111/10/03/2017.
 Data Availability Statement: The raw data supporting the conclusions of this article will be made
 available by the authors without undue reservation.
 Acknowledgments: We thank the Tanzania Medicines and Medical Devices Authority staff for their
 assistance in retrieving the antivirals and antifungals importation data.
 Conflicts of Interest: The authors declare no conflict of interest.

 References
 1. Goossens, H. Antibiotic consumption and link to resistance. Clin. Microbiol. Infect. 2009, 15, 12–15, doi:10.1111/j.1469-
 0691.2009.02725.x.
 2. Smith, R. a; M’ikanatha, N.M.; Read, A.F. Antibiotic Resistance: A Primer and Call to Action. Health Commun. 2015, 30, 309–
 314, doi:10.1080/10410236.2014.943634.
 3. Wise, R.; Hart, T.; Cars, O.; Streulens, M.; Helmuth, R.; Huovinen, P.; Sprenger, M. Antimicrobial resistance. Is a major threat
 to public health. BMJ 1998, 317, 609–10, doi:10.1136/bmj.317.7159.609.
 4. Van Boeckel, T.P.; Gandra, S.; Ashok, A.; Caudron, Q.; Grenfell, B.T.; Levin, S.A.; Laxminarayan, R. Global antibiotic
 consumption 2000 to 2010: an analysis of national pharmaceutical sales data. Lancet. Infect. Dis. 2014, 14, 742–50,
 doi:10.1016/S1473-3099(14)70780-7.
 5. Klein, E.Y.; Van Boeckel, T.P.; Martinez, E.M.; Pant, S.; Gandra, S.; Levin, S.A.; Goossens, H.; Laxminarayan, R. Global
 increase and geographic convergence in antibiotic consumption between 2000 and 2015. Proc. Natl. Acad. Sci. 2018, 115,

 13
Preprints (www.preprints.org) | NOT PEER-REVIEWED | Posted: 11 August 2021 doi:10.20944/preprints202108.0263.v1

 E3463–E3470, doi:10.1073/pnas.1717295115.
 6. Laxminarayan, R.; Duse, A.; Wattal, C.; Zaidi, A.K.M.; Wertheim, H.F.L.; Sumpradit, N.; Vlieghe, E.; Hara, G.L.; Gould, I.M.;
 Goossens, H.; et al. Antibiotic resistance—the need for global solutions. Lancet Infect. Dis. 2013, 13, 1057–1098,
 doi:10.1016/S1473-3099(13)70318-9.
 7. Mshana, S.E.; Matee, M.; Rweyemamu, M. Antimicrobial resistance in human and animal pathogens in Zambia, Democratic
 Republic of Congo, Mozambique and Tanzania: an urgent need of a sustainable surveillance system. Ann. Clin. Microbiol.
 Antimicrob. 2013, 12, 28, doi:10.1186/1476-0711-12-28.
 8. Bywater, R.J. Veterinary Use of Antimicrobials and Emergence of Resistance in Zoonotic and Sentinel Bacteria in the EU. J.
 Vet. Med. Ser. B 2004, 51, 361–363, doi:10.1111/j.1439-0450.2004.00791.x.
 9. Byrne, M.K.; Miellet, S.; McGlinn, A.; Fish, J.; Meedya, S.; Reynolds, N.; van Oijen, A.M. The drivers of antibiotic use and
 misuse: the development and investigation of a theory driven community measure. BMC Public Health 2019, 19, 1425,
 doi:10.1186/s12889-019-7796-8.
 10. Morgan, D.J.; Okeke, I.N.; Laxminarayan, R.; Perencevich, E.N.; Weisenberg, S. Non-prescription antimicrobial use
 worldwide: a systematic review. Lancet Infect. Dis. 2011, 11, 692–701, doi:10.1016/S1473-3099(11)70054-8.
 11. Okeke, I.N.; Laxminarayan, R.; Bhutta, Z.A.; Duse, A.G.; Jenkins, P.; O’Brien, T.F.; Pablos-Mendez, A.; Klugman, K.P.
 Antimicrobial resistance in developing countries. Part I: recent trends and current status. Lancet Infect. Dis. 2005, 5, 481–493,
 doi:10.1016/S1473-3099(05)70189-4.
 12. Mboya, E.A.; Sanga, L.A.; Ngocho, J.S. Irrational use of antibiotics in the Moshi Municipality Northern Tanzania: a cross
 sectional study. Pan Afr. Med. J. 2018, 31, 1–10, doi:10.11604/pamj.2018.31.165.15991.
 13. Mboya, E.A.; Davies, M.L.; Horumpende, P.G.; Ngocho, J.S. Inadequate knowledge on appropriate antibiotics use among
 clients in the Moshi municipality Northern Tanzania. PLoS One 2020, 15, e0239388, doi:10.1371/journal.pone.0239388.
 14. Prestinaci, F.; Pezzotti, P.; Pantosti, A. Antimicrobial resistance: a global multifaceted phenomenon. Pathog. Glob. Health 2015,
 109, doi:10.1179/2047773215Y.0000000030, doi:10.1179/2047773215Y.0000000030.
 15. Ilić, K.; Jakovljević, E.; Škodrić-Trifunović, V. Social-economic factors and irrational antibiotic use as reasons for antibiotic
 resistance of bacteria causing common childhood infections in primary healthcare. Eur. J. Pediatr. 2012, 171, 767–777,
 doi:10.1007/s00431-011-1592-5.
 16. Poyongo, B.P.; Sangeda, R.Z. Pharmacists’ Knowledge, Attitude and Practice Regarding the Dispensing of Antibiotics
 without Prescription in Tanzania: An Explorative Cross-Sectional Study. Pharmacy 2020, 8, 238, doi:10.3390/pharmacy8040238.
 17. Chalker, J.C.; Vialle-Valentin, C.; Liana, J.; Mbwasi, R.; Semali, I.A.; Kihiyo, B.; Shekalaghe, E.; Dillip, A.; Kimatta, S.; Valimba,
 R.; et al. What roles do accredited drug dispensing outlets in Tanzania play in facilitating access to antimicrobials? Results of
 a multi-method analysis. Antimicrob. Resist. Infect. Control 2015, 4, 33, doi:10.1186/s13756-015-0075-2.
 18. Dillip, A.; Embrey, M.; Shekalaghe, E.; Ross-Degnan, D.; Vialle-Valentin, C.; Kimatta, S.; Liana, J.; Rutta, E.; Valimba, R.;
 Chalker, J. What motivates antibiotic dispensing in accredited drug dispensing outlets in Tanzania? A qualitative study.
 Antimicrob. Resist. Infect. Control 2015, 4, 30, doi:10.1186/s13756-015-0073-4.
 19. Minzi, O.; Manyilizu Application of basic pharmacology and dispensing practice of antibiotics in accredited drug-dispensing
 outlets in Tanzania. Drug. Healthc. Patient Saf. 2013, 5, 5, doi:10.2147/DHPS.S36409.
 20. Chilongola, J.; Msoka, E.; Juma, A.; Kituma, E.; Kwigizile, E.; Nyombi, B. Antibiotics prescription practices for provisional
 malaria cases in three hospitals in Moshi, northern Tanzania. Tanzan. J. Health Res. 2015, 17, 1–10, doi:10.4314/thrb.v17i3.1.
 21. Reynolds, L.; McKee, M. Serve the people or close the sale? Profit-driven overuse of injections and infusions in China’s
 market-based healthcare system. Int. J. Health Plann. Manage. 2011, 26, 449–470, doi:10.1002/hpm.1112.
 22. Mikomangwa, W.P.; Bwire, G.M.; Kilonzi, M.; Mlyuka, H.; Mutagonda, R.; Kibanga, W.; Marealle, A.I.; Minzi, O.; Mwambete,
 K.D. The Existence of High Bacterial Resistance to Some Reserved Antibiotics in Tertiary Hospitals in Tanzania: A Call to
 Revisit Their Use. Infect. Drug Resist. 2020, 13, 1831–1838, doi:10.2147/IDR.S250158.
 23. Moremi, N.; Claus, H.; Mshana, S.E. Antimicrobial resistance pattern: a report of microbiological cultures at a tertiary hospital

 14
Preprints (www.preprints.org) | NOT PEER-REVIEWED | Posted: 11 August 2021 doi:10.20944/preprints202108.0263.v1

 in Tanzania. BMC Infect. Dis. 2016, 16, 756, doi:10.1186/s12879-016-2082-1.
 24. Mnyambwa, N.P.; Mahende, C.; Wilfred, A.; Sandi, E.; Mgina, N.; Lubinza, C.; Kahwa, A.; Petrucka, P.; Mfinanga, S.;
 Ngadaya, E.; et al. Antibiotic Susceptibility Patterns of Bacterial Isolates from Routine Clinical Specimens from Referral
 Hospitals in Tanzania: A Prospective Hospital-Based Observational Study. Infect. Drug Resist. 2021, Volume 14, 869–878,
 doi:10.2147/IDR.S294575.
 25. Tao, W.; Ivanovska, V.; Schweickert, B.; Muller, A. Proxy indicators for antibiotic consumption; surveillance needed to control
 antimicrobial resistance. Bull. World Health Organ. 2019, 97, 3-3A, doi:10.2471/BLT.18.227348.
 26. Sangeda, R.Z.; Kibona, J.; Munishi, C.; Arabi, F.; Manyanga, V.P.; Mwambete, K.D.; Horumpende, P.G. Assessment of
 Implementation of Antimicrobial Resistance Surveillance and Antimicrobial Stewardship Programs in Tanzanian Health
 Facilities a Year After Launch of the National Action Plan. Front. Public Heal. 2020, 8, 454, doi:10.3389/fpubh.2020.00454.
 27. World Health Organization Introduction to Drug Utilization Research Introduction to Drug Utilization Research Available
 online: https://www.who.int/publications/i/item/8280820396 (accessed on Jul 12, 2021).
 28. Sataloff, R.T.; Johns, M.M.; Kost, K.M.; Methodology, W.C.C. for D.S. Guidelines for ATC classification and DDD assignment
 2021 Available online: https://www.whocc.no/filearchive/publications/2021_guidelines_web.pdf (accessed on Jan 16, 2021).
 29. Munkholm, L.; Rubin, O. The global governance of antimicrobial resistance: a cross-country study of alignment between the
 global action plan and national action plans. Global. Health 2020, 16, 109, doi:10.1186/s12992-020-00639-3.
 30. Frumence, G.; Mboera, L.E.G.; Sindato, C.; Katale, B.Z.; Kimera, S.; Metta, E.; Durrance-Bagale, A.; Jung, A.-S.; Mshana, S.E.;
 Clark, T.G.; et al. The Governance and Implementation of the National Action Plan on Antimicrobial Resistance in Tanzania:
 A Qualitative Study. Antibiotics 2021, 10, 273, doi:10.3390/antibiotics10030273.
 31. Sangeda, R.Z.; Baha, A.; Erick, A.; Mkumbwa, S.; Bitegeko, A.; Sillo, H.B.; Fimbo, A.M.; Chambuso, M.; Mbugi, E.V.
 Consumption Trends of Antibiotic for Veterinary Use in Tanzania: A Longitudinal Retrospective Survey From 2010-2017.
 Front. Trop. Dis. 2021, 2, doi:10.3389/fitd.2021.694082.
 32. Mbwasi, R.; Mapunjo, S.; Wittenauer, R.; Valimba, R.; Msovela, K.; Werth, B.J.; Khea, A.M.; Nkiligi, E.A.; Lusaya, E.;
 Stergachis, A.; et al. National Consumption of Antimicrobials in Tanzania: 2017–2019. Front. Pharmacol. 2020, 11,
 doi:10.3389/fphar.2020.585553.
 33. Mitema, E.S.; Kikuvi, G.M. Surveillance of the overall use of antimicrobial drugs in humans over a 5 year period (1997–2001)
 in Kenya. J. Antimicrob. Chemother. 2004, 54, 966–967, doi:10.1093/jac/dkh433.
 34. Abbasian, H.; Hajimolaali, M.; Yektadoost, A.; Zartab, S. Antibiotic utilization in Iran 2000–2016: Pattern analysis and
 benchmarking with organization for economic co-operation and development Countries. J. Res. Pharm. Pract. 2019, 8, 162,
 doi:10.4103/jrpp.JRPP_19_42.
 35. Kanu, J.S.; Khogali, M.; Hann, K.; Tao, W.; Barlatt, S.; Komeh, J.; Johnson, J.; Sesay, M.; Vandi, M.A.; Tweya, H.; et al. National
 Antibiotic Consumption for Human Use in Sierra Leone (2017–2019): A Cross-Sectional Study. Trop. Med. Infect. Dis. 2021, 6,
 77, doi:10.3390/tropicalmed6020077.
 36. The United Republic of Tanzania Standard Treatment Guidelines & National Essential Medicines List Tanzania Mainland
 Available online:
 http://www.tzdpg.or.tz/fileadmin/documents/dpg_internal/dpg_working_groups_clusters/cluster_2/health/Key_Sector_Do
 cuments/Tanzania_Key_Health_Documents/STANDARD_TREATMENT_GUIDELINES__CORRECT_FINAL_USE_THIS-
 1.pdf (accessed on Apr 1, 2021).
 37. Wande, D.P.; Sangeda, R.Z.; Tibalinda, P.; Mutta, I.K.; Mkumbwa, S.; Bitegeko, A.; Kaale, E. Pharmaceuticals imports in
 Tanzania: Overview of private sector market size, share, growth and projected trends to 2021. PLoS One 2019, 14, e0220701,
 doi:10.1371/journal.pone.0220701.
 38. Hutchinson, J.M.; Patrick, D.M.; Marra, F.; Ng, H.; Bowie, W.R.; Heule, L.; Muscat, M.; Monnet, D.L. Measurement of
 antibiotic consumption: A practical guide to the use of the Anatomical Therapeutic Chemical classification and Definied
 Daily Dose system methodology in Canada. Can. J. Infect. Dis. 2004, 15, 29–35, doi:10.1155/2004/389092.

 15
Preprints (www.preprints.org) | NOT PEER-REVIEWED | Posted: 11 August 2021 doi:10.20944/preprints202108.0263.v1

 39. World Health Organization The 2019 WHO AWaRe classification of antibiotics for evaluation and monitoring of use
 Available online: https://apps.who.int/iris/handle/10665/327957 (accessed on Jul 17, 2021).
 40. Kuster, S.P.; Ruef, C.; Ledergerber, B.; Hintermann, A.; Deplazes, C.; Neuber, L.; Weber, R. Quantitative antibiotic use in
 hospitals: comparison of measurements, literature review, and recommendations for a standard of reporting. Infection 2008,
 36, 549–59, doi:10.1007/s15010-008-7462-z.
 41. World Health Organization WHO Regional Office for Europe Antimicrobial Medicines Consumption (AMC) Network
 Available online: https://www.euro.who.int/en/publications/abstracts/who-regional-office-for-europe-antimicrobial-
 medicines-consumption-amc-network.-amc-data-20112017-2020 (accessed on Jul 19, 2021).
 42. Hsia, Y.; Lee, B.R.; Versporten, A.; Yang, Y.; Bielicki, J.; Jackson, C.; Newland, J.; Goossens, H.; Magrini, N.; Sharland, M.; et
 al. Use of the WHO Access, Watch, and Reserve classification to define patterns of hospital antibiotic use (AWaRe): an
 analysis of paediatric survey data from 56 countries. Lancet Glob. Heal. 2019, 7, e861–e871, doi:10.1016/S2214-109X(19)30071-
 3.

 16
You can also read