Shared and Distinct Dysfunction of Dynamic Connectivity Networks across Schizophrenia, Bipolar Disorder and Major Depression Disorder - bioRxiv
←
→
Page content transcription
If your browser does not render page correctly, please read the page content below
bioRxiv preprint first posted online Jun. 13, 2019; doi: http://dx.doi.org/10.1101/670562. The copyright holder for this preprint
 (which was not peer-reviewed) is the author/funder, who has granted bioRxiv a license to display the preprint in perpetuity.
                              It is made available under a CC-BY-NC-ND 4.0 International license.

          Shared and Distinct Dysfunction of Dynamic Connectivity Networks

          across Schizophrenia, Bipolar Disorder and Major Depression

          Disorder

          Chao Li, M.D., Ph.D. b, c#; Ke Xu, M.D., Ph.D.b, c#;; Yange Wei, M.D., Ph.D.a, c; Jia
          Duan, M.D., Ph.D. a, c; Shaoqiang Han, Ph.D.e, f; Ruiqi Feng, M.D., Ph.D. b, c; Yifan
          Chen, M.D., Ph.D.a, c; Luheng Zhang, M.Phia, c; Xiaowei Jiang , M.D., Ph.D.a, b, c;
          Shengnan Wei, M.D., Ph.D. a, b, c; Huafu Chen, Ph.D. e, f; Yanqing Tang, M.D., Ph.D. a,
          c
            ; Fei Wang, M.D., Ph.D.a, b, c, d*
          a
           Department of Psychiatry, The First Affiliated Hospital of China Medical University,
          Shenyang, Liaoning, PR China
          b
           Department of Radiology, The First Affiliated Hospital of China Medical University,
          Shenyang, Liaoning, PR China
          c
           Brain Function Research Section, The First Affiliated Hospital of China Medical
          University, Shenyang, Liaoning, PR China
          d
              Department of Psychiatry, Yale School of Medicine, New Haven, Connecticut, USA
          e
           The Clinical Hospital of Chengdu Brain Science Institute, MOE Key Lab for
          Neuroinformation, University of Electronic Science and Technology of China,
          Chengdu, China
          f
           School of life Science and technology, center for information in medicine, University
          of Electronic Science and Technology of China, Chengdu, China.
          #
              The two authors contributed equally to this work.
          *
              To whom correspondence should be addressed:

          Fei Wang, M.D., Ph.D., Department of Psychiatry and Radiology. The First Affiliated
          Hospital, China Medical University, 155 Nanjing North Street, Shenyang 110001,
          Liaoning, PR China, and Department of Psychiatry, Yale University School of
          Medicine, New Haven CT 06511, USA; Phone/Fax: 8624-83283405, email:
          fei.wang@cmu.edu.cn; fei.wang@yale.edu

                                                                       1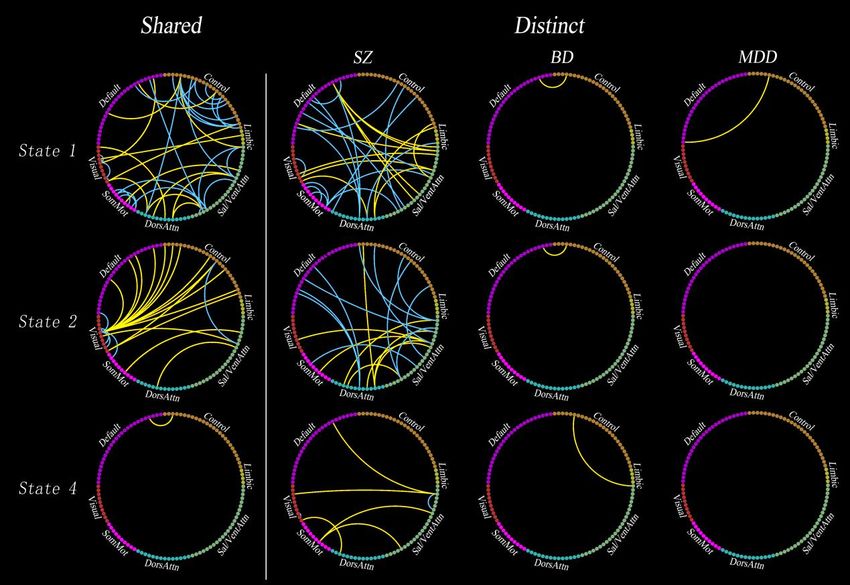
bioRxiv preprint first posted online Jun. 13, 2019; doi: http://dx.doi.org/10.1101/670562. The copyright holder for this preprint
 (which was not peer-reviewed) is the author/funder, who has granted bioRxiv a license to display the preprint in perpetuity.
                              It is made available under a CC-BY-NC-ND 4.0 International license.

          Abstract. Converging evidence indicates that each nominally distinct psychiatric
          disease entity have both broadly shared and distinct risk genes, clinical symptoms,
          and brain structural and functional disruption. Many studies used the static
          (time-averaged) functional connectivity to examine the similarities and differences in
          functional brain networks in psychiatric disorders. However, little is known about the
          similarities and differences in dynamic functional connectivity (FC) networks across
          multiple major psychiatric disorders. A total of 655 participants (125 with
          schizophrenia (SZ), 121 with bipolar disorder (BD), 192 with major depressive
          disorder (MDD), and 217 demographically matched healthy controls (HC) completed
          resting-state functional magnetic resonance imaging at a single site. We used
          sliding-window approach to construct dynamic FC networks, and used k-means
          clustering to obtain four dissociated networks by different states. We identified shared
          and distinct dysconnectivity across these psychiatric disorders compared with HC in
          each state. We found dysconnectivity in psychosis were state-specific, rather than a
          time-invariant global abnormality. SZ, BD and MDD shared decreased intra-network
          FC      (especially        frontoparietal         control        network       (FPN)),        whereas        increased
          inter-network FC (especially between visual network (VN) and both default mode
          network (DMN) and FPN). Almost all dysconnectivity in BD and MDD were
          included in those in SZ, with SZ had distinct dysconnectivity that preferentially
          involving inter-network dysconnectivity between high-level cognitive networks.
          Many dysconnectivity were not detected by static FC. These findings shed new light
          on the current transdiagnostic knowledge, and advocate future researches use dynamic
          methods to study psychiatric disorders, besides use static methods.

          Introduction

          Modern mainstream view of psychiatry holds the idea that major psychiatric disorders
                                                                       2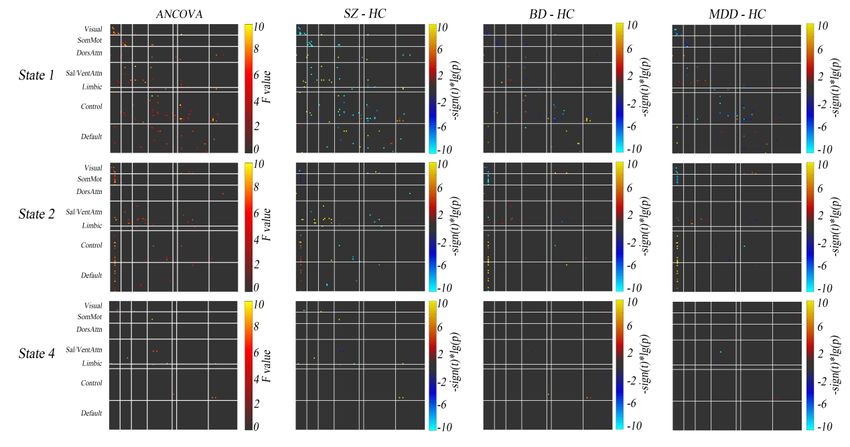
bioRxiv preprint first posted online Jun. 13, 2019; doi: http://dx.doi.org/10.1101/670562. The copyright holder for this preprint
 (which was not peer-reviewed) is the author/funder, who has granted bioRxiv a license to display the preprint in perpetuity.
                              It is made available under a CC-BY-NC-ND 4.0 International license.

          are separate diagnostic categories with distinct etiologies and clinical presentations.
          According to the DSM-V, the major psychiatric disorders are divided into three
          separate diagnostic categories, i.e., schizophrenia (SZ), bipolar disorder (BD), and
          major depressive disorder (MDD). However, existing diagnostic categories are not
          clearly associated with distinct neurobiological abnormalities(1, 2), which may hinder
          the search for biomarkers in psychiatry(3). Major psychiatric disorders have common
          abnormalities in many aspects, including genetic risk and etiology (4, 5), neural
          alterations (6-8), and clinical symptoms (9-11). In addition, co-morbidity among
          psychiatric disorders is very common, with 22% carried 2 diagnoses and 23% carried
          3 or more diagnoses (12). Above mentioned findings together argue that there are no
          clear-cut boundaries between the different mental disorders. In contrast, each distinct
          psychiatric disorder entity is hypothesized to have both broadly shared and distinct
          etiologies and mechanisms among multiple psychiatric disorders (13, 14).
          Transdiagnostic studies are necessary due to they focus on fundamental processes
          underlying multiple disorders, help to explain co-morbidity among disorders, and may
          lead to more effective assessment and treatment of disorders (15-17).

          An important way to apply transdiagnostic models of psychopathology is to uncover
          shared (or common) and distinct (or specific) neurobiological abnormalities across
          several psychiatric disorders. The vast majority of previous studies, however, have
          only compared one specific group of psychiatric disorder with healthy controls (HC).
          In a small number of transdiagnostic studies, many of them are meta-analyses that
          were based on individual studies using different methodologies (6, 8, 18, 19).
          Recently, a few but rapidly growing original transdiagnostic researches have been
          conducted to directly investigate the shared and distinct abnormalities in brain
          structure and functional connectivity (FC) across multiple mental-disorders (20-25).
          For example, a previous study reported disruptions within the frontoparietal control
          network (FPN) may be a shared feature across both SZ and affective psychosis (20),
          which was validated and extended by a recent study (25). In addition, a recent study
                                                                       3
bioRxiv preprint first posted online Jun. 13, 2019; doi: http://dx.doi.org/10.1101/670562. The copyright holder for this preprint
(which was not peer-reviewed) is the author/funder, who has granted bioRxiv a license to display the preprint in perpetuity.
It is made available under a CC-BY-NC-ND 4.0 International license.
found that higher p factor scores and associated risk for common mental illness maps
onto hyperconnectivity between visual association cortex and both FPN and default
mode network (DMN) (23).
Despite the contribution of advancing the transdiagnostic research, with regard to the
studies using FC, these studies assumed that the brain functional properties during the
entire fMRI scan were static but not dynamic. In fact, interactions among large-scale
brain networks are highly dynamic, time-averaged or static connectivity provides
limited information about the functional organization of neural circuits (26, 27).
Therefore, using time-varying or dynamic method to investigate shared and distinct
dysfunction of large-scale FC networks across major psychiatric disorders may
provide more information about their psychopathology. Follow this idea, a few
transdiagnostic studies used dynamic FC to investigate the dynamic functional
architecture of the brain network in healthy young adults or neurobiological
abnormalities of the psychiatric disorders (28-32). For example, a previous study
showed that dynamic FC can found connectivity abnormalities that are not observed
in the static FC, which suggests dynamic FC is more sensitive than static FC (31).
Recently, another transdiagnostic study demonstrated that dynamic FC are quite
reliable within participants (within and across visits), and can act as a fingerprint,
identifying specific individuals within a larger group (28). Although these studies that
using dynamic FC are very important, either their sample size is relatively small
(especially the patient’s groups) or they only studied two diseases (i.e., SZ and BD, or
MDD and bipolar depression).
Here, we used a widely used sliding-window approach (26, 27, 33, 34) to characterize
dynamic FC networks among SZ, BD, MDD and HC (N = 655). Then, we applied
k-means clustering to cluster these dynamic networks into 4 network states. In each
4bioRxiv preprint first posted online Jun. 13, 2019; doi: http://dx.doi.org/10.1101/670562. The copyright holder for this preprint
(which was not peer-reviewed) is the author/funder, who has granted bioRxiv a license to display the preprint in perpetuity.
It is made available under a CC-BY-NC-ND 4.0 International license.
state, we identified shared and distinct dysconnectivity across these psychiatric
disorders compared with HC. We found state-specific, intermittent shared and distinct
disruptions of connectivity. These dysconnectivity tend to only occur in state 1 and
state 2, rather than state 3 and 4. In general, shared dysconnectivity across these 3
psychiatric disorders marked by decreased intra-network connectivity (especially
within FPN), while increased inter-network connectivity between most networks
(especially between visual network (VN) and both FPN and DMN). In addition,
interestingly, almost only SZ has distinct dysconnectivity, and almost all of the
distinct dysconnectivity are between high-level cognitive networks (i.e., between
DMN, SN, FPN and dorsal attention network (DAN)). In respect of time-averaged or
static connectivity, however, we detect only a few significant results compared with
dynamic connectivity.
Results
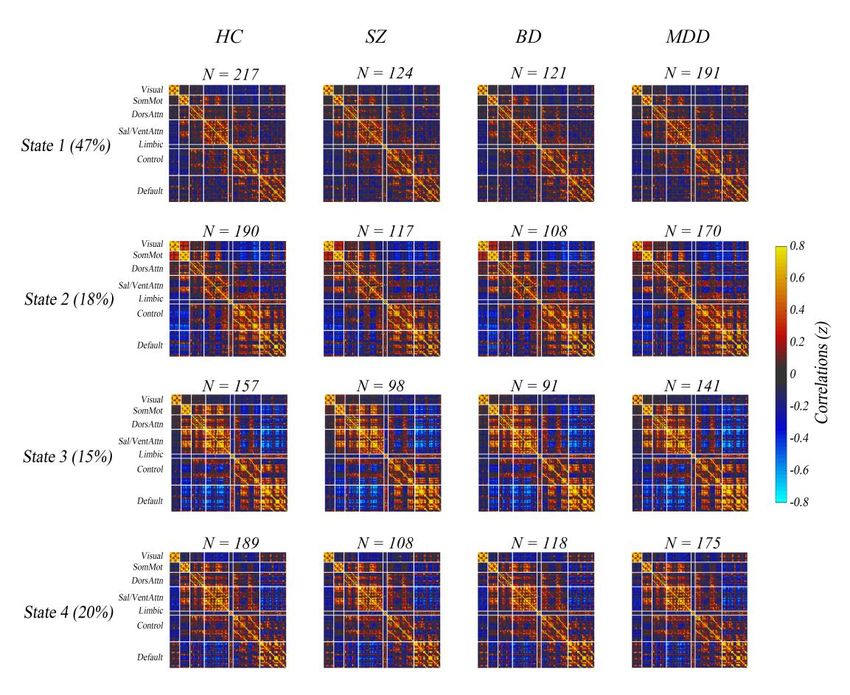
Dynamic Connectivity State. We used sliding-window approach constructed
dynamic connectivity network. Then, we identified four dynamic connectivity
network states using k-means clustering method. Dynamic connectivity matrices in
four states are shown in Figure 1 (the top row). All nodes were grouped into brain
networks to which they belong according functional atlas of Yeo et al. (35). Note that
not all subjects have dynamic windows that are assigned to every state (26, 31, 34, 36).
HC and psychiatric patients had similar network connectivity patterns in the four
states. In state 1, which accounts for the largest proportion (47%) of all time windows,
the network configuration was similar to static network configuration, which
presented both weak positive and weak negative connectivity. In contrast to state 1,
both positive and negative connectivity in state 3 was strong. In state 2, connectivity
between VN and most nodes in FPN as well as that between VN and DMN was
strongly negative, and connectivity between VN and sensorimotor network (SMN)
was relatively strongly positive. Connectivity pattern in state 4 was seems to between
5bioRxiv preprint first posted online Jun. 13, 2019; doi: http://dx.doi.org/10.1101/670562. The copyright holder for this preprint
(which was not peer-reviewed) is the author/funder, who has granted bioRxiv a license to display the preprint in perpetuity.
It is made available under a CC-BY-NC-ND 4.0 International license.
state 1 and 3.
Shared Dynamic Dysconnectivity Across Psychiatric Disorders. Figure 2 shows
the results of ANCOVA and post-hoc two-sample t-tests for dynamic connectivity. In
state 3 (both positive and negative connectivity was strong), no connectivity showed
differences between groups. Based on the statistical results in state 1, 2 and 4, we
identified the shared and distinct dysconnectivity across the three diseases. The first
column in Figure 3 showed the shared dysconnectivity (see Figure S8 and Table S2 in
Supplementary Materials for the unique identification number and name of each
node).
In state 1, interestingly, all within-network dysconnectivity were hypoconnectivity,
but almost all of the between-network connectivity were hyperconnectivity, with
exception of a few pairs of connectivity between SN and other networks (i.e., FPN,
DMN and SMN) and between FPN and DAN. Specially, in state 1, SZ, BD and MDD
shared hypoconnectivity within FPN, SN, VN and SMN, whereas hyperconnectivity
between most networks.
In state 2, shared dysconnectivity across the three diseases was marked by
hyperconnectivity between VN and other networks (i.e., FPN and DMN). On the
contrary, all within-VN connectivity were hypoconnectivity across the three groups.
Besides, in state 2, we also found shared hyperconnectivity between SN and both
DAN and SMN, but hypoconnectivity between SN and FPN. In state 4, we only
detected one hyperconnectivity between DMN and FPN.
6bioRxiv preprint first posted online Jun. 13, 2019; doi: http://dx.doi.org/10.1101/670562. The copyright holder for this preprint
(which was not peer-reviewed) is the author/funder, who has granted bioRxiv a license to display the preprint in perpetuity.
It is made available under a CC-BY-NC-ND 4.0 International license.
Distinct Dynamic Dysconnectivity among Psychiatric Disorders. In terms of the
quantity of dysconnectivity, only the SZ had obvious distinct dysconnectivity. BD and
MDD almost had no distinct dysconnectivity (the last 3 columns in Figure 3), which
means that almost all of the dysconnectivity in BD and MDD were shared by at least
two of patients’ groups.
In state 1, almost all of the distinct dysconnectivity in SZ were between higher-order
cognitive networks (i.e., DMN, SN and DAN). Specifically, SZ mainly showed
hyperconnectivity between DMN and SN, while hypoconnectivity between DMN and
DAN.
In state 2, also almost all of the distinct dysconnectivity in SZ were between
higher-order cognitive networks (i.e., DMN, SN, DAN and FPN). Specifically, SZ
mainly showed hypoconnectivity between DMN and DAN, and between SN and FPN.
In addition, we also observed five pairs of hyperconnectivity between SN and DAN,
which was significantly more than the quantity of shared hyperconnectivity between
these two networks in the same state.
In state 4, SZ mainly showed hyperconnectivity between SN and other networks (i.e.,
DMN, VN and SMN).
Gradient in the Extent of Shared Dynamic Dysconnectivity across Psychiatric
Disorders. Figures S3-S7 display the mean z values of all dysconnectivity in state 1,
2 and 4 for 4 groups. In state 1, the extent of abnormality in SZ is the greatest in most
(23/38) shared dynamic dysconnectivity. In most (25/38) shared dynamic
7bioRxiv preprint first posted online Jun. 13, 2019; doi: http://dx.doi.org/10.1101/670562. The copyright holder for this preprint
(which was not peer-reviewed) is the author/funder, who has granted bioRxiv a license to display the preprint in perpetuity.
It is made available under a CC-BY-NC-ND 4.0 International license.
dysconnectivity, the extent of abnormality in BD was greater than that in MDD.
Consequently, a gradient in the extent of abnormality was SZ>BD>MDD in most
shared dynamic dysconnectivity in state 1.
In state 2, however, the extent of abnormality in BD is the greatest in most (13/22)
shared dynamic dysconnectivity. In most (14/22) shared dynamic dysconnectivity, the
extent of abnormality in MDD was greater than that in SZ. Consequently, a gradient
in the extent of abnormality was BD>MDD>SZ in most shared dynamic
dysconnectivity in state 2.
In state 4, a gradient in the extent of abnormality was SZ>BD>MDD in
dysconnectivity between control and default mode network.
Discussion
The present study is the first to examine the dynamic FC in three major psychiatric
disorders, SZ, BD, and MDD, at relatively large sample size in a single site. We
explored dynamic FC patterns using sliding-window approach and k-means clustering.
Our study had four main findings. (1) Patients showed significant dysconnectivity
only in state 1 and 2, rather than state 3 and 4. (2) Shared dysconnectivity that cross
traditional diagnostic categories were that overall decreased intra-network
connectivity, especially those within FPN, while increased inter-network connectivity,
especially those between VN and both FPN and DMN. (3) Among the three
psychiatric disorders, only SZ had significant distinct dysconnectivity, and all these
distinct dysconnectivity were between high-level cognitive networks, i.e., DMN, SN,
FPN and DAN. (4) Most of the dysconnectivity cannot be detected by time-averaged
FC. Collectively, these results support and advance current knowledge regarding
8bioRxiv preprint first posted online Jun. 13, 2019; doi: http://dx.doi.org/10.1101/670562. The copyright holder for this preprint
(which was not peer-reviewed) is the author/funder, who has granted bioRxiv a license to display the preprint in perpetuity.
It is made available under a CC-BY-NC-ND 4.0 International license.
transdiagnostic findings across psychiatric disorders, and strongly advocate the
application of time-varying or dynamic methods to explore the dysfunction of FC in
psychiatric disorders.
State-specific and Network-specific Dysconnectivity. State-specific and transient
dysfunction of large-scale cortical networks in psychiatric disorders was also found
by previous studies and these dysconnectivity preferentially evident during the
expression of particular network configurations (28, 31, 34). In the present study, as
shown in Figure 3 and Figure S1, there was almost no difference between psychiatric
patients and HC in state 3 and state 4. All the dysfunction of connectivity in patients
was only manifested in state 1 and state 2. In addition, the pattern of abnormal
connectivity between state 1 and state 2 was also obviously different, expressed as
network specificity in specific state. In state 1, which accounts for the largest
proportion (47%) of all time windows and in which the connectivity pattern resemble
those of static FC, dysconnectivity were widely distributed. However, in state 2, in
which the VN had both strongest positive and negative connectivity with other
networks, dysconnectivity were very limited that almost only between VN and other
networks, e.g. FPN and DMN. Together with previous studies, the present study
suggests that FC disruptions in psychosis may be an intermittent disruption, rather
than a time-invariant global abnormality during a whole resting-state scan.
Advantages of a Dynamic Analysis. Our viewpoint was supported by previous
studies advocating advantages of a dynamic approach (28, 31, 34, 37). In fact,
intrinsic fluctuations are a hallmark of neural activity, which emergent over time
scales spanning milliseconds and tens of minutes (26). Previous research has
established that individuals freely engage in various states of mental activity during
the measurement period, e.g. resting-state scan (38). In the present study, we clustered
the interaction between brain regions into four states according to the whole-brain
9bioRxiv preprint first posted online Jun. 13, 2019; doi: http://dx.doi.org/10.1101/670562. The copyright holder for this preprint
(which was not peer-reviewed) is the author/funder, who has granted bioRxiv a license to display the preprint in perpetuity.
It is made available under a CC-BY-NC-ND 4.0 International license.
dynamic connectome. Many dysconnectivity that found by dynamic analysis were not
found by time-averaged analysis. A speculative explanation is that in the present
study the connectivity in normal mental states (i.e., state 3 and 4) may "neutralize"
those at abnormal mental states (state 1 and 2), making the time-averaged or static
connectivity shows no abnormal. Future researches need to test this hypothesis.
Decreased Intra-network and Increased Inter-network Connectivity May be an
Important Transdiagnostic Characteristic. Overall, in present study, the
dysfunction of dynamic connectivity across these three psychiatric disorders
manifested as decreased intra-network but increased inter-network connectivity. The
decreased intra-network connectivity was mainly expressed in state 1, in which the
abnormality of FPN was the most obvious. This finding is consistent with that of
previous studies which found decreased FC within FPN in multiple psychiatric
disorders (25, 39) as well as in SZ (40-42), BD (43, 44) and MDD (45-47). The FPN
is the core hub for cognitive control, adaptive implementation of task demands and
goal-directed behavior (48-51). Reduced intra-network integration (or intra-network
modularity(52)) in FPN may be responsible for cognitive dysfunction, one of the most
prominent transdiagnostic characteristics of psychiatric disorders (8, 16).
Although the abnormality of FPN is the most obvious, SN, VN and SMN also showed
transdiagnostic decreased intra-network connectivity in state 1. These findings also
match those observed in earlier studies that found abnormality in salience (6, 53), VN
and SMN (22, 23, 54) in psychiatric disorders. Together, these findings suggest that
the intra-network integration is decreased in patients with psychiatric disorders, at
least within FPN, SN, VN and SMN.
10bioRxiv preprint first posted online Jun. 13, 2019; doi: http://dx.doi.org/10.1101/670562. The copyright holder for this preprint
(which was not peer-reviewed) is the author/funder, who has granted bioRxiv a license to display the preprint in perpetuity.
It is made available under a CC-BY-NC-ND 4.0 International license.
In contrast, most inter-network dysconnectivity were increased, especially between
VN and both FPN and DMN. These disruptions were almost only expressed in state 2
in which the negative connectivity between VN and both FPN and DMN was
strongest. While the dysconnectivity between VN and other networks are not often
thought of as primary to dysfunction in psychopathology by early researches, this
finding was in line with that of a recent work (23). This study performed a novel
connectome-wide association study (CWAS) of the p factor (a single general
transdiagnostic factor associated with risk for all common forms of mental illness)
using multidimensional matrix regression (MDMR) in 605 university students (133
met criteria for substance abuse or a mental illness). They found that
hyperconnectivity between the visual association cortex and the heteromodal FPN and
DMN was correlated with higher p factor scores. Considering that the patients’ groups
of the present study were all psychiatric patients, our finding support and expand the
recent study, suggesting that the more effortful or less efficient integration of
bottom-up visual sensory information with attentional demands and executive control
processes not only in those at higher risk for psychiatric disorders, but also in those
already suffering from psychiatric disorders. This represents the possibility of a trait
in multiple psychiatric disorders.
SZ had the Most Distinct Dysconnectivity that were Inter-network
Dysconnectivity between High-level Cognitive Networks. In the present study, we
found SZ not only had almost all dysconnectivity that BD and MDD had, but also had
dysconnectivity that BD and MDD did not have. When integrating the information in
Figure 3 and Figure S1 which shown the shared dysconnectivity across the three
disorders and any two of the diseases respectively, our findings further illustrated that
dysconnectivity in BD and MDD seem to be two similar but not identical parts that all
were divided up from those of SZ. This finding was partially supported by previous
studies (21, 22, 30) that reported psychiatric disorders have more shared but less
11bioRxiv preprint first posted online Jun. 13, 2019; doi: http://dx.doi.org/10.1101/670562. The copyright holder for this preprint
(which was not peer-reviewed) is the author/funder, who has granted bioRxiv a license to display the preprint in perpetuity.
It is made available under a CC-BY-NC-ND 4.0 International license.
distinct brain abnormality and SZ has the most obvious abnormality. Together with
previous studies, this finding support the idea that SZ, BD and MDD may be a
transdiagnostic continuum of major endogenous psychoses (55), with SZ have more
dysconnectivity.
Intriguingly, almost all these distinct dysconnectivity in SZ were between high-level
cognitive networks. The distinct dysconnectivity was characterized by
hypoconnectivity between DMN and DAN, whereas hyperconnectivity between
DMN and SN networks. The DMN supports internally oriented attention and
self-monitoring, among other functions, whose activity is high when the brain system
is engaged in autobiographical memory retrieval, envisioning the future, and
conceiving the perspectives of others, while low when the brain system is engaged in
specific behavioral tasks on the external environment (56-58). In contrast to DMN,
the SN and DAN are responsible for control attentional processes in relation to
bottom-up sensory stimulation and top-down goals respectively (59, 60). Given the
functions of the three networks mentioned above, this finding may reflect that the
inappropriate communication of internal and external cognition is more likely to be a
distinct/specific feature of SZ. These findings are consistent with previous studies
found psychosis was correlated dysconnectivity between the DMN and task-positive
networks (i.e., SN, DAN, and FPN) (2, 61).
Conclusion. We performed, to our knowledge, the first time-varying functional
connectivity analyses in HC, SZ, BD and MDD in a single study at relatively large
sample size. We used the same scanner and acquisition sequence for all participants,
ensuring comparability of the data across multiple psychiatric disorders. We highlight
the following three key findings. First of all, FC disruptions in psychosis may be
state-specific and intermittent, rather than a time-invariant global abnormality at least
during a scan. Secondly, both decreased intra-network integration and decreased
inter-network segregation (especially within FPN and between VN and both DMN
12bioRxiv preprint first posted online Jun. 13, 2019; doi: http://dx.doi.org/10.1101/670562. The copyright holder for this preprint
(which was not peer-reviewed) is the author/funder, who has granted bioRxiv a license to display the preprint in perpetuity.
It is made available under a CC-BY-NC-ND 4.0 International license.
and FPN) may be the important transdiagnostic substrate across the three psychiatric
disorders. Lastly, almost all dysconnectivity in BD and MDD were contained in those
in SZ, with SZ had more dysconnectivity that only involving inter-network
dysconnectivity between high-level cognitive networks. These findings support and
shed new light on the current knowledge about transdiagnostic findings, and strongly
advocate that future researches should use dynamic methods to study psychiatric
disorders, besides use static methods.
Materials and Methods
Participants. The study was approved by the Institutional Review Board of China
Medical University. All participants provided written informed consent after receiving
a detailed description of the study. Demographics, clinical characteristics, and
cognitive function of included participants are summarized in Table S1. Six hundred
and seventy-eight individuals participated in this study. We finally included 655
participants (see Data Preprocessing section for detail; ages 13–45 years), including
125 with SZ, 121 with BD, 192 with MDD, and 217 healthy controls. The study was
approved by the Institutional Review Board of China Medical University. All
participants provided written informed consent after receiving a detailed description
of the study. All participants with SZ, BD, and MDD were recruited from the
inpatient and outpatient services at the Shenyang Mental Health Center and the
Department of Psychiatry, the First Affiliated Hospital of China Medical University,
Shenyang, China. Healthy controls participants were recruited from the local
community by advertisement.
The presence or absence of Axis I psychiatric diagnoses was determined by two
trained psychiatrists using the Structured Clinical Interview for Diagnostic and
13bioRxiv preprint first posted online Jun. 13, 2019; doi: http://dx.doi.org/10.1101/670562. The copyright holder for this preprint
(which was not peer-reviewed) is the author/funder, who has granted bioRxiv a license to display the preprint in perpetuity.
It is made available under a CC-BY-NC-ND 4.0 International license.
Statistical Manual of Mental Disorders, Fourth Edition (DSM-IV) Axis I Disorders
for the participants 18 years and older, while using the Schedule for Affective
Disorders and Schizophrenia for School-Age Children-present and Lifetime Version
(K-SADS-PL) for participants younger than 18 years. Patients with SZ, BD, or MDD
must met the DSM-IV diagnostic criteria for SZ, BD, or MDD, respectively, and no
other Axis I disorders. Healthy controls did not have a current or lifetime history of an
Axis I disorder or a history of psychotic, mood, or other Axis I disorders in
first-degree relatives, as determined from a detailed family history. Participants were
excluded for (1) lifetime substance/alcohol abuse or dependence, (2) the presence of a
concomitant major medical disorder, (3) any MRI contraindications, (4) a history of
head trauma with loss of consciousness ≥5 minutes or any neurological disorder, and
(5) any abnormality identified by T1-and T2-weighted image. Symptoms and
cognitive measures were obtained using the Brief Psychiatric Rating Scale (BPRS),
Hamilton Depression Rating Scale (HAMD), Hamilton Anxiety Rating Scale (HAMA)
and Young Mania Rating Scale (YMRS), and Wisconsin Card Sorting Test (WCST).
MRI Acquisition. MRI data were acquired using a GE Signa HD 3.0-T scanner
(General Electric, Milwaukee, WI) with a standard 8-channel head coil at the First
Affiliated Hospital of China Medical University. Functional images were collected
using a gradient-echo planar imaging (EPI-GRE) sequence. The following parameters
were used: interleaved scanning, repetition time = 2000 ms, echo time = 30 ms, flip
angle = 90°, field of view = 240 mm × 240 mm, and matrix = 64 × 64, slice thickness
= 3 mm without a gap, number of slices = 35. The scan lasted 6 minutes and 40
seconds, resulting in 200 volumes. Participants were instructed to rest and relax with
their eyes closed but to remain awake during scanning.
Data Preprocessing. All images were preprocessed using SPM12
(www.fil.ion.ucl.ac.uk/spm/) and DPABI (62), like previous studies. Volumes at the
14bioRxiv preprint first posted online Jun. 13, 2019; doi: http://dx.doi.org/10.1101/670562. The copyright holder for this preprint
(which was not peer-reviewed) is the author/funder, who has granted bioRxiv a license to display the preprint in perpetuity.
It is made available under a CC-BY-NC-ND 4.0 International license.
first 10 time points were discarded. The subsequent preprocessing steps included slice
time correction and head motion correction. During head motion correction, 23
subjects (9 with SCZ, 6 with BD, 4 with MDD, and 4 healthy controls) were excluded
from subsequent analyses due to excessive head motion, based on a criterion of 3 mm
or 3°. No significant differences in mean framewise displacement (FD) were observed
among these groups (P = .151). The corrected functional images were spatially
normalized to the Montreal Neurological Institute space using the EPI template in
SPM12, and resampled to 3 mm × 3 mm × 3 mm isotropic voxels, and further
smoothed via a Gaussian kernel with a 4-mm full-width at half-maximum. Then we
performed linear detrending and temporal band-pass filtering (0.01–0.01 Hz) to
reduce low-frequency drift and high-frequency noise. Next, several confounding
covariates, including the Friston-24 head motion parameters, white matter,
cerebrospinal fluid, and global signals, were regressed from the BOLD time series for
all voxels. Finally, BOLD series were despiking by replaced the outliners (detected
based on the median absolute deviation) with the best estimate using a third-order
spline fit to clean the portions of time course implemented in 3dDespike
(http://afni.nimh.nih.gov/afni).
Dynamic Connectivity Analysis. Average BOLD time series of 114 nodes within the
17-network functional atlas of Yeo et al. (35) were extracted. Dynamic Connectivity
was estimated with a widely used sliding-window approach. Pearson’s correlation
coefficients were calculated between each pair of nodes using segments of the time
series within a time window. The window had a width of 17 TRs (i.e., 34 s) and slide
on time with a time step of 1 TR (i.e., 2 s). Previous study (63) suggests that a
sliding-window width range of 30–60 s is appropriate for dynamic connectivity
analyses. This previous study also revealed consistent state solution stability across
varying sliding-window sizes of 33–63 s. Consequently, 17 TRs (i.e., 34 s) width
were chosen in order to maximize signal estimates, while still capturing properties of
15bioRxiv preprint first posted online Jun. 13, 2019; doi: http://dx.doi.org/10.1101/670562. The copyright holder for this preprint
(which was not peer-reviewed) is the author/funder, who has granted bioRxiv a license to display the preprint in perpetuity.
It is made available under a CC-BY-NC-ND 4.0 International license.
transient functional connectivity. Then, for each participant, we obtained a total of
174 windows, each of which had (114×113)/2 = 6,441 unique functional connectives.
Finally, Fisher r-to-z transformation was performed for all functional connectivity.
Clustering Analysis. K-means algorithm can identify sets of time-varying network
configurations in different windows with common features, grouping them into
clusters that are more similar to each other than to configurations in other clusters. A
previous (28) study applied k-means clustering to identify possible dissociable
network configurations in solutions from 2 to 20 brain states in healthy people. Their
results indicate relative stability in state solutions from 2 to 8, with 2-, 4-, 5-, and
8-state solutions showing points of increased stability, and they chose the four-state
solution for following analyses due to the stability of the associated clustering
solution and the relatively high within-participant reliability. According to previous
study, we first apply k-means clustering to cluster these dynamic connectivity
networks into 4 network states. Our k-means clustering used the city distance (L1
distance) function with 100 times to repeat clustering using new initial cluster
centroid positions to increase chances of escaping local minima. We selected k (k = 4)
seeds by implementing the k-means++ algorithm for cluster center initialization for
each iteration of the 100 times repeat clustering. The input of k-means clustering were
a n_instances-by-n_fc matrix, where n_instances was equal to the number of sliding
windows (n = 174) multiplied by the sample size (n = 655), and n_fc was equal to the
6,441 unique functional connectivity. The resulted cluster medians (centroid) were
regarded as FC states in group level. For each participant, each state was regarded as
the median of those windowed FC networks that had the same cluster index (index =
1, 2, 3 or 4). Given that we propagated group cluster indices to the subject level, not
all subjects have dynamic windows that are assigned to every state (26, 31, 34, 36).
16bioRxiv preprint first posted online Jun. 13, 2019; doi: http://dx.doi.org/10.1101/670562. The copyright holder for this preprint
(which was not peer-reviewed) is the author/funder, who has granted bioRxiv a license to display the preprint in perpetuity.
It is made available under a CC-BY-NC-ND 4.0 International license.
Static Connectivity Analysis. Average BOLD time series of 114 nodes within the
17-network functional atlas of Yeo et al. (35) were extracted for each individual by
averaging the whole time series throughout all voxels in each node. Static functional
connectivity between each pair of nodes was calculated using Pearson’s correlation
analysis, producing (114×113)/2=6,441 unique functional connectives for each
subject. Fisher r-to-z transformation was performed for all functional connectives
(correlation coefficients) to improve the normality of the correlation coefficients. See
Supplementary Materials for results of static analyses.
Statistical Analysis. Group effects on each pair of static and dynamic connectivity
were examined using one-way analysis of covariance (ANCOVA), with age and
gender as covariates. Post hoc analyses two-sample t-tests were performed for
significant group effects in the ANCOVA to determine the shared and distinct
dysconnectivity across the SZ, BD, and MDD groups, which were applied in
pair-wise fashion with the HC group as the common comparison. We used
false-discovery rate (FDR) to perform multiple comparison correction for both the
ANCOVA and post-hoc analyses (q < 0.05). Shared dysconnectivity were thought to
be those where all three patients’ groups have either hypoconnectivity or
hyperconnectivity compared with HC. Besides, we also identified the shared
dysconnectivity across any two of the diseases (Supplementary Figure S1). Distinct
dysconnectivity of one patient group were thought to be those where only one patient
group have abnormal compared with HC. Finally, we count the quantity of
dysconnectivity in which each node or network involved in all states with
dysconnectivity (see Figure S10).
Effects of Medication on FC. Considering that most patients have been treated with
medications, an important question was whether medications influenced functional
17bioRxiv preprint first posted online Jun. 13, 2019; doi: http://dx.doi.org/10.1101/670562. The copyright holder for this preprint
(which was not peer-reviewed) is the author/funder, who has granted bioRxiv a license to display the preprint in perpetuity.
It is made available under a CC-BY-NC-ND 4.0 International license.
connectivity. We compared the functional connectivity between medicated and
un-medicated patients using ANCOVA, with age and gender as covariates
(false-discovery rate (FDR), q < 0.05; comparison times = 6441). Because of the low
sensitivity of static connectivity analysis (Figure S2) in the present study, our focus
was on dynamic connectivity. Consequently, we only analyzed the effect of
medications on dynamic connectivity. We found no statistical difference in dynamic
connectivity in state 1, 2 and 4 between the medicated and un-medicated patients
(because no statistical difference among the four groups in dynamic connectivity in
state 3, we discarded the analysis of state 3). Figure S9 displays the F value map.
Validation Analysis. First, we also used width of 18 TRs (i.e., 36 s) to construct
dynamic connectivity network. We also cluster these dynamic connectivity networks
into 4 network states using as the same methods and parameters as those of 17 TRs.
Then we calculated the Pearson's correlation coefficients in FC values between 20
TRs and 17 TRs. The best coefficient range from 0.9983 to 0.9999, showing very
good consistency and robustness (see Supplementary Figure S11).
Data availability. The data used in the present study can be accessed upon request to
the corresponding authors. All analysis code is available here:
https://github.com/lichao312214129/lc_rsfmri_tools_matlab.
Acknowledgements
This study was funded by National Science Fund for Distinguished Young Scholars
(81725005 to F.W.), National Natural Science Foundation of China (81571311 to
Y.T., 81571331 to F.W.), National Key Research and Development Program
(2018YFC1311604 to Y.T., 2016YFC1306900 to Y.T., 2016YFC0904300 to F.W.),
National High Tech Development Plan (863) (2015AA020513 to F.W.), Liaoning
18bioRxiv preprint first posted online Jun. 13, 2019; doi: http://dx.doi.org/10.1101/670562. The copyright holder for this preprint
(which was not peer-reviewed) is the author/funder, who has granted bioRxiv a license to display the preprint in perpetuity.
It is made available under a CC-BY-NC-ND 4.0 International license.
Science and Technology Project (2015225018 to Y.T.), Liaoning Education
Foundation (Pandeng Scholar to F.W.), Innovation Team Support Plan of Higher
Education of Liaoning Provience (LT2017007 to F.W.), Major Special Construction
plan of China Medical University (3110117059 to F.W.).
19bioRxiv preprint first posted online Jun. 13, 2019; doi: http://dx.doi.org/10.1101/670562. The copyright holder for this preprint
(which was not peer-reviewed) is the author/funder, who has granted bioRxiv a license to display the preprint in perpetuity.
It is made available under a CC-BY-NC-ND 4.0 International license.
References
1. Insel TR, Cuthbert BN (2015): Brain disorders? Precisely. Science. 348:499-500.
2. Xia CH, Ma Z, Ciric R, Gu S, Betzel RF, Kaczkurkin AN, et al. (2018): Linked dimensions of
psychopathology and connectivity in functional brain networks. Nature communications. 9:3003.
3. Singh I, Rose N (2009): Biomarkers in psychiatry. Nature. 460:202.
4. Consortium C-DGotPG (2013): Identification of risk loci with shared effects on five major
psychiatric disorders: a genome-wide analysis. The Lancet. 381:1371-1379.
5. Lee SH, Ripke S, Neale BM, Faraone SV, Purcell SM, Perlis RH, et al. (2013): Genetic relationship
between five psychiatric disorders estimated from genome-wide SNPs. Nature genetics. 45:984.
6. Goodkind M, Eickhoff SB, Oathes DJ, Jiang Y, Chang A, Jones-Hagata LB, et al. (2015):
Identification of a common neurobiological substrate for mental illness. JAMA psychiatry. 72:305-315.
7. McTeague LM, Huemer J, Carreon DM, Jiang Y, Eickhoff SB, Etkin A (2017): Identification of
common neural circuit disruptions in cognitive control across psychiatric disorders. American Journal
of Psychiatry. 174:676-685.
8. Sha Z, Wager TD, Mechelli A, He Y (2019): Common Dysfunction of Large-Scale Neurocognitive
Networks Across Psychiatric Disorders. Biological psychiatry. 85:379-388.
9. Levit-Binnun N, Davidovitch M, Golland Y (2013): Sensory and motor secondary symptoms as
indicators of brain vulnerability. Journal of Neurodevelopmental Disorders. 5:26.
10. Barch DM, Sheffield JM (2014): Cognitive impairments in psychotic disorders: common
mechanisms and measurement. World Psychiatry. 13:224-232.
11. Lee R, Hermens D, Naismith S, Lagopoulos J, Jones A, Scott J, et al. (2015): Neuropsychological
and functional outcomes in recent-onset major depression, bipolar disorder and
schizophrenia-spectrum disorders: a longitudinal cohort study. Translational psychiatry. 5:e555.
12. Kessler RC, Chiu WT, Demler O, Walters EE (2005): Prevalence, severity, and comorbidity of
12-month DSM-IV disorders in the National Comorbidity Survey Replication. Archives of general
psychiatry. 62:617-627.
13. Lahey BB, Zald DH, Hakes JK, Krueger RF, Rathouz PJ (2014): Patterns of heterotypic continuity
associated with the cross-sectional correlational structure of prevalent mental disorders in adults.
JAMA psychiatry. 71:989-996.
14. Cuthbert BN, Insel TR (2013): Toward the future of psychiatric diagnosis: the seven pillars of
RDoC. BMC medicine. 11:126.
15. Nolen-Hoeksema S, Watkins ER (2011): A heuristic for developing transdiagnostic models of
psychopathology: Explaining multifinality and divergent trajectories. Perspectives on Psychological
Science. 6:589-609.
16. Caspi A, Houts RM, Belsky DW, Goldman-Mellor SJ, Harrington H, Israel S, et al. (2014): The p
factor: one general psychopathology factor in the structure of psychiatric disorders? Clinical
Psychological Science. 2:119-137.
17. Husain M (2017): Transdiagnostic neurology: neuropsychiatric symptoms in neurodegenerative
diseases. Brain. 140:1535-1536.
18. Wise T, Radua J, Via E, Cardoner N, Abe O, Adams T, et al. (2017): Common and distinct patterns
of grey-matter volume alteration in major depression and bipolar disorder: evidence from voxel-based
meta-analysis. Molecular psychiatry. 22:1455.
20bioRxiv preprint first posted online Jun. 13, 2019; doi: http://dx.doi.org/10.1101/670562. The copyright holder for this preprint
(which was not peer-reviewed) is the author/funder, who has granted bioRxiv a license to display the preprint in perpetuity.
It is made available under a CC-BY-NC-ND 4.0 International license.
19. Brandl F, Avram M, Weise B, Shang J, Simões B, Bertram T, et al. (2019): Specific Substantial
Dysconnectivity in Schizophrenia: A Transdiagnostic Multimodal Meta-analysis of Resting-State
Functional and Structural Magnetic Resonance Imaging Studies. Biological psychiatry. 85:573-583.
20. Baker JT, Holmes AJ, Masters GA, Yeo BT, Krienen F, Buckner RL, et al. (2014): Disruption of
cortical association networks in schizophrenia and psychotic bipolar disorder. JAMA psychiatry.
71:109-118.
21. Chang M, Womer FY, Edmiston EK, Bai C, Zhou Q, Jiang X, et al. (2017): Neurobiological
commonalities and distinctions among three major psychiatric diagnostic categories: a structural MRI
study. Schizophrenia bulletin. 44:65-74.
22. Xia M, Womer FY, Chang M, Zhu Y, Zhou Q, Edmiston EK, et al. (2018): Shared and distinct
functional architectures of brain networks across psychiatric disorders. Schizophrenia bulletin.
45:450-463.
23. Elliott ML, Romer A, Knodt AR, Hariri AR (2018): A connectome-wide functional signature of
transdiagnostic risk for mental illness. Biological psychiatry. 84:452-459.
24. Gong Q, Scarpazza C, Dai J, He M, Xu X, Shi Y, et al. (2019): A transdiagnostic neuroanatomical
signature of psychiatric illness. Neuropsychopharmacology. 44:869.
25. Baker JT, Dillon DG, Patrick LM, Roffman JL, Brady RO, Pizzagalli DA, et al. (2019): Functional
connectomics of affective and psychotic pathology. Proceedings of the National Academy of Sciences.
116:9050-9059.
26. Allen EA, Damaraju E, Plis SM, Erhardt EB, Eichele T, Calhoun VD (2014): Tracking whole-brain
connectivity dynamics in the resting state. Cereb Cortex. 24:663-676.
27. Calhoun VD, Miller R, Pearlson G, Adalı T (2014): The chronnectome: time-varying connectivity
networks as the next frontier in fMRI data discovery. Neuron. 84:262-274.
28. Reinen JM, Chen OY, Hutchison RM, Yeo BTT, Anderson KM, Sabuncu MR, et al. (2018): The
human cortex possesses a reconfigurable dynamic network architecture that is disrupted in psychosis.
Nat Commun. 9:1157.
29. Pang Y, Chen H, Wang Y, Long Z, He Z, Zhang H, et al. (2018): Transdiagnostic and
diagnosis-specific dynamic functional connectivity anchored in the right anterior insula in major
depressive disorder and bipolar depression. Prog Neuropsychopharmacol Biol Psychiatry. 85:7-15.
30. Wang J, Wang Y, Huang H, Jia Y, Zheng S, Zhong S, et al. (2019): Abnormal dynamic functional
network connectivity in unmedicated bipolar and major depressive disorders based on the
triple-network model. Psychological medicine.1-10.
31. Rashid B, Damaraju E, Pearlson GD, Calhoun VD (2014): Dynamic connectivity states estimated
from resting fMRI Identify differences among Schizophrenia, bipolar disorder, and healthy control
subjects. Front Hum Neurosci. 8:897.
32. Han S, He Z, Duan X, Tang Q, Chen Y, Yang Y, et al. (2019): Dysfunctional connectivity between
raphe nucleus and subcortical regions presented opposite differences in bipolar disorder and major
depressive disorder. Progress in Neuro-Psychopharmacology and Biological Psychiatry. 92:76-82.
33. Hutchison RM, Womelsdorf T, Allen EA, Bandettini PA, Calhoun VD, Corbetta M, et al. (2013):
Dynamic functional connectivity: promise, issues, and interpretations. Neuroimage. 80:360-378.
34. Damaraju E, Allen EA, Belger A, Ford JM, McEwen S, Mathalon D, et al. (2014): Dynamic
functional connectivity analysis reveals transient states of dysconnectivity in schizophrenia.
NeuroImage: Clinical. 5:298-308.
21bioRxiv preprint first posted online Jun. 13, 2019; doi: http://dx.doi.org/10.1101/670562. The copyright holder for this preprint
(which was not peer-reviewed) is the author/funder, who has granted bioRxiv a license to display the preprint in perpetuity.
It is made available under a CC-BY-NC-ND 4.0 International license.
35. Yeo BT, Krienen FM, Sepulcre J, Sabuncu MR, Lashkari D, Hollinshead M, et al. (2011): The
organization of the human cerebral cortex estimated by intrinsic functional connectivity. J
Neurophysiol. 106:1125-1165.
36. Liu F, Wang Y, Li M, Wang W, Li R, Zhang Z, et al. (2017): Dynamic functional network connectivity
in idiopathic generalized epilepsy with generalized tonic-clonic seizure. Hum Brain Mapp. 38:957-973.
37. Rashid B, Arbabshirani MR, Damaraju E, Cetin MS, Miller R, Pearlson GD, et al. (2016):
Classification of schizophrenia and bipolar patients using static and dynamic resting-state fMRI brain
connectivity. Neuroimage. 134:645-657.
38. Delamillieure P, Doucet G, Mazoyer B, Turbelin M-R, Delcroix N, Mellet E, et al. (2010): The
resting state questionnaire: an introspective questionnaire for evaluation of inner experience during
the conscious resting state. Brain research bulletin. 81:565-573.
39. Baker JT, Holmes AJ, Masters GA, Yeo BT, Krienen F, Buckner RL, et al. (2014): Disruption of
cortical association networks in schizophrenia and psychotic bipolar disorder. JAMA Psychiatry.
71:109-118.
40. MacDonald III AW, Carter CS, Kerns JG, Ursu S, Barch DM, Holmes AJ, et al. (2005): Specificity of
prefrontal dysfunction and context processing deficits to schizophrenia in never-medicated patients
with first-episode psychosis. American Journal of Psychiatry. 162:475-484.
41. Perlstein WM, Carter CS, Noll DC, Cohen JD (2001): Relation of prefrontal cortex dysfunction to
working memory and symptoms in schizophrenia. American Journal of Psychiatry. 158:1105-1113.
42. Barch DM, Carter CS, MacDonald III AW, Braver TS, Cohen JD (2003): Context-processing deficits
in schizophrenia: diagnostic specificity, 4-week course, and relationships to clinical symptoms. Journal
of abnormal psychology. 112:132.
43. Anticevic A, Brumbaugh MS, Winkler AM, Lombardo LE, Barrett J, Corlett PR, et al. (2013): Global
prefrontal and fronto-amygdala dysconnectivity in bipolar I disorder with psychosis history. Biological
psychiatry. 73:565-573.
44. Anticevic A, Cole MW, Repovs G, Murray JD, Brumbaugh MS, Winkler AM, et al. (2013):
Characterizing thalamo-cortical disturbances in schizophrenia and bipolar illness. Cerebral cortex.
24:3116-3130.
45. Pizzagalli DA (2011): Frontocingulate dysfunction in depression: toward biomarkers of treatment
response. Neuropsychopharmacology. 36:183.
46. Holmes AJ, Pizzagalli DA (2008): Spatiotemporal dynamics of error processing dysfunctions in
major depressive disorder. Archives of general psychiatry. 65:179-188.
47. Holmes AJ, Pizzagalli DA (2008): Response conflict and frontocingulate dysfunction in
unmedicated participants with major depression. Neuropsychologia. 46:2904-2913.
48. Cole MW, Reynolds JR, Power JD, Repovs G, Anticevic A, Braver TS (2013): Multi-task connectivity
reveals flexible hubs for adaptive task control. Nature neuroscience. 16:1348.
49. Zanto TP, Gazzaley A (2013): Fronto-parietal network: flexible hub of cognitive control. Trends in
cognitive sciences. 17:602-603.
50. Ptak R (2012): The frontoparietal attention network of the human brain: action, saliency, and a
priority map of the environment. The Neuroscientist. 18:502-515.
51. Diamond A (2013): Executive functions. Annual review of psychology. 64:135-168.
52. van den Heuvel MP, Sporns O (2019): A cross-disorder connectome landscape of brain
dysconnectivity. Nature Reviews Neuroscience.1.
22bioRxiv preprint first posted online Jun. 13, 2019; doi: http://dx.doi.org/10.1101/670562. The copyright holder for this preprint
(which was not peer-reviewed) is the author/funder, who has granted bioRxiv a license to display the preprint in perpetuity.
It is made available under a CC-BY-NC-ND 4.0 International license.
53. Yang Y, Liu S, Jiang X, Yu H, Ding S, Lu Y, et al. (2019): Common and specific functional activity
features in schizophrenia, major depressive disorder, and bipolar disorder. Frontiers in psychiatry. 10.
54. Chang M, Edmiston EK, Womer FY, Zhou Q, Wei S, Jiang X, et al. (2019): Spontaneous
low-frequency fluctuations in the neural system for emotional perception in major psychiatric
disorders: amplitude similarities and differences across frequency bands. Journal of psychiatry &
neuroscience: JPN. 44:132.
55. Pearlson GD (2015): Etiologic, Phenomenologic, and Endophenotypic Overlap of Schizophrenia
and Bipolar Disorder. Annual Review of Clinical Psychology. 11:251-281.
56. Raichle ME, MacLeod AM, Snyder AZ, Powers WJ, Gusnard DA, Shulman GL (2001): A default
mode of brain function. Proceedings of the National Academy of Sciences. 98:676-682.
57. Buckner RL, Andrews‐Hanna JR, Schacter DL (2008): The brain's default network. Annals of the
New York Academy of Sciences. 1124:1-38.
58. Anticevic A, Cole MW, Murray JD, Corlett PR, Wang X-J, Krystal JH (2012): The role of default
network deactivation in cognition and disease. Trends in cognitive sciences. 16:584-592.
59. Corbetta M, Shulman GL (2002): Control of goal-directed and stimulus-driven attention in the
brain. Nature reviews neuroscience. 3:201.
60. Vossel S, Geng JJ, Fink GR (2014): Dorsal and ventral attention systems: distinct neural circuits but
collaborative roles. The Neuroscientist. 20:150-159.
61. Lefort‐Besnard J, Bassett DS, Smallwood J, Margulies DS, Derntl B, Gruber O, et al. (2018):
Different shades of default mode disturbance in schizophrenia: Subnodal covariance estimation in
structure and function. Human brain mapping. 39:644-661.
62. Yan CG, Wang XD, Zuo XN, Zang YF (2016): DPABI: Data Processing & Analysis for (Resting-State)
Brain Imaging. Neuroinformatics. 14:339-351.
63. Shirer WR, Ryali S, Rykhlevskaia E, Menon V, Greicius MD (2012): Decoding subject-driven
cognitive states with whole-brain connectivity patterns. Cereb Cortex. 22:158-165.
23bioRxiv preprint first posted online Jun. 13, 2019; doi: http://dx.doi.org/10.1101/670562. The copyright holder for this preprint
(which was not peer-reviewed) is the author/funder, who has granted bioRxiv a license to display the preprint in perpetuity.
It is made available under a CC-BY-NC-ND 4.0 International license.
Fig. 1. The cluster medians by state for healthy controls (the first column), schizophrenia (the second
column), bipolar disorder (the third column) and major depressive disorder (the forth column) along
with the count of subjects that had at least one window in each state. The percentage in parentheses
denotes the percentage of occurrences of each state. The color bar represents z value of dynamic
functional connectivity.
HC, healthy controls; SZ, schizophrenia; BD, bipolar disorder; MDD, major depressive disorder;
SomMot, somatomoto; DorsAttn, dorsal attention; Sal/VentAttn, salience/ventral attention; Control,
frontoparietal control; Default, default mode.
24bioRxiv preprint first posted online Jun. 13, 2019; doi: http://dx.doi.org/10.1101/670562. The copyright holder for this preprint
(which was not peer-reviewed) is the author/funder, who has granted bioRxiv a license to display the preprint in perpetuity.
It is made available under a CC-BY-NC-ND 4.0 International license.
Fig. 2. Results obtained by ANCOVA (the first column) and post-hoc two-sample t-tests (from the
second to the forth column) for dynamic connectivity in the four groups.
HC, healthy controls; SZ, schizophrenia; BD, bipolar disorder; MDD, major depressive disorder;
SomMot, somatomoto; DorsAttn, dorsal attention; Sal/VentAttn, salience/ventral attention; Control,
frontoparietal control; Default, default mode.
25bioRxiv preprint first posted online Jun. 13, 2019; doi: http://dx.doi.org/10.1101/670562. The copyright holder for this preprint
(which was not peer-reviewed) is the author/funder, who has granted bioRxiv a license to display the preprint in perpetuity.
It is made available under a CC-BY-NC-ND 4.0 International license.
Fig. 3. Shared (the first column) and distinct (from the second to the forth column) dysconnectivity
across schizophrenia, bipolar disorder, and major depressive disorder. Each dot in the circle represents
a network node, and the nodes in the same network have the same color. The yellow line indicates
increased dysconnectivity. The blue line indicates decreased dysconnectivity.
SZ, schizophrenia; BD, bipolar disorder; MDD, major depressive disorder; SomMot, somatomoto;
DorsAttn, dorsal attention; Sal/VentAttn, salience/ventral attention; Control, frontoparietal control;
Default, default mode.
26You can also read