To get to the point - Junge-Wissenschaft
←
→
Page content transcription
If your browser does not render page correctly, please read the page content below
Paper 06 / 2021          doi: 10.7795/320.202106

                                                                      Verlag:
                                                                      Physikalisch-
                                                                      Technische
                                                                      Bundesanstalt

     JungforscherInnen publizieren
     online | peer reviewed | original

                                                                    Mathematik &
                                                                     Informatik

To get to                                                                       DER JUNGFORSCHER

the point
Neural Network application to key-point
detection in radiographs

Physicians have to locate so called key-points e. g. for surgical
procedures. Up to now, this was always done manually. In order                  Constantin Tilman Schott
to automate this process, innovative software was developed                     (2003)
that uses artificial intelligence (AI) combining a clipping-                    Paul-Gerhardt-Schule
window approach with the newly developed prediction shifting.                   Dassel
The program can predict the key-points with a high degree of                    Eingang der Arbeit:
accuracy–making the AI as precise as a physician.                               6.10.2019
                                                                                Arbeit angenommen:
                                                                                6.12.2019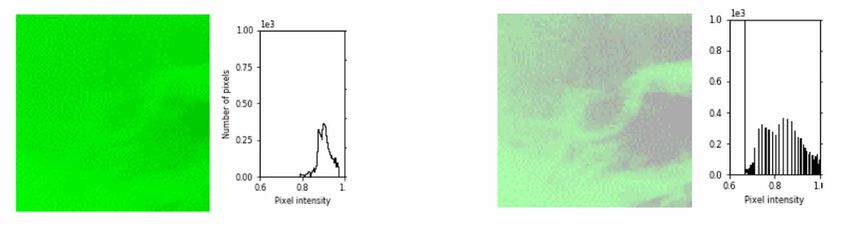
Mathematik | Seite 2

                                                                                         hips etc.), specific structures have to
                                                                                         be marked with precise points. This
                                                                                         method is used in almost all orthopaedic
                                                                                         or surgical X-ray analyses. The angles of
                                                                                         these points in relation to each other
                                                                                         and their distances from each other help
                                                                                         the physician make a specific diagnosis.
                                                                                         This process is known as predictive
                                                                                         analytical key-point detection. The
                                                                                         goal of this project is to use CNNs to
                                                                                         automate this process in order to enable
                                                                                         fully autonomous analysis in other
                                                                                         areas of X-ray diagnostics over the long
                                                                                         term. This involves applying various
                                                                                         CNN structures (existing ones as well as
                                                                                         self-developed ones) to the radiological
                                                                                         analysis (X-ray image analysis) and
                                                                                         drawing comparisons between them.

To get to                                                                                There are already AI methods that
                                                                                         include localization (using facial

the point
                                                                                         recognition, for example) [14]. This
                                                                                         paper discusses the applicability of
                                                                                         these methods to the issue at hand here.
                                                                                         In addition, new methods are being
                                                                                         developed that allow for more accurate
                                                                                         key-point detection.
Neural Network application to key-point
detection in radiographs                                                                 In this paper the cephalometry
                                                                                         (measurement of the cranium) is
                                                                                         examined as a medical subfield, in which
                                                                                         key-point detection is the mainly used
1. Introduction                                                                          and most important analysis technique.
                                                                                         Cephalometry is used in areas such as
The results of the X-ray image analysis     made it possible to achieve an extreme       orthodontic diagnostics and therapy
provide the basis for medical diagnostics   increase in efficiency and accuracy          planning, aesthetic surgery planning
and treatment planning. Up to now,          in automated detection of structures         and, sometimes, in post-traumatic
these analyses are performed manually,      in recent years [3, 9]. This can be seen     reconstructive surgery planning.
making them a drain on time and             exemplary at the MNIST database [6]
human resources, and an expensive task      which is used frequently to evaluate the     As a starting point, methods are
in the specialized medical field of X-ray   quality of image recognition methods         developed in this paper to automatically
image analysis. In light of these facts,    using the example of handwritten digit       locate the so-called Sella point, that was
this paper will explore the option of a     recognition.                                 chosen for its great importance for the
standardized, computer-based analysis                                                    analysis. It is used as a datum point for
of X-ray images.                            These CNNs have already started being        almost all cephalometric analyses and
                                            used to deal with classification tasks in    is the center of the Sella turcica (Latin
There are a variety of automated,           X-ray diagnostics. For example, you can      for “Turkish seat”). The Sella turcica
computer-aided approaches used to           analyze a mammography for cancer foci        is located in the centre of the cranium
extract information from images –           [13]. There are already many examples of     base and, as such, is a nearly constant
finding “features” in images. The           CNNs for chest x-rays, even commercial       datum point for these analyses,
best results here are achieved by           products (oxipit).                           regardless of factors such as growth-
artificial intelligence in the form of                                                   related or traumatic changes to the bony
convolutional neural networks (CNNs)        In addition to these classification tasks,   viscerocranium.
[2]. Among other benefits, CNNs have        in many X-ray image analyses (cranium,

                                                     doi: 10.7795/320.202106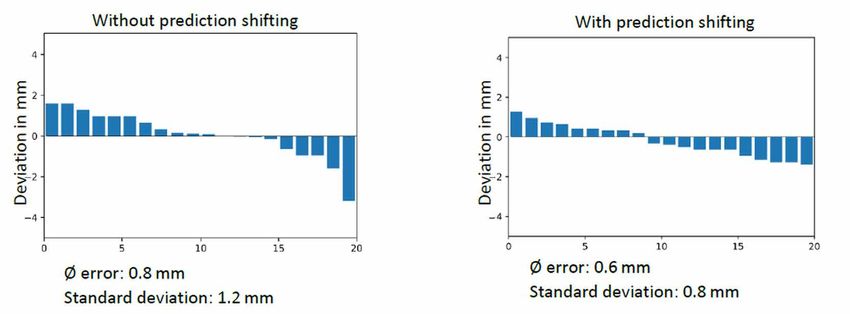
JUNGE wissenschaft 06
                                                                15 / 21
                                                                     18 | Seite 3

                                                                                         On top of that, the following basic AI
                                                                                         methods were used in this work in the
                                                                                         experiments:
                                                    Sella point
                                                                                         In order to reduce overfitting dropout
                                                                                         was used. This involves randomly
                                                                                         deactivating a fixed percentage of
                                                                                         neurons in every learning step in the
                                                                                         respective layer it is being applied to
                                                                                         and optimizing the network without
                                                                                         these neurons [12]. This distributes the
                                                                                         learning process across more neurons
                                                                                         and increases the probability of detecting
                                                                                         relevant patterns and structures,
  Fig. 1: Sella turcica in                     Fig. 2: Sella turcica with                and thus counteracts overfitting. The
  lateral cephalogram                          Sella point drawn in                      training loss converges more slowly as
                                                                                         a consequence of dropout, since it is
                                                                                         not the entire network that is learning
After successfully automating this          of the Sella turcica also varies (Fig. 3).   simultaneously.
key-point-analysis of the Sella point,      The purpose of automated analysis is to
the developed method should be              yield a reliable result, comparable to a     Furthermore, data-augmentation was
transferred on other important points       professional medical analysis, in this       applied:
of the cephalometric X-ray analysis.        complex initial situation.
                                                                                         In the lateral cephalogram analysis, the
2. Preliminary considerations               2.2 Basic AI methodology                     points to be found cumulate heavily.
   and methodology                                                                       As a result, a prediction of the middle
                                            There are three basic possible app-          of the point cloud that is independent
2.1 Problem statement                       lication areas for the CNNs used in this     of the input might be enough for a low
                                            paper:                                       deviation with respect to the individual
As mentioned above, the Sella turcica                                                    lateral cephalogram image (Fig. 4).
is used on an X-ray image of the side       1. Classification of images (e. g. binary
of the cranium (lateral cephalogram)           classification → output between           In the actual application example,
as an application example. On the              0 and 1)                                  the original images (without data
two-dimensional projection of the                                                        augmentation) are shifted by a random
cranium using a lateral cephalogram,        2. Key-point detection (→ output of a        value while making sure, that the Sella
the Sella turcica can be identified as an      coordinate of the point(s))               itself stays within the image boundaries
oval opening upward. The Sella point                                                     (Fig. 5).
(S-point) “is defined as the (geometric)    3. Image segmentation (→ output of an
center of the bony crypts of the Sella         image on which, for example, the          As a result, the network is forced to
turcica” [15] (Fig. 1 and 2).                  detected features are drawn)              learn only the truly relevant correlations
                                                                                         between inputs. If the network
The boundaries of the structure must be     In this work, these three application        optimized to the augmented input
identified individually from one lateral    options (sometimes in combination) are       is then tested on normal application
cephalogram to the next. The shape          used to locate the Sella points.             examples without augmentation, the

  Fig. 3: Various Sella turcica structures with Sella point marked

                                                     doi: 10.7795/320.202106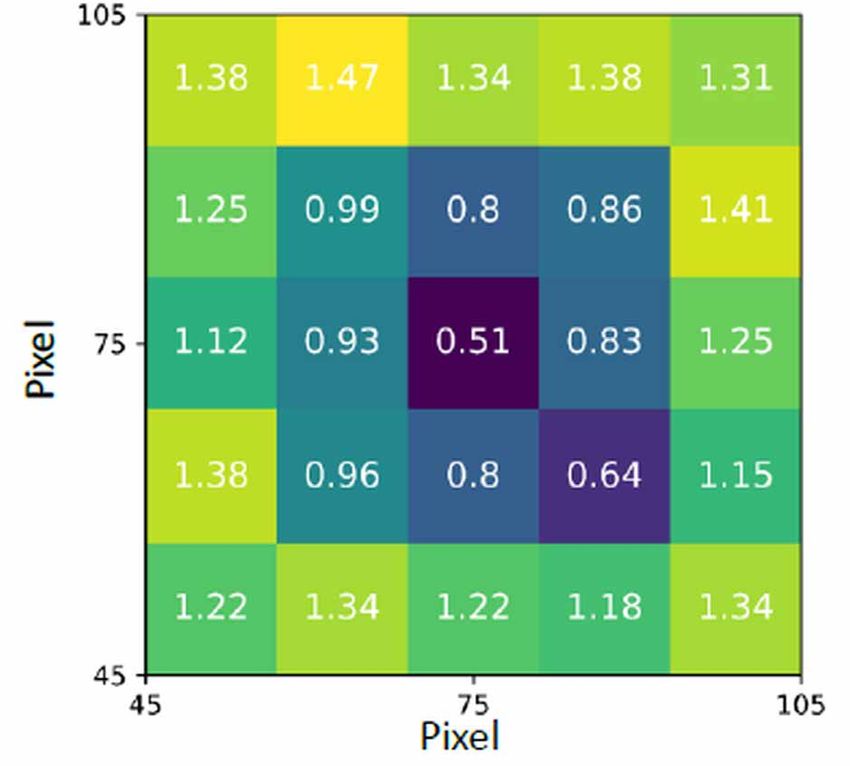
Mathematik | Seite 4

  Fig. 4: Distribution of Sella points                                Fig. 5: Distribution of Sella points
  (without data augmentation)                                         (with data augmentation)

network should detect them with a            and optimization function (with              calculated data were analyzed and
higher degree of accuracy compared to        learning rate etc.). For all nets the Adam   graphically depicted using the Python
a net without image augmentation.            [8] optimization function and the ReLu       Matplot library [18].
                                             activation function [4, 17] turned out to
On top of that, histogram equalization       be optimal.                                  All the programs used for this paper
was utilized. Lateral cephalogram                                                         are stored as a GitHub project at https://
images sometimes have significantly          2.3 Tools                                    github.com/tinotil/DeepLearning _
different contrast values. These values                                                   FRS_JuFo_2019.
can be offset by a histogram equalization    Programming was performed on a
[5] (Fig. 6).                                computer with Intel i7-8700-CPU,             2.4 Data
                                             32 GB DDR4-RAM and a Nvidia
For all the nets the hyperparameters         Geforce GTX 6000Ti with 6 GB RAM             420 anonymized lateral cephalograms
used were optimized in a random              and with an Ubuntu 18.04 LTS                 of the side of the cranium (FRS)
search [19].                                 operating system. The programming            analyzed by medical specialists are the
                                             environment consisted of a Jupyter           basis of all the following analyses. The
These hyperparameters include the size       notebook [7] with browser-based server-      pictures themselves where taken from a
of the batches the training dataset was      client architecture, where the server        private orthodontic doctor’s office. The
split into, the number of convolutional      used the local host environment via a        optimal points for each cephalogram
layers (and their number of kernels and      loopback. The programming language           are the geometric mean of the points
their respective sizes), the max-pooling     used was “Python” combined with              of two doctors with an experience in
layer kernel-sizes, the amount of            the “TensorFlow” library with GPU            this kind of x-ray image analysis of over
dropout, the size of the fully-connected     support and the “Keras” deep learning        25 years.
layers on top (if used), the loss function   library with TensorFlow backend. The

  Fig. 6: Comparison of a Sella image with weak contrast before (left) and after a histogram
  equalization (right) and the associated pixel intensity histograms

                                                       doi: 10.7795/320.202106
JUNGE wissenschaft 06
15 / 21
18 | Seite 5
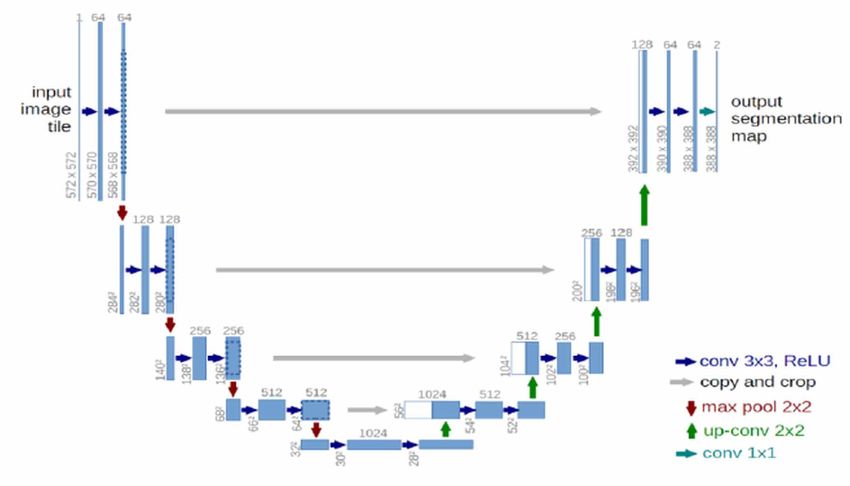
Fig. 7: Example structure of the U-Net (according to Ronneberger et al. [10])
300 of the images were part of the enable the detection of multiple faces at interpreted as the predicted S-point.
training data set, 100 made up the once [14].
validation data set and 20 made up the As shown in Figure 7, a multi-channel
test data set. While this assignment In medical applications comparable feature map is created in the left half
remains the same for a learning cycle approaches are also already used in (CNN), which then gets turned back
(first to last epoch), the images are the Biomedical Image Segmentation into an output image through up-
randomly re-assigned to these data and feature Localization with e. g. sampling and other convolutions in the
sets (cross-validation) before each so-called U-Nets [10]. Such a U-Net right half.
subsequent learning cycle (weights structure was used as a first approach.
reset). In this structure, another part with 3.2 Key-point detection
up-convolutions (expansive path) was network using entire lateral
The original image has a size of attached to the classic CNN (contracting cephalogram
993 × 1123 pixel with 150 dpi. path). For finding the S-point, the lateral
cephalograms were used as the input 3.2.1 Pre-trained key-point detection
The pieces of data listed below each and a corresponding image matrix network
represent the mean values of five with the maximum activation at the
learning cycles (5-fold CV). optimal point was used as the output. In As a second approach a CNN was
addition, the pixels around the optimal used and its output feature maps are
3. Evolution of approaches point were activated to the effect of interpreted by a DenseNet, which itself
a statistical standard distribution in outputs a 2 × 1 vector - the predicted
3.1 Image segmentation: order to enable gradual convergence S-point coordinate.
Heatmap approach to the optimal point. The optimal
scaling factor of this Gaussian was The deep learning library Keras offers
A heatmap method is used as the first experimentally determined and then different pre-trained CNNs whose
approach for automated localization of fixed for all further experiments. This weights have already been optimized to
the Sella point on a lateral cephalogram. creates what is known as the heatmap certain applications, and are therefore
This process is based on facial for training. The point of maximum able to detect basic structures reliably.
recognition CNNs, where heatmaps activation of the output-heatmap gets During an initial test, a pre-trained
doi: 10.7795/320.202106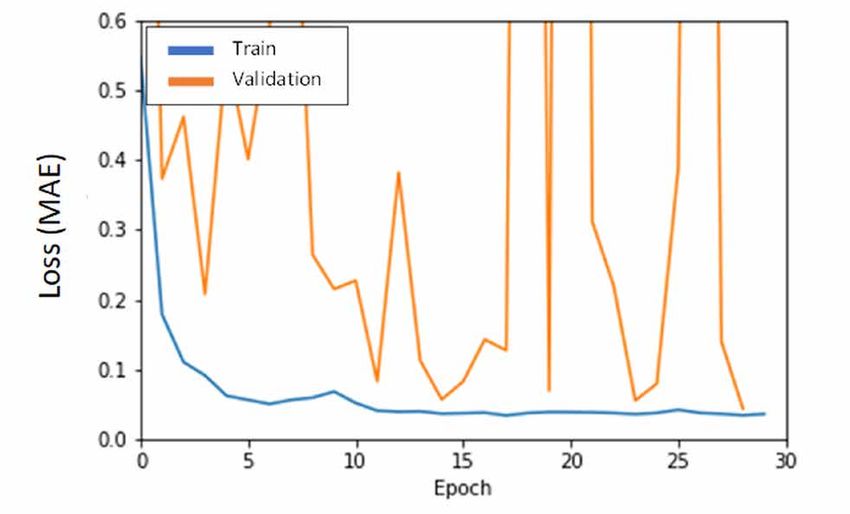
Mathematik | Seite 6

VGG16 network [11] was used with a         Dropout was utilized as             needed    evaluated on two levels using a clipping
two-layer DenseNet.                        increasing from 0.2 up to 0.7.                window approach. First, a classification
                                                                                         CNN classifies selected partial images
The coordinates of the points are          3.2.2 Custom key-point                        according to the categories “Sella”
standardized      for     all  key-point         detection network                       or “not Sella”. In the second step,
detections. In doing so, each coordinate                                                 a key-point detection network sets
value was divided by the width of the      In the next step, the pretrained VGG16        the S-point on the classified images
respective image edge (x-coordinate/       network was replaced by a custom              of a Sella turcica.
width of the image, y-coordinate/ height   trained, smaller network with only 4
of the image). As a result, the expected   convolutional layers and two dense            Since only a section of the lateral
outputs were limited to a range between    layers on top.                                cephalogram image is input (partial
0 and 1. Here, only the DenseNet and                                                     image size 150 × 150 pixels) into a
the top two layers of the VGG16 network    In this example data augmentation             network, down-sampling no longer
were trained. This was done to prevent     was used extensively varying between          needs to be applied to the input lateral
overwriting weights of the lower layers    a random shift over 3/4 or 1/2 of the         cephalogram image. As a result, a lateral
that had already been optimized and        output range.                                 cephalogram image that is 750 × 750
to reduce the training time. The lateral                                                 pixels can be used as an initial input,
cephalogram images were used as input      In order to enable a learning process         thereby increasing the information
data and the standardized coordinates      the pictures had to be down-sampled           density.
of the S-points were used as output. As    to an input size of 150 × 150 pixels from
the VGG16 network uses RGB images as       an original size of 993 × 1123 pixels. A      3.3.1 Classification network
input the grayscale channel values were    larger input cannot be implemented in
duplicated to generate a three-channel     this key-point detection network due to       A simple CNN with only 3 convolutional
picture. These input images were also      hardware limitations.                         layers and two interpreting Dense layers
rescaled using PIL (Python Image                                                         was used as a classification network.
Library) in order to fit the VGG16 input   3.3 Clipping window approach                  In this process, an output of 0 was
dimensions.                                                                              assigned for Sella and 1 for non-Sella.
                                           An improved approach for precisely            Therefore, a sigmoid function was
                                           detecting the S-point is based on the         used as an activation function of the
                                           process of Ciresan et al. [1]. The image is   output layer. Since all outputs greater

  Fig. 8: Example of generating partial images                      Fig. 9: Deviations of predictions from the expected
  based on the Sella points that have already                       values in mm for 20 test Sella images, depending
  been identified in the entire lateral                             on the position of the ground truth point on
  cephalogram (with 10 points for                                   the Sella partial image (image center:
  purposes of simplification)                                       75|75 pixels)

                                                     doi: 10.7795/320.202106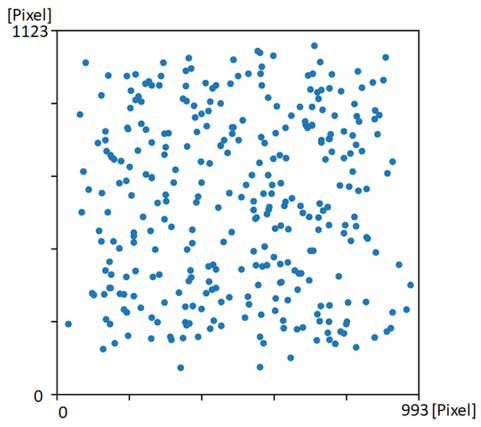
JUNGE wissenschaft 06
                                                                  15 / 21
                                                                       18 | Seite 7

than 0.5 can be interpreted as 1 and all      only the image with the highest degree        partial image was recentered, with the
those less than 0.5 can be interpreted        of equivalence to a Sella is ultimately       previously predicted Sella point as the
as 0 in the binary classification of          selected.                                     new centre. Only the second prediction
this case example, the model is not as                                                      then is the final prediction of the
susceptible to overfitting. For learning      If none of the partial images output          network. The network used is the same
purposes, the corresponding Sella             using the described search method yield       as in 3.3.2.
image was generated from each lateral         an equivalence of at least 99.9 %, a simple
cephalogram with the set Sella point as       overlapping sliding window process            As a second measure the coordinate was
the middle point. The non-Sella images        (fixed offset in x- and y-directions) is      split into two separate scalars for the
were able to be generated by randomly         used.                                         x and the y coordinate that are being
selecting partial images from the X-ray                                                     predicted by separate networks.
images. The edges of the non-Sella            3.3.2 Key-point detection network
images adhered to a minimum distance                using Sella partial image               4. Results
of 75 pixels from the set Sella point.
                                              Again, a key-point detection network          4.1 Image segmentation:
To ensure practical use of the network, a     outputs the exact coordinate of the               Heatmap approach
method must be developed that divides         Sella point. This time, however, it is
the entire input lateral cephalogram          not operating on the entire lateral           Learning is not possible for this kind
into partial images that are then divided     cephalogram, but only on the partial          of network in this application example.
into categories of “Sella” and “non-          image containing the Sella structure,         The U-Net learns to output a completely
Sella” by the classification network.         that has been positively classified by the    non-activated output, by adapting to
There are a variety of search patterns        classification net.                           the desired output. Similar results can
that can be used to accomplish this. A                                                      be seen when using different heatmap
square with a side length that is 1/5 of      Image      augmentation,     an    even       generation methods (other than
the total image height is used as the size    distribution of optimal points in the         U-Nets).
of these images.                              output area, is absolutely necessary for
                                              the training set, since the images were       The heatmap approach is a quantitative
The a priori knowledge of the                 created for the training data set based       key-point detection. This means that the
accumulation of S-points on the lateral       on the optimal point. Without image           focus is on detecting multiple structures
cephalogram images (Fig. 4) can be            augmentation, the S-point would always        (e. g. faces) simultaneously, during
used to generate pictures of a high           be in the center of the image.                which the accuracy of an individual
probability of containing the Sella.                                                        prediction is less relevant. During X-ray
                                              3.3.3 Key-point detection network             image key-point detection, each point
First, all the manually set Sella points            using Sella partial image with          only needs to be detected and located
that have already been analyzed once are            prediction shifting                     once, but with very high accuracy, which
used as centres of the generated images,                                                    is not possible using this approach.
which are then fed into the classification    A consideration of the average error,
network as input to be classified (Fig. 8).   depending on the position of the Sella        Therefore,   qualitative  key-point
                                              on the partial image (based on the            detection methods must be developed
As already mentioned, the classification      optimal points), results in the following     and tested.
network uses a sigmoid function as an         distribution (Fig. 9).
activation function of the output layer.                                                    4.2 Key-point detection
Unlike functions such as the heaviside        The prediction becomes more accurate              network using entire lateral
step function, the advantage here is          the more centrally the Sella is located.          cephalogram
that differences in equivalence between       Between the edge areas and the
the input and the learned patterns are        center, the deviations can be seen to         4.2.1 Pre-trained key-point detection
depicted. Despite this, a clear distinction   be reduced by more than half. This                  network
(0 or 1) is favored through a larger          can be correlated with the higher
gradient (major change in each learning       information density of the central areas      The quality of this approach can be
step) in the value range between 0 and 1.     (see “valid padding”), as well as better      seen in Fig. 10, where the deviation of
Therefore, in the clipping window             visibility of the relevant structures.        the validation data set from that of the
approach, the network can assess the          To make use of this fact, the same            training data set is shown. The diagram
degree of similarity to the Sella that        net was used to make two separate             shows clear overfitting. The deviation of
the input image depicts. Accordingly,         prediction. Between the predictions the       the training data set converges to zero,

                                                        doi: 10.7795/320.202106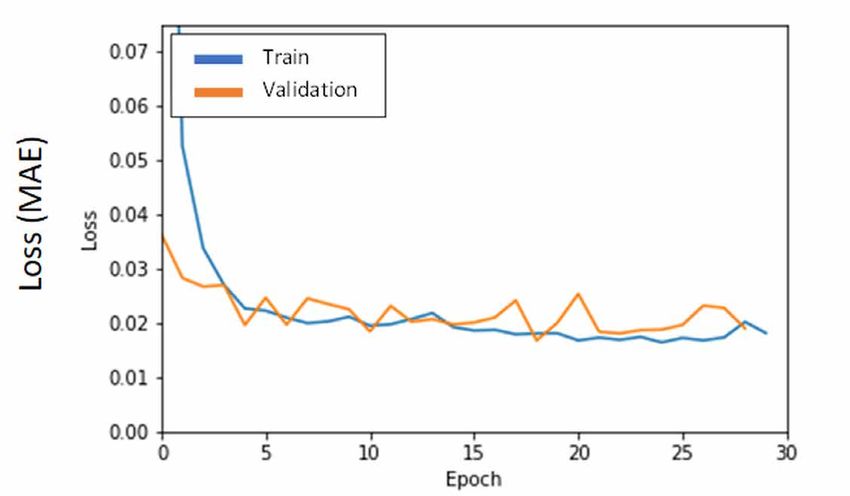
Mathematik | Seite 8

  Fig. 10: Training and validation loss over                        Fig. 11: Training and validation loss over
  epochs (pre-trained key-point detection                           epochs (pre-trained key-point detection
  network; no dropout)                                              network; dropout of 0.2)

although the deviation of the validation    for the task at hand than the complex      A dropout of 0.2 prevents overfitting
data set fluctuates significantly and       one used previously.                       here as well, and allows the model
does not converge. This means that the                                                 to achieve an even lower average test
network can set the learned points in       4.2.2 Custom key-point detection           deviation of 2.8 % of the image size
the training data set very precisely but          network                              (4.2 mm).
fails at new, unseen tasks. An average
deviation of 23 % of the image size         The learning progress of the custom net    The average deviation of predictions
(34.5 mm) in the test data shows similar    can be seen in (Fig. 12).                  of the test data set (3 % of image size,
discrepancies as the validation data set.                                              4.5 mm) differs from the average
                                            This simplified and more specialized       deviation of predictions of the validation
Using a dropout of 0.2 (deactivation        model learns more quickly because          data set (2 % of image size, 3 mm).
of every fifth neuron), it was possible     fewer parameters have to be optimized
to make noticeable improvements to          (30 seconds for 30 epochs instead of       The specific Data-Augmentation used
the overfitting problem (Fig. 11). The      2.30 minutes for 30 epochs with the        on the custom network did not improve
predictions of the test data set were       pre-trained model). Here, an average       the results.
made with an average deviation of 11%       deviation of just 3.2 % of the image
of the image size (16.5 mm) using this      size (4.8 mm) can be identified with the   By randomly shifting the points onto an
new model.                                  test data set. Using additional dropout,   area that is 3/4 of the image area, only
                                            overfitting can also be minimized here.    a test deviation of 8 % of the image size
Despite the dropout, we also have a
relatively high fluctuation of validation
loss in this adjusted model. If the
dropout is increased even further, the
deviation can also be further reduced
with a very high dropout up to a certain
point.

At a dropout of 0.5 (50 % of all neurons
are deactivated in every learning step),
the deviation was able to be reduced to
7 % of the image size (10.5 mm), and
to 6 % of the image size (9 mm) with a
dropout of 0.7.

Such a positive reaction to high dropout       Fig. 12: Training and validation loss over epochs (custom
speaks to the fact that a simpler network      key-point detection network; no dropout)
would be able to achieve better results

                                                     doi: 10.7795/320.202106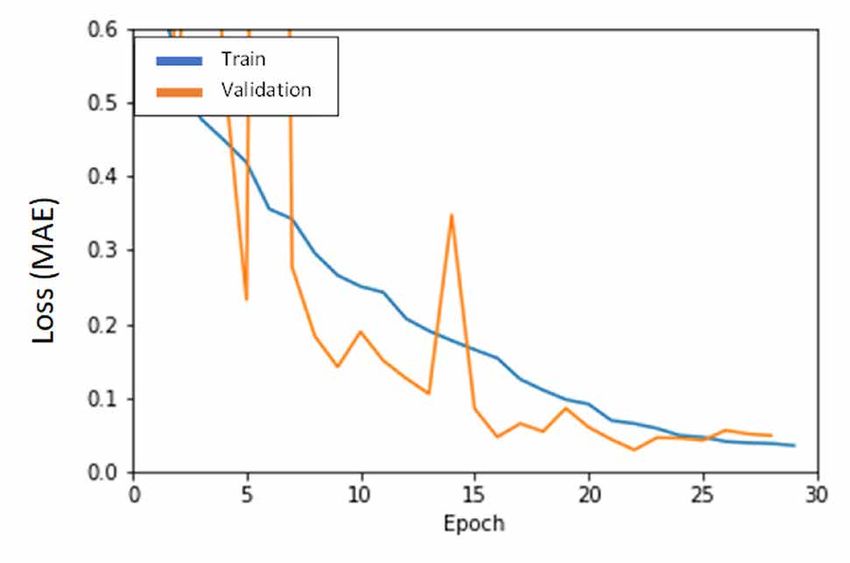
JUNGE wissenschaft 06
                                                                15 / 21
                                                                     18 | Seite 9

  Fig. 13: Waterfall plot of prediction errors for 20 Sella partial images (test data set)

(12 mm) could be achieved, and 7 %          Using the clipping window search            4.3.3 Key-point detection network
(10.5 mm) at 1/2 the image area.            algorithm the Sella structure was                 using Sella partial image with
                                            identified every time in each of the 20           prediction shifting
4.3 Clipping window approach                test images and an image of a complete
                                            Sella was outputted each time.              Fig. 13 compares the approach of 4.2.3
4.3.1 Classification network                                                            (left) and of 4.3.3 (right).
                                            4.3.2 Key-point detection network
After adjusting the network structure             using Sella partial image             Both networks described 4.3.2 and 4.3.3
and the dropout, the network achieves an                                                are applied to the Sella partial images
accuracy of 98.8 % correct classification   After a total of 60 training epochs, an     created using the classification network
for lateral cephalogram partial images      average deviation of the test data set of   described in 4.3.1 from the whole X-ray
after 150 epochs.                           2.5 % of the partial image size (0.8 mm)    images.
                                            was achieved. While this approach
Further improvement to 99.5 % correct       exhibits a low average deviation,           The classification process (4.3.1)
classification for lateral cephalogram      the scattering of the losses is high        consequently extracts Sella partial
partial images was achieved using           (at maximum 10 %, 3.2 mm) with a            images with a size of 150 × 150 pixels
histogram equalization.                     standard deviation of 1.2 mm.               from the entire input lateral
                                                                                        cephalogram which itself has a

  Fig. 14: Deviation of predictions with respect to the points set by specialists:
  Left: Pre-trained key-point detection network (3.2.1)
  Middle: Custom key-point detection network (3.2.2)
  Right: Clipping window approach with prediction shifting (3.3)
  Red circle: Average Sella size

                                                     doi: 10.7795/320.202106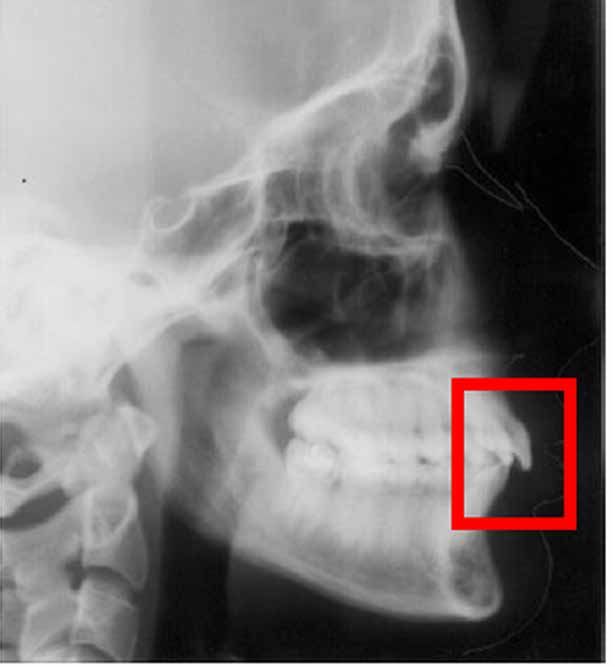
Mathematik | Seite 10

standardized size of 750 × 750 pixels. The   prediction shifting, as tested on the test   number of activation cumulations
exact middle point of the Sella now can      data set, is clearly the most precise.       on the heatmap) is very low (singular
be determined on these partial images                                                     cumulation). Therefore, learning is not
by the key-point detection net (4.3.3)       4.5 Application on other points              possible for this kind of network in this
with an average deviation of 1.8 % and                                                    application example. The U-Net learns
maximum 5 % of the partial image size.       To test the transferability of the           to output a completely non-activated
In order to make this approach               developed method, it was tested on the       output, by adapting to the desired
comparable to the prior ones the error       incisal point. This is another important     output. Due to the low stimulus density,
should not be correlated to the Sella        point to be placed on the foremost tip of    the parts of the desired heatmap
partial image but to the entire lateral      the first incisor (Fig. 15, 16).             that are non-activated are too large.
cephalogram (as in 4.1 and 4.2), leading                                                  These problems could be addressed by
to an average deviation of 0.36 %            The mean deviation of 0,65 mm and            enlarging the distribution radius of
of the image size and a maximum              maximum deviation of 1,4 mm is very          activations, although this inevitably
deviation of 1 % of the image size.          comparable to the results seen on the        would make the output less specific. The
Based     on    an     original    lateral   original application on the Sella point.     same problem also applies to possible
cephalogram as it is presented to the                                                     heatmap approaches without using a
doctor, this corresponds to an average       5. Discussion                                U-Net structure. However, this kind of
deviation of 0.6 mm and a maximum                                                         method could help in other radiological
deviation of 1.5 mm.                         In this project, different methods           tasks, such as detecting carious areas,
                                             were developed and compared for              since this involves quantitative key-
4.4 Comparison of approaches                 automatically carrying out key-point         point detection.
                                             detection on X-ray images using
Finally, if the three processes examined     neural networks. The research used           A key-point detection network was
in this paper are compared based on the      the example of the Sella point on            used in the next step. The reduction
absolute deviations for the respective       lateral cephalograms of the side of the      of complexity of the output allowed
coordinates of the Sella point (Fig. 14),    cranium. Three different approaches          predictions that achieved an average
the increase in accuracy can be seen         were compared.                               deviation of just 4.2 mm with the
clearly, as has been shown in the course                                                  redesigned and custom network. A
of this project. The average deviation       A heatmap approach, as is used in            key-point detection network is useful
of 6 % (9 mm) in the optimized first         facial recognition, was introduced in        for finding individual, specific points.
approach was reduced to 0.36 % of the        the first step. This network structure is    Due to the limitations of the available
image size (0,6 mm) in the third process.    particularly well-suited for detecting       hardware, the size of the lateral
                                             multiple points at the same time, but        cephalogram images needed to be
The following three diagrams (Fig. 14)       less so for precisely setting individual     reduced from the original 993 × 1123 to
shows the deviation of predictions           key points.                                  150 × 150 pixels.
of the respective networks in the x-
and y-direction. Here, the custom,           During X-ray image key-point detec-          Further    important      localization
combined network from 3.3 with               tion, the stimulus density (i.e. the         information is lost due to the above

                                                                                               Incisal point

  Fig. 15: Incisor in lateral cephalogram                             Fig. 16: Incisor with Incisal point drawn in

                                                       doi: 10.7795/320.202106
JUNGE wissenschaft 06
15 / 21
18 | Seite 11
mentioned max pooling and valid Sella point on which these methods This ability is especially important in
padding. However, these methods were tested was able to be located with localizing the Sella point, since this is
were necessary in this application in an average deviation of 0.6 mm. an imaginary point. This means that
order for the CNN error to converge the point is not set on a real structure,
while keeping the number of optimized After a reliable way to automatically but rather has to be constructed based
parameters within the bounds set by the detect the S-point has been developed, on the surrounding structure of the
hardware. this method can be applied to other Sella turcica. This makes localization
relevant points of cephalometric X-ray difficult and demonstrates the ability of
This sets a upper limit on the possible analysis. the model to not only detect features,
accuracy of key-point localization. but also to correlate different detected
This type of network has shown itself Unlike some algorithms or programs features to each other.
to be suitable for finding points in this which are not capable of learning, a
research, but it exhibits significant neural network structure is not tied to The application to the incisal point has
precision problems in prediction. the original application area. Instead, furthermore shown a certain degree of
it can be transferred to other problems transferability, in particular to a non-
Two neural networks that build on each using the same solution approach with imaginary point which is to be placed
other were used as a third approach. little to no change in accuracy. on an actual depicted structure.
First, a classification CNN extracts the
partial image from the entire image This transferability of this approach was The actual transferring of this method
containing the Sella. Only once this proven by testing it on the incisal point. to other points can be executed in
partial image is extracted does a key- The deviation only differs by less than further research.
point detection network set the precise 0,01 mm from the results of the Sella
S-point on it. This limits the influence point which shows the applicability of Outside of lateral cephalogram analysis,
of the loss of localization information the method to different points. there are a few other X-ray image
of the key-point detection network on evaluations that have so far applied
final prediction. In the context of a manual evaluation by manual key-point detection. This
a specialist, Segner and Hasund write the includes all orthopaedic, bone-related
This approach is also based on the way following about the reproducibility of malpositions, i.e. malpositions of the
a doctor works, first by searching for manual point localizations: “It generally hip, knee or spine. The transferability of
the most likely search area for the Sella will not be possible to reproduce the the process developed here can also be
structure, and then (after detecting the measured values of the first evaluation tested in this field.
Sella) approximating the S-point. with an accuracy of 0.1 or 0.5 mm, no
matter whether the evaluation was done 6. Outlook
Lastly the method of prediction shifting (by a doctor) digitally or by hand” [16].
was used based on the fact that a more Based on these results, the next goal in
central position of the relevant structure The deviation of the neural network this process is the automated evaluation
leads to a more accurate prediction. from the points set by professionals that of other points based on the described
was determined in this paper is thus method of the clipping window with
It could be speculated that this is comparable to the deviation that occurs prediction shifting. To do so, new data
correlated with the higher information between two medical evaluations. The sets are required that must be created by
density of the central areas (see “valid developed method thus enables practical hand.
padding”) as well as better visibility of results for radiologic evaluation to be
the relevant structures in the centre. achieved. The long-term goal here is being able
to perform completely autonomous
Using the clipping window and However, the existing results thus far X-ray image evaluation (possibly with
prediction shifting, the divide and only pertain to the example application diagnosis) in cephalometry based on
conquer paradigm was successfully of the methods on two points. key-point detections by applying this
applied. method.
In localization of other important
The goal of developing a workable points on a lateral cephalogram as well, Here, only the angles and distances
procedure for predictive analytic key- certain features have to be detected and between the individual points need
point detection was achieved using correlated in order to approximate the to be calculated in the last step. The
the clipping window approach and the respective position. appropriate software already exists for
prediction shifting developed here. The this purely algebraic task. However,
doi: 10.7795/320.202106Mathematik | Seite 12
at the moment, it only produces This project succeeded in identifying
calculations based on points set by the Sella point with an average deviation
hand. to the manually set points of less than
1 % of the image size and an absolute
An opportunity for the direct deviation of 0.6 mm. This is within the
implementation of the system in an spread range for specialist evaluation.
application environment is thereby given.
Using the method developed by
In the next step, transferring the combining a clipping window process,
methods to similar X-ray image a classification network, two key-point
evaluations (hip, knee, or spine X-ray detection networks and prediction
images) is to be tested. shifting, the method has already been
successfully tested on an additional
Any real-world implementation of this point of cephalometric analysis. The
kind of automation will certainly still transferability has been proven.
(currently) need the supervision and
review of a specialist, but the evaluation Acknowledgements
can be accelerated and standardized.
That is an advantage for both the doctor I would like to express my thanks for
and for the patient. This application area the support from Dr. Carsten Winkler
is an example of a beneficial human- (mathematics and physics teacher, PGS
machine collaboration. Dassel) for the critical examination
of my paper as well as Drs. Angrit
In following projects, image and Thomas Schott — my parents
preprocessing could be examined in — for providing the anonymized
greater detail. In this paper, histogram lateral cephalograms and the manual,
equalization was applied to compensate professional setting of the Sella points.
for contrast differences. Other methods
include edge detection or thresholding,
for example. In both methods, irrelevant
data can be discarded before beginning
training, which enables faster and more
reliable detection by the network. This
can reduce the necessary network
depths and, as a result, the calculation
effort as well. On the other hand,
preprocessing images too heavily can
destroy important structures on some
images. Individualized preprocessing
tailored to each image increases
the effort needed for learning — a
compromise needs to be found.
7. Summary
The goal of this research was to develop
methods for automated key-point
detection on X-ray images, using the
example of Sella points within lateral
cephalogram of the side of the cranium
with the aid of artificial intelligence,
specifically the use of convolutional
neural networks.
doi: 10.7795/320.202106JUNGE wissenschaft 06
15 / 21
18 | Seite 13
Sources and bibliography [12] Srivastava, N., Hinton, G., Krizhevsky, A.,
Sutskever, I., Salakhutdinov, R.: Dropout. A
[1] Ciresan, D.C., Gambardella, L.M., Giusti, A., Simple Way to Prevent Neural Networks from
Schmidhuber, J.: Deep neural net-works Overfitting. In: Journal of Machine Learning
segment neuronal membranes in electron Research. Volume 15, No. 2. Department of
microscopy images. In: NIPS. pp. 2852–2860 Computer Science University of Toronto,
(2012) p. 1929–1958 (2014)
[2] Ciresan, D., Meier, U. ,Schmidhuber, J.: Multi- [13] Platania, R., Shams, S., Yang, S., Zhang, J.,
column deep neural networks for image Lee, K., Park, S: Automated Breast Cancer
classification. In: Institute of Electrical and Diagnosis Using Deep Learning and Region of
Electronics Engineers (IEEE), p. 3642–3649. Interest Detection (BC-DROID) In: Proceedings
(2012) of ACM-BCB’17, August 20-23, 2017, Boston
[3] Girshick, R., Donahue, J., Darrell, T., Malik, J.: [14] Do Nhu, T., Kim, S.H. , Yang, H.J.,
Rich feature hierarchies for accurate object Lee, G.-S.: Face Tracking with Convolutional
detection and semantic segmentation. Neural Network Heat-Map, 2018, Conference:
In: Proceedings of the IEEE, Conference on The 2nd International Conference on Machine
Computer Vision and Pattern Recognition Learning and Soft Computing (ICMLSC 2018),
(CVPR) (2014) At Phu Quoc, Vietnam
[4] Hahnloser, R., Seung, H.S.: Permitted and [15] Segner, D., Hasund A.: Individualisierte
Forbidden Sets in Symmetric Threshold-Linear Kephalometrie, Dietmar Segner Verlag,
Networks In: Neural Computation archive, Hamburg, 1998, 3rd Edition, p. 14
Volume 15, Issue 3, pp. 621–638 (2003) [16] Segner, D., Hasund A.: Individualisierte
[5] Abdullah-Al-Wadud M., Hasanul Kabir Md., Kephalometrie, Dietmar Segner Verlag,
Ali Akber Dewan M., Chae O.: A Dynamic Hamburg, 1998, 3rd Edition, p. 42
Histogram Equalization for Image Contrast [17] Leshno M., Lin V. Ya., Pinkus A.,
Enhancement, In: IEEE Transactions on Schocken Sh.: Multilayer feedforward
Consumer Electronics (Volume: 53 , Issue: 2 , networks with a nonpolynomial activation
May 2007 ) function can approximate any function,
[6] http://yann.lecun.com/exdb/mnist/ (retrieved Neural Networks. 6 (6), pp. 861–867, Jan 1993
on 2018-11-12, 17:14) [18] Hunter, J.D.: Matplotlib: A 2D graphics
[7] https://jupyter.org/ environment, Computing in Science &
(retrieved on 2021-07-1, 15:00) Engineering, Volume 9, p. 90–95, 2007
[8] Kingma, D., Ba, J.: Adam: A Method for [19] Bergstra J., Bengio Y.: Random Search for
Stochastic Optimization In: ICLR (2015) Hyper-Parameter Optimization In: Journal of
[9] Krizhevsky, A., Sutskever, I., Hinton, G.E.: Machine Learning Research. 13, pp. 281–305,
Imagenet classification with deep 2012
convolutional neural networks, 2012 In:
NIPS'12 Proceedings of the 25th International
Conference on Neural Information Processing
Systems - Volume 1, p. 1097–1105 (2012)
[10] Ronneberger, O., Fischer, P. ,Brox, T.: U-Net:
Convolutional Networks for Biomedical Image
Segmentation In: Medical Image Computing
and Computer-Assisted Intervention (MICCAI),
Springer, LNCS, Vol.9351: p. 234–241 (2015)
[11] Simonyan, K. , Zisserman, A.: Very Deep
Convolutional Networks for Large-Scale Image
Recognition In: ICLR 2015 (2015)
doi: 10.7795/320.202106Mathematik | Seite 14
Publiziere
auch Du hier!
Forschungsarbeiten von
Schüler/Inne/n und Student/Inn/en
In der Jungen Wissenschaft wer-
den Forschungsarbeiten von Schüler-
Innen, die selbstständig, z. B. in einer
Schule oder einem Schülerforschungs
zentrum, durch geführt wurden, ver- Wie geht es nach dem
öffentlicht. Die Arbeiten können auf Einreichen weiter?
Deutsch oder Englisch geschrieben sein.
Die Chefredakteurin sucht einen ge-
Wer kann einreichen? eigneten Fachgutachter, der die in-
haltliche Richtigkeit der eingereichten
SchülerInnen, AbiturientInnen und Arbeit überprüft und eine Empfehlung
Studierende ohne Abschluss, die nicht ausspricht, ob sie veröffentlicht wer-
älter als 23 Jahre sind. den kann (Peer-Review-Verfahren). Das
Gutachten wird den Euch, den AutorIn-
Was musst Du beim nen zugeschickt und Du erhältst gege-
Einreichen beachten? benenfalls die Möglichkeit, Hinweise
des Fachgutachters einzuarbeiten.
Lies die Richtlinien für Beiträge. Sie ent-
halten Hinweise, wie Deine Arbeit auf- Die Erfahrung zeigt, dass Arbeiten, die
gebaut sein soll, wie lang sie sein darf, z. B. im Rahmen eines Wettbewerbs wie
wie die Bilder einzureichen sind und Jugend forscht die Endrunde erreicht
welche weiteren Informationen wir be- haben, die besten Chancen haben, die-
nötigen. Solltest Du Fragen haben, dann ses Peer-Review-Verfahren zu bestehen.
wende Dich gern schon vor dem Ein-
reichen an die Chefredakteurin Sabine Schließlich kommt die Arbeit in die Re-
Walter. daktion, wird für das Layout vorberei-
tet und als Open-Access-Beitrag veröf-
Lade die Erstveröffentlichungserklärung fentlicht.
herunter, drucke und fülle sie aus und
unterschreibe sie. Was ist Dein Benefit?
Dann sende Deine Arbeit und die Erst- Deine Forschungsarbeit ist nun in ei-
veröffentlichungserklärung per Post an: ner Gutachterzeitschrift (Peer-Review- Die Junge Wissenschaft wird zusätzlich
Journal) veröffentlicht worden, d. h. Du in wissenschaftlichen Datenbanken ge-
Chefredaktion Junge Wissenschaft kannst die Veröffentlichung in Deine listet, d. h. Deine Arbeit kann von Ex-
Dr.-Ing. Sabine Walter wissenschaftliche Literaturliste auf- perten gefunden und sogar zitiert wer-
Paul-Ducros-Straße 7 nehmen. Deine Arbeit erhält als Open- den. Die Junge Wissenschaft wird Dich
30952 Ronnenberg Access-Veröffentlichung einen DOI durch den Gesamtprozess des Erstellens
Tel: 05109 / 561508 (Data Object Identifier) und kann von einer wissenschaftlichen Arbeit beglei-
Mail: sabine.walter@verlag- entsprechenden Suchmaschinen (z. B. ten – als gute Vorbereitung auf das, was
jungewissenschaft.de BASE) gefunden werden. Du im Studium benötigst.
doi: 10.7795/320.202106JUNGE wissenschaft 06
15 / 21
18 | Seite 15
ein. Für die weitere Bearbeitung und
Richtlinien die Umsetzung in das Layout der
Jungen Wissenschaft ist ein Word-
für Beiträge Dokument mit möglichst wenig
Formatierung erforderlich. (Sollte
dies Schwierigkeiten bereiten, setzen
Für die meisten Autor/Inn/en ist dies die Sie sich bitte mit uns in Verbindung,
damit wir gemeinsam eine Lösung
erste wissenschaftliche Veröffentlichung. finden können.)
Die Einhaltung der folgenden Richtlinien
hilft allen – den Autor/innen/en und dem ■ Senden Sie mit dem Beitrag die
Redaktionsteam Erstveröffentlichungserklärung ein.
Diese beinhaltet im Wesentlichen,
dass der Beitrag von dem/der
angegebenen AutorIn stammt,
Die Junge Wissenschaft veröffentlicht Sponsoren, mit vollständigem Namen keine Rechte Dritter verletzt
Originalbeiträge junger AutorInnen bis angefügt werden. Für die Leser kann werden und noch nicht an anderer
zum Alter von 23 Jahren. ein Glossar mit den wichtigsten Stelle veröffentlicht wurde (außer
Fachausdrücken hilfreich sein. im Zusammenhang mit Jugend
■ Die Beiträge können auf Deutsch forscht oder einem vergleichbaren
oder Englisch verfasst sein und ■ Bitte reichen Sie alle Bilder, Wettbewerb). Ebenfalls ist zu
sollten nicht länger als 15 Seiten mit Grafiken und Tabellen nummeriert versichern, dass alle von Ihnen
je 35 Zeilen sein. Hierbei sind Bilder, und zusätzlich als eigene verwendeten Bilder, Tabellen,
Grafiken und Tabellen mitgezählt. Dateien ein. Bitte geben Sie bei Zeichnungen, Grafiken etc. von
Anhänge werden nicht veröffentlicht. nicht selbst erstellten Bildern, Ihnen veröffentlicht werden dürfen,
Deckblatt und Inhaltsverzeichnis Tabellen, Zeichnungen, Grafiken also keine Rechte Dritter durch die
zählen nicht mit. etc. die genauen und korrekten Verwendung und Veröffentlichung
Quellenangaben an (siehe auch verletzt werden. Entsprechendes
■ Formulieren Sie eine eingängige Erstveröffentlichungserklärung). Formular ist von der Homepage
Überschrift, um bei der Leserschaft Senden Sie Ihre Bilder als www.junge-wissenschaft.ptb.de
Interesse für Ihre Arbeit zu wecken, Originaldateien oder mit einer herunterzuladen, auszudrucken,
sowie eine wissenschaftliche Auflösung von mindestens 300 dpi auszufüllen und dem gedruckten
Überschrift. bei einer Größe von 10 ∙ 15 cm! Beitrag unterschrieben beizulegen.
Bei Grafiken, die mit Excel erstellt
■ Formulieren Sie eine kurze, leicht wurden, reichen Sie bitte ebenfalls ■ Schließlich sind die genauen
verständliche Zusammenfassung die Originaldatei mit ein. Anschriften der AutorInnen mit
(maximal 400 Zeichen). Telefonnummer und E-Mail-
■ Vermeiden Sie aufwendige und lange Adresse sowie Geburtsdaten und
■ Die Beiträge sollen in der üblichen Zahlentabellen. Fotografien (Auflösung 300 dpi bei
Form gegliedert sein, d. h. Einleitung, einer Bildgröße von mindestens
Erläuterungen zur Durchführung ■ Formelzeichen nach DIN, ggf. 10 ∙ 15 cm) erforderlich.
der Arbeit sowie evtl. Überwindung IUPAC oder IUPAP verwenden.
von Schwierigkeiten, Ergebnisse, Gleichungen sind stets als ■ Neulingen im Publizieren werden
Schlussfolgerungen, Diskussion, Größengleichungen zu schreiben. als Vorbilder andere Publikationen,
Liste der zitierten Litera tur. In z. B. hier in der Jungen Wissenschaft,
der Einleitung sollte die Idee zu ■ Die Literaturliste steht am Ende der empfohlen.
der Arbeit beschrieben und die Arbeit. Alle Stellen erhalten eine
Aufgabenstellung definiert werden. Nummer und werden in eckigen
Außerdem sollte sie eine kurze Klammern zitiert (Beispiel: Wie
Darstellung schon bekannter, in [12] dargestellt …). Fußnoten
ähnlicher Lösungsversuche enthalten sieht das Layout nicht vor.
(Stand der Literatur). Am Schluss
des Beitrages kann ein Dank an ■ Reichen Sie Ihren Beitrag sowohl in
Förderer der Arbeit, z. B. Lehrer und ausgedruckter Form als auch als PDF
doi: 10.7795/320.202106Mathematik | Seite 16
@
Impressum
Impressum
wissenschaft
Junge Wissenschaft
c/o Physikalisch-Technische
Bundesanstalt (PTB)
www.junge-wissenschaft.ptb.de
Redaktion
Dr. Sabine Walter, Chefredaktion
Junge Wissenschaft
Paul-Ducros-Str. 7
30952 Ronnenberg
E-Mail: sabine.walter@verlag-
jungewissenschaft.de
Tel.: 05109 / 561 508
Verlag
Dr. Dr. Jens Simon,
Pressesprecher der PTB
Bundesallee 100
38116 Braunschweig
E-Mail: jens.simon@ptb.de
Tel.: 0531 / 592 3006
(Sekretariat der PTB-Pressestelle)
Design & Satz
Sabine Siems
Agentur „proviele werbung“
E-Mail: info@proviele-werbung.de
Tel.: 05307 / 939 3350
doi: 10.7795/320.202105You can also read