Load Distribution in the Lumbar Spine During Modeled Compression Depends on Lordosis - DORA 4RI
←
→
Page content transcription
If your browser does not render page correctly, please read the page content below
ORIGINAL RESEARCH
                                                                                                                                              published: 10 June 2021
                                                                                                                                      doi: 10.3389/fbioe.2021.661258

                                            Load Distribution in the Lumbar
                                            Spine During Modeled Compression
                                            Depends on Lordosis
                                            Andreas Müller 1,2,3*, Robert Rockenfeller 4 , Nicolas Damm 1 , Michael Kosterhon 5 ,
                                            Sven R. Kantelhardt 5 , Ameet K. Aiyangar 2,6 and Karin Gruber 1,3
                                            1
                                             Institute for Medical Engineering and Information Processing (MTI Mittelrhein), University Koblenz-Landau, Koblenz,
                                            Germany, 2 Mechanical Systems Engineering, Swiss Federal Laboratories for Materials Science and Technology (EMPA),
                                            Duebendorf, Switzerland, 3 Department of Mathematics and Natural Sciences, Institute of Sports Science, University
                                            Koblenz-Landau, Koblenz, Germany, 4 Department of Mathematics and Natural Sciences, Mathematical Institute,
                                            UniversityKoblenz-Landau, Koblenz, Germany, 5 Department of Neurosurgery, University Medical Centre, Johannes
                                            Gutenberg-University Mainz, Mainz, Germany, 6 Department of Orthopedic Surgery, University of Pittsburgh, Pittsburgh, PA,
                                            United States

                                            Excessive or incorrect loading of lumbar spinal structures is commonly assumed as
                                            one of the factors to accelerate degenerative processes, which may lead to lower
                                            back pain. Accordingly, the mechanics of the spine under medical conditions, such
                                            as scoliosis or spondylolisthesis, is well-investigated. Treatments via both conventional
                                            therapy and surgical methods alike aim at restoring a “healthy” (or at least pain-free)
                             Edited by:
                       Marwan El-Rich,
                                            load distribution. Yet, surprisingly little is known about the inter-subject variability of
                      Khalifa University,   load bearings within a “healthy” lumbar spine. Hence, we utilized computer tomography
                  United Arab Emirates
                                            data from 28 trauma-room patients, whose lumbar spines showed no visible sign of
                         Reviewed by:
                                            degeneration, to construct simplified multi-body simulation models. The subject-specific
                         Navid Arjmand,
   Sharif University of Technology, Iran    geometries, measured by the corresponding lumbar lordosis (LL) between the endplates
                       Luigi La Barbera,    of vertebra L1 and the sacrum, served as ceteris paribus condition in a standardized
             Politecnico di Milano, Italy
                                            forward dynamic compression procedure. Further, the influence of stimulating muscles
                *Correspondence:
                      Andreas Müller
                                            from the M. multifidus group was assessed. For the range of available LL from 28 to
      andreas.mueller@uni-koblenz.de        66◦ , changes in compressive and shear forces, bending moments, as well as facet
                                            joint forces between adjacent vertebrae were calculated. While compressive forces
                    Specialty section:
         This article was submitted to
                                            tended to decrease with increasing LL, facet forces were tendentiously increasing. Shear
                        Biomechanics,       forces decreased between more cranial vertebrae and increased between more caudal
                a section of the journal    ones, while bending moments remained constant. Our results suggest that there exist
       Frontiers in Bioengineering and
                        Biotechnology       significant, LL-dependent variations in the loading of “healthy” spinal structures, which
          Received: 30 January 2021         should be considered when striving for individually appropriate therapeutic measures.
            Accepted: 19 April 2021
                                            Keywords: biomechanics, forward dynamics, MBS model, musculo skeletal model, lumbar lordosis, curvature,
           Published: 10 June 2021
                                            Cobb angle
                             Citation:
   Müller A, Rockenfeller R, Damm N,
        Kosterhon M, Kantelhardt SR,
    Aiyangar AK and Gruber K (2021)
                                            1. INTRODUCTION
Load Distribution in the Lumbar Spine
        During Modeled Compression
                                            The spine constitutes a highly mobile skeletal structure with a wide inter-individual variation in
                Depends on Lordosis.        the characteristics of its double-S shape. High mechanical stresses in daily life and sports may cause
 Front. Bioeng. Biotechnol. 9:661258.       injuries that trigger long-term degenerative processes of the intervertebral disks (IVD) or the facet
     doi: 10.3389/fbioe.2021.661258         joints. The lumbar spine is particularly affected by degenerative phenomena because it carries the

Frontiers in Bioengineering and Biotechnology | www.frontiersin.org               1                                             June 2021 | Volume 9 | Article 661258
Müller et al.                                                                                              Lordosis-Dependent Spinal Load Distribution

whole weight of the body above the affected level (Hajihosseinali          Center in Mainz (Figure 1A). These images were taken in supine
et al., 2015). Deviations in the double-S shape may alter internal         position, where the loading of spinal structures is significantly
load distributions and accelerate degenerative processes. These            reduced compared to standing position (Wilke et al., 1999, Table
deviations are commonly quantified using the Cobb method                   1). After semi-automatic segmentation, the resulting surfaces
(Cobb, 1948), which was originally introduced to describe                  were loaded as rigid bodies into the MBS tool Simpack (Dassault
degrees of scoliosis, i.e., deviations in the coronal plane (White         Systèmes Deutschland GmbH, Munich, Germany), and oriented
and Panjabi, 1990, Chapter 3.1). Adapting the Cobb method to               to upright (standing) position, under preservation of the subject-
the sagittal plane, the lumbar lordosis (LL) can be defined as             specific geometries, namely curvature, disk space, and facet
the sagittal Cobb angle between upper endplate of vertebra L1              joint gap. The whole lumbar spine was rigidly re-oriented from
and the endplate of the sacrum (SA). In contrast to scoliosis,             supine to upright without altering the relative, intersegmental
quantitative investigations regarding the effects of deviations in         orientations. “Upright” was defined such that the cranial endplate
the sagittal curvature on spinal load distributions are scarce,            of the L3 vertebra was oriented parallel to the transversal plane
especially when distinguishing between thoracic kyphosis (Briggs           (Rupp et al., 2015, Table 1), i.e., perpendicular to the line of action
et al., 2007; Bruno et al., 2012) and lumbar lordosis (Keller              of the gravitational force. The individual L3 vertebral orientation
et al., 2005; Bruno et al., 2017). While the latter studies were           with respect to the other vertebrae remained unchanged from the
principally able to show an effect of changes in lordosis on               original supine state. This definition was maintained for all the
the load distribution within the lumbar spine, a depiction of              models to ensure comparability. The model details described in
quantitative dependencies is to date still missing.                        the following had been previously validated against in vitro and
    Understanding the variability in loading of certain spinal             in vivo data (Damm et al., 2019).
structures can be beneficial in clinical contexts, e.g., for the               The six degrees-of-freedom, visco-elastic intervertebral body
classification of pathologies or planning of surgical interventions.       joints between two adjacent vertebrae, representing IVDs,
It is assumed that degenerative alterations are a result of sagittal       were modeled by non-linear torque-angle and compressive
imbalance (Glassman et al., 2005), which can be measured, for              force-deformation characteristics as well as linear shear force-
example, by the sagittal vertical axis, i.e., the minimal distance         deformation and damping (Damm et al., 2019, Figure 4,
between the C7 plumb-line and the posterior-superior vertebral             Equations 1 and 2). The center of mass of the sacrum was
corner of SA (Jackson and McManus, 1994), or the odontoid hip              placed in the origin of a coordinate system, where positive z
axis, i.e., the angle between the vertical line through the hip axis       points upwards (cranial), positive y points frontal (anterior),
and a line from the hip axis to the dens of C2 (Le Huec et al.,            and positive x points right (dexter). As compressive force was
2019). A further important characteristic constitutes the spino-           measured as the vertical (superior–inferior) part of the force
pelvic configuration, usually represented by the three angular             in each reference frame, it could also be referred to as z-force.
measurands pelvic incidence (PI), sacral slope (SS), and pelvic tilt       Accordingly, the (anterior–posterior) shear force is referred
(PT). It holds PI = SS+PT and it is assumed that optimal sagittal          to as y-force and the flexion-extension moment around the
balance corresponds to a small PI-to-LL difference (1PILL),                transversal axis as x-torque. Facet joints were represented by one
particularly |1PILL| = |PI − LL| ≤ 15◦ (Rothenfluh et al.,                 degree-of-freedom, linear visco-elastic force elements, oriented
2015). Higher discrepancy between these two parameters is                  perpendicular to the regression plane between the (curved)
thought to result in spinal diseases and malfunctions (Roussouly           surfaces of the adjacent superior and inferior articular facets.
and Pinheiro-Franco, 2011; Senteler et al., 2014; Bassani et al.,          Forces were measured perpendicular to the regression plane
2019). For example, hyperlordosis (large LL) is assumed to                 between the superior and inferior articular facets, where negative
accelerate discopathies and facet joint degenerations, whereas             (pulling) forces were not considered for these structures. In fact
hypolordosis (small LL) is connected with high compressive peak            in some cases, particularly for the upper spinal levels, the facet
forces in the IVDs. These and similar plausibility statements              force remained at 0 N, indicating the absence of compression, i.e.,
frequently occur in the literature, however, mainly in absence             no facet surface contact due to the loading distribution. Instead,
of a corresponding quantification (cf. Shirazi-Adl et al., 2002;           the capsule ligaments were compensating for the pulling force.
Keller et al., 2005; Meakin et al., 2009; Gezelbash et al., 2016;              Next, subject-specific ligament and muscle insertion points
Jentzsch et al., 2017). Hence, the aim of this study was to conduct        on the bony surfaces were identified by anatomical landmarks
a quantitative investigation regarding the influence of varying LL         (Schünke et al., 2015), checked and confirmed by the clinical
on the load distribution within the lumbar spine using forward             co-authors (neuro-surgeons from the University Medical Center
dynamic models.                                                            in Mainz), and connected by one-dimensional force elements
                                                                           (see Figures 1B–D). Ligaments were likewise modeled as visco-
                                                                           elastic passive elements, exhibiting a non-linear force-lengths
2. MODEL AND METHODS                                                       characteristic and linear damping (Damm et al., 2019, Figure
                                                                           5, Equations 6 and 7). With regard to muscle representation,
A total of 28 lumbar spinal models were constructed on the                 M. multifidus and M. psoas major were modeled by point-to-
basis of in vivo computer tomography (CT) data from trauma-                point Hill-type active force elements (Rockenfeller and Günther,
room patients with otherwise healthy spines (i.e., no signs of             2016, Appendix A). For both ligaments and muscles, pre-strain,
degeneration; 32.7 ± 14.5 years, where the age of two subjects             and slack lengths, respectively, were scaled with the subject-
was not known), provided anonymized by the University Medical              specific geometries (Rockenfeller et al., 2020). Maximum muscle

Frontiers in Bioengineering and Biotechnology | www.frontiersin.org    2                                         June 2021 | Volume 9 | Article 661258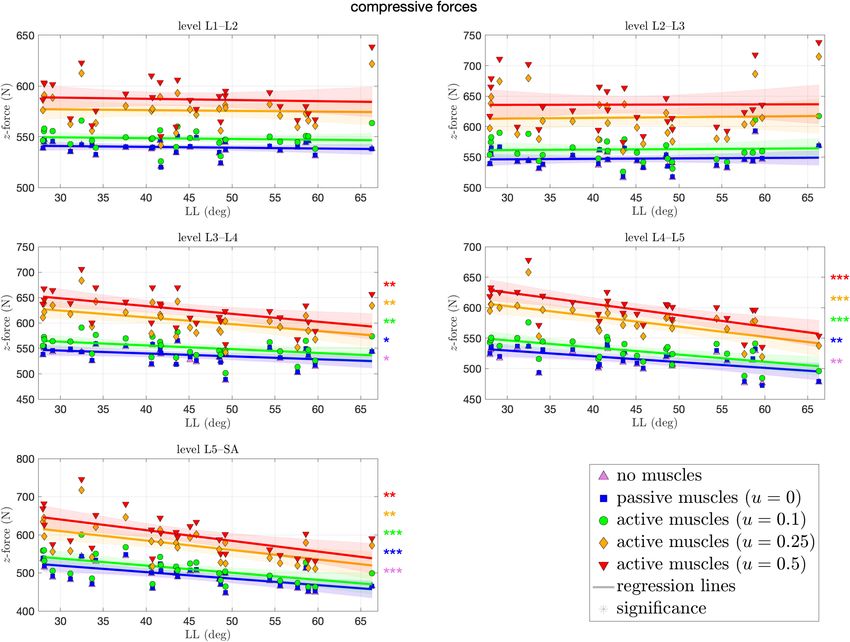
Müller et al.                                                                                                                 Lordosis-Dependent Spinal Load Distribution

  FIGURE 1 | (A) CT image of the lumbar spine, rotated to standing position. (B) Computer model based on the subject-specific CT geometries, including passive
  structures [intervertebral disks (IVDs), facet joints and ligaments]. (C,D) In a last step, active force elements, muscles, are inserted into the model according to
  individual landmarks. The pelvis serves as origin for the M. psoas major group.

forces were adapted from the literature (Christophy et al., 2012),                       66.3◦ , which corresponds well with literature data (Chernukha
with 21 N for strands from the M. multifidus and 80 N for strands                        et al., 1998; Lafage et al., 2009). Smaller LL indicate hypolordotic
from the M. psoas major.                                                                 spines (Figure 2A) and larger LL indicate hyperlordotic spines
   To ensure maximum possible comparability between our                                  (Figure 2C). However, it should be noted that the LL alone does
forward dynamic loading simulations, boundary conditions for                             not necessarily constitute a unique measure, as different internal
each spine were standardized as follows: First, the lumber                               (L2–L5) curvatures may correspond to the same overall LL
spine was encastered at the sacrum level. Second, the anterior–                          (Been and Kalichman, 2014, Figure 2). Therefore, we additionally
posterior and medial-lateral translation of vertebra L1 was                              compared the LL to the anatomic parameters that characterize
prohibited to avoid tilting, while the other degrees of freedom                          the sagittal balance, namely PI, SS, and 1PILL. The PI is the
were not restricted. This restriction was supposed to represent                          angle between the lines going from the midpoint of the line
multi-level stabilizing musculature, which was not implemented                           connecting the femur heads to the midpoint of the S1 endplate
here, in order to emphasize the effect of changes in load                                and the normal of the S1 endplate at this midpoint. The SS
distribution per change in LL. Third, a load of 500 N, representing                      is the angle between the S1 endplate and the transversal plane
the upper body weight (Nachemson, 1981, Table 1), was applied                            (Lafage et al., 2009) (see again Figure 2D). The 1PILL value
on the center of mass of the vertebral body L1 (see Figure 2).                           is the difference between PI and LL. We obtained a PI of 46.3
Fourth, a standardized forward dynamics simulation of a 2 s time                         ± 10.1◦ (mean ± standard deviation) with a range between
horizon, ensured each spine to reach a final equilibrium state                           29.5 and 62.5◦ , a SS of 41.7 ± 7.6◦ with a range between 24.1
   Fourth, possible influence of muscle activity on spinal loading                       and 56.0◦ , and a 1PILL of 2.3 ± 6.6◦ with a range between
was investigated for only the M. multifidus group, which is known                        −11.2 and 16.0◦ . Figure 3 shows the relation between LL and
to have a stabilizing effect on the lumbar spine (Macintosh and                          PI (R2 = 0.65), LL and SS (R2 = 0.82), as well as LL and
Bogduk, 1986; Danneels et al., 2001; Ward et al., 2009). Therefore,                      1PILL (R2 = 0.18) for our 28 samples. On average, an increase
a total of five different scenarios regarding muscle participation                       of one degree LL was associated with an increase of ∼0.74◦ in
were conducted: (i) “no muscles,” denoting the absence of any                            PI and 0.62◦ in SS, which well corresponds to literature data—cf.
active or passive muscle force, (ii) “passive muscles (u = 0),”                          Roussouly et al. (2005, Tables 1, 2) and Naserkhaki et al. (2016,
denoting the absence of any neural stimulation/excitation 0 ≤                            Figure 1). For 1PILL, we found a decrease of 0.26◦ per degree
u ≤ 1 (cf. Rockenfeller and Günther, 2016), and (iii)–(v)                                LL, which has, to our knowledge, not yet been reported. As only
“active muscles (u = 0.1, 0.25, or 0.5),” denoting the degree of                         a single hypolordotic spine exhibited a |1PILL| > 15◦ , we did
stimulation of the M. multifidus group.                                                  not perform 1PILL-dependent analysis, as presented in Senteler
   To assess the influence of the sagittal curvature on the                              et al. (2014), Rothenfluh et al. (2015).
simulation results, we defined the LL as a measure parameter                                 The output quantities, which were assumed to depend on
to define the degree of lumbar lordosis (Vrtovec et al., 2009).                          the LL, obtained from our standardized forward dynamic
Therefore, the cranial endplates of L1 and SA are virtually                              simulations, were (i) the changes in sagittal Cobb angles for all
extended and their intersection angle in the sagittal plane is                           vertebrae between the start (t = 0 s, no loading) and the end (t =
determined, cf. Figure 2D. From the available data, we obtained                          2 s, loaded equilibrium) of the simulation, (ii) the compressive
a mean LL of 44.0 ± 11.0◦ with a range between 28.0 and                                  (z-)forces in the IVDs between two adjacent vertebrae, (iii)

Frontiers in Bioengineering and Biotechnology | www.frontiersin.org                  3                                               June 2021 | Volume 9 | Article 661258
Müller et al.                                                                                                                     Lordosis-Dependent Spinal Load Distribution

  FIGURE 2 | Examples of lumbar spinal curvature: (A) hypolordotic (LL= 28◦ ), (B) regular (LL= 49.2◦ ), and (C) hyperlordotic (LL= 66.3◦ ). The method of calculating
  the LL, the sacral slope (SS), and the pelvic incident (PI) is sketched in (D) and described in the text. A vertical force of 500 N (blue arrows with dashed line of action)
  was applied on the COM of the vertebral body of L1 in all models.

  FIGURE 3 | PI, SS, and 1PILL plotted against LL. The blue circles represent the PI, orange asterisks the SS, and black squares the 1PILL for the 28 individual lumbar
  spines. Regressions lines (with confidence bands) are displayed in corresponding colors and their equations as well as coefficients of determination (R2 ) are stated in
  the annotations.

the IVD shear (y-)forces, (iv) the IVD torques around the                                   where Ftn denotes the cumulative distribution function of the
transversal (x-)axis, and (v) the facet joint forces. To assess the LL                      Student’s t-distribution with n degrees of freedom. Small p-
dependency of these quantities, a regression line for each vertebra                         values indicate that the observed correlation is unlikely under
(respectively level) and for each mode was calculated in a least-                           the null hypothesis “r = 0,” which should thus be rejected. All
squares sense. A subsequent significance-of-correlation t-test was                          obtained correlations r along with the corresponding p-values are
carried out, using the test statistic                                                       summarized in Table 1 (Appendix A). The resultant slopes s of
                                                                                            the regression lines can be calculated by s = r · σ (Y)/σ (LL),
                                   √                                                        with σ being the standard deviation operator. Uncertainty of
                                 r· n−2                                                     the regression analysis is indicated by 95% confidence bands
                               T= √       ,
                                   1 − r2                                                   f (LL) ± ω(LL) around the regression line f (LL), with

                                                                                                                                      s                   2
where r = cor(LL, Y) denotes Pearson’s correlation coefficient                                                                            1     LL − LL
between LL and the observed quantity Y, and n = 27 (number of                                      ω(LL) = tn−2,0.95 · σ (Y) ·              +                  ,
                                                                                                                                          n (n − 1)2 · σ (LL)2
available spinal models minus one) the degrees of freedom (see
Zar, 1972). The corresponding p-value was calculated as
                                                                                            where tn−2,0.95 denotes the 95%-quantile of the t-distribution
                                                                                           with n − 2 degrees of freedom, and LL the mean value of LL.
                            p = 2 · 1 − Ftn (T) ,                                           Slopes for all modes and output quantities, together with their

Frontiers in Bioengineering and Biotechnology | www.frontiersin.org                     4                                                 June 2021 | Volume 9 | Article 661258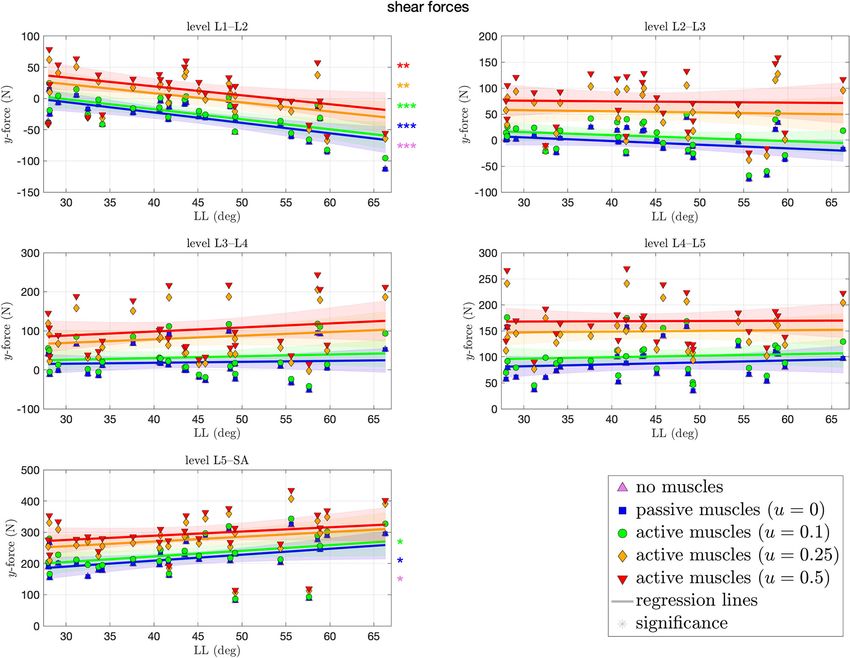
Müller et al.                                                                                                                   Lordosis-Dependent Spinal Load Distribution

  FIGURE 4 | Differences in Cobb angles during compression of all 28 vertebrae against LL. Colors and marker symbols of the data points and the corresponding
  regression lines consistently correspond to the modes: lilac up-pointing triangles for simulations without muscles involved; blue squares for passive muscles; as well
  as green circles, orange diamonds, and red down-pointing triangles for muscle stimulation of u ∈ {0.1, 0.25, 0.5}, respectively. Confidence bands of the regression are
  shown as pale areas of the corresponding color. The significance of the statistical test is indicated by alongside asterisks (** = significant with 0.001 ≤ p < 0.05, *** =
  highly significant with p < 0.001).

95% confidence intervals (CI), are listed in Table 2 (likewise                            ∼2◦ (0.045◦ per degree LL) increase for L1 and decrease for
Appendix A).                                                                              L5 is observed over the whole LL range. Notably, changes in
                                                                                          scenarios with highly stimulated muscles were less significant
3. RESULTS                                                                                than for passive or moderately stimulated muscles, indicating a
                                                                                          stabilizing effect.
Orienting the spine upright from supine position, as well as                                 Figure 5 depicts the compressive force resulting at each level
applying loading and possibly muscle forces, changes the initial                          of each spinal model at the end of the simulation. These forces
LL between start (t = 0 s) and end (t = 2 s) of the                                       ranged from 446–746 N, both at the L5–SA level. For the upper
simulation. In Figure 4, these changes are quantified for each                            levels L1–L2 and L2–L3, we observed no significant difference
spinal level and each muscle stimulation protocol. Expectedly,                            across all curvatures. The more caudal the level, the more
for the mid vertebra L3, no significant changes in the Cobb angle                         significant the decrease in force for the cases of no muscles
were observed for any muscle stimulation. For the neighboring                             and passive muscles alike, up to −2.8 N (CI: [−4.6, −1] N) per
vertebrae L2 and L4, we observed a moderate, yet (highly)                                 degree LL at the L5–SA level for high muscle stimulation. In case
significant, increase, and decrease, respectively, of ∼1.5◦ over the                      of highly stimulated muscles, the most significant decrease in
whole LL range, i.e., ∼0.03◦ change per degree LL (see Table 2 in                         compressive force happens at the level L4–L5. Tendencies toward
Appendix A for concrete values and CI). This trend is continued                           an increase in compressive force with LL were not found at all,
for the outer vertebrae L1 and L5, where a higher change of                               although the most hyperlordotic spinal model yielded the highest

Frontiers in Bioengineering and Biotechnology | www.frontiersin.org                   5                                                June 2021 | Volume 9 | Article 661258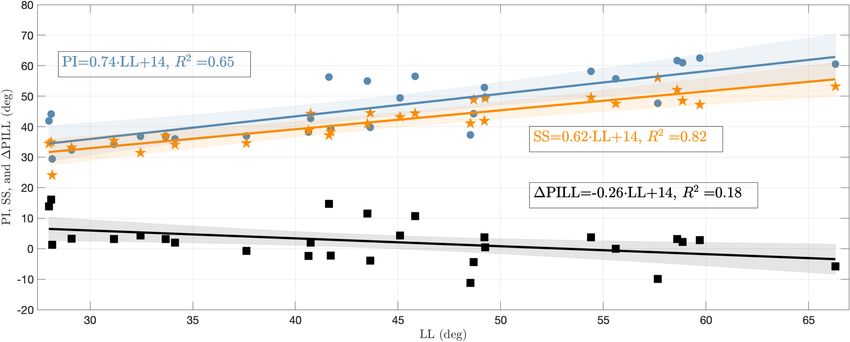
Müller et al. Lordosis-Dependent Spinal Load Distribution
FIGURE 5 | Compressive (z-)force between each pair of adjacent vertebrae against lumbar lordosis (LL). Colors and marker symbols of the data points and the
corresponding regression lines consistently correspond to the modes: lilac up-pointing triangles for simulations without muscles involved; blue squares for passive
muscles; as well as green circles, orange diamonds, and red down-pointing triangles for muscle stimulation of u ∈ {0.1, 0.25, 0.5}, respectively. Confidence bands of
the regression are shown as pale areas of the corresponding color. The significance of the statistical test is indicated by alongside asterisks (* = tendency with
0.05 ≤ p ≤ 0.1, ** = significant with 0.001 ≤ p < 0.05, *** = highly significant with p < 0.001).
forces in the upper segments. Throughout all levels, an increase ±3 Nm, with negative values (indicating forward bending) occur
in muscle stimulation yielded absolute higher compressive forces. predominantly on the L5–SA level. None of the correlation
Figure 6 depicts the shear forces resulting at each level of coefficients was significantly different from zero, i.e., there
each spinal model at the end of the simulation. These forces was no LL dependence. Except for the L4–L5 level, higher
ranged from −114 N (L1–L2) to 438 N (L5–SA). Contrary to the muscle stimulation was associated with higher absolute bending
compressive force, shear forces (highly) significantly decreased moments. Absolute moments around the transversal and
(increased in posterior direction) with ∼1.6 N per degree LL longitudinal axes were not significantly different from zero.
at the L1–L2 level. The more caudal the level, the more of an Finally, Figure 8 shows the forces within the sinister (left
increase in shear force, absolute and with LL, was observed, column of the figure) and dexter (right column) facet joint. On
although significance is only given on the L5–SA level with up to the first glance, we observe in each level and for each mode
1.9 N (CI: [−0.14,4] N) per degree LL. Throughout all levels, an on each side a trend toward an increase of facet force with
increase in muscle stimulation yielded higher anteriorly directed LL. This increase is, however, only significant for certain cases,
shear forces. predominantly for the lower levels and lower muscle stimulation,
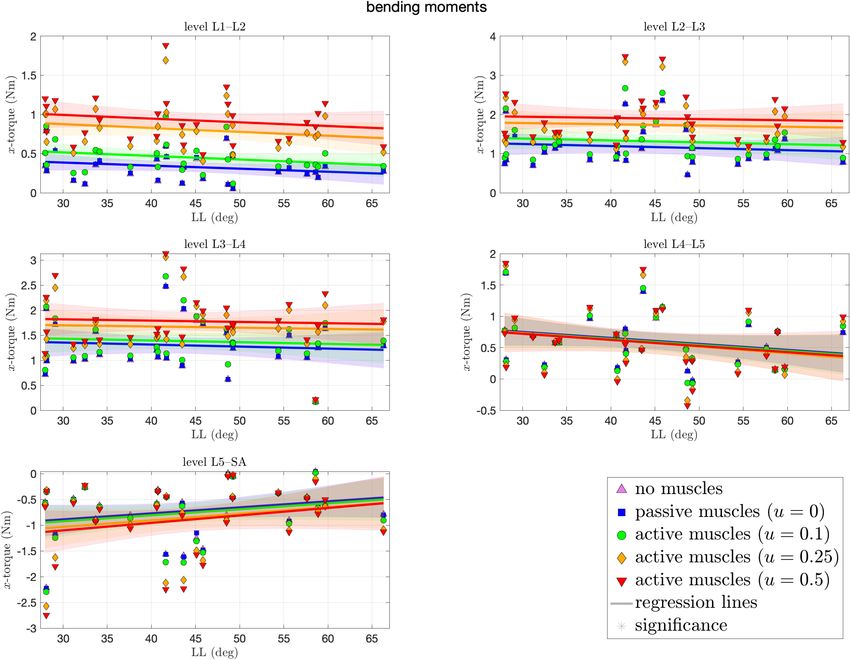
Figure 7 depicts the bending moments around the transversal respectively, with an increase of as much as 1.6 N per degree LL
axis at each level of each spinal model at the end of the at the L5–SA level. Especially on the L1–L2 and L3–L4 level, no
simulation. Depending on the degree of muscle stimulation significance was found at all. Throughout all levels, an increase in
and level, bending moments lie mostly within the range of muscle stimulation yielded absolute higher facet forces.
Frontiers in Bioengineering and Biotechnology | www.frontiersin.org 6 June 2021 | Volume 9 | Article 661258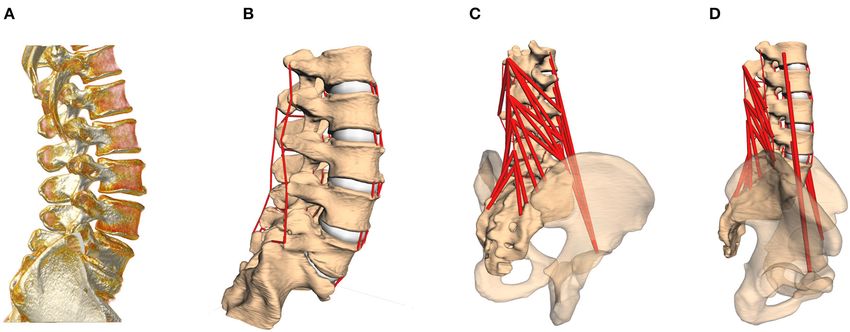
Müller et al.                                                                                                               Lordosis-Dependent Spinal Load Distribution

  FIGURE 6 | Shear (y-)force between each pair of adjacent vertebrae against lumbar lordosis (LL). Colors and marker symbols of the data points and the
  corresponding regression lines consistently correspond to the modes: lilac up-pointing triangles for simulations without muscles involved; blue squares for passive
  muscles; as well as green circles, orange diamonds, and red down-pointing triangles for muscle stimulation of u ∈ {0.1, 0.25, 0.5}, respectively. Confidence bands of
  the regression are shown as pale areas of the corresponding color.

4. DISCUSSION                                                                           lies in the formulation of quantitative statements regarding
                                                                                        the LL-dependent load distribution during forward dynamic
We have shown the effect of varying LL and varying stimulation                          simulations, e.g., “Per one degree increase in LL, the compressive
of the M. multifidus on the load distribution within the lumbar                         force within the IVD between L5 and SA decreases by 2.8 N
spine during forward dynamic compression. Therefore, the CT                             (CI: [−4.6, −1] N).” Of course, our absolute output values
data from 28 asymptomatic subjects in supine position were                              have to be treated with caution when comparing them directly
transferred into a priorly validated MBS model and underwent                            to in vivo (or more elaborated in silico) situations. Yet, this
standardized loading conditions, representing upright standing.                         study might serve as an impulse for subsequent quantitative
The range of observed LL in our study (28–66.3◦ ) well coincides                        corroborations of conjectured coherences. In the following,
with prior observations of 28.8–72.9◦ (Wood et al., 1996, Table                         we consider clinical applications, depending on patient-specific
1). Likewise, the changes in LL due to the transition between                           lordosis, and address the role of muscles in the stabilization of
unloaded supine and loaded standing position consistently                               the lumbar spine.
account for only a few degrees—cf. Figure 4 (upper left),
Wood et al. (1996), and Meakin et al. (2009). Contrary to                               4.1. Clinical Implications of Varying LL
existing literature on the influence of curvature on spinal                             In clinical practice, physicians are mostly faced with hypolordosis
loading (Briggs et al., 2007; Bruno et al., 2012, 2017; Galbusera                       (small LL) due to degenerative diseases, e.g., reduced height
et al., 2014; Naserkhaki et al., 2016), the novelty of our study                        of the intervertebral disk space or flattening of vertebrae

Frontiers in Bioengineering and Biotechnology | www.frontiersin.org                 7                                              June 2021 | Volume 9 | Article 661258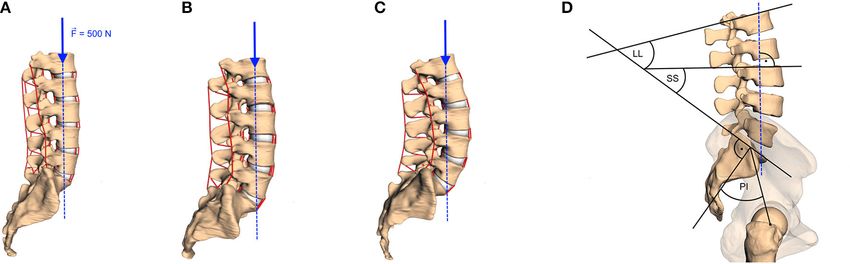
Müller et al.                                                                                                                Lordosis-Dependent Spinal Load Distribution

  FIGURE 7 | Bending moments (x-torques) around the transversal axis between each pair of adjacent vertebrae against lumbar lordosis (LL). Colors and marker
  symbols of the data points and the corresponding regression lines consistently correspond to the modes: lilac up-pointing triangles for simulations without muscles
  involved; blue squares for passive muscles; as well as green circles, orange diamonds, and red down-pointing triangles for muscle stimulation of u ∈ {0.1, 0.25, 0.5},
  respectively. Confidence bands of the regression are shown as pale areas of the corresponding color.

due to osteoporotic changes. LL is known to decrease with                               may favor diseases, such as posterior facets arthritis, Baastrup
increasing age (Gelb et al., 1995). With lower LL, the gravity                          disease, and spondylolisthesis (Roussouly and Pinheiro-Franco,
line is located anteriorly, away from its ideal position between                        2011). Accordingly, we observed in our model a tendency of
the hip joints. As a consequence, compressive force on the                              increasing facet force with increasing LL (see Figure 8). These
intervertebral disks increases (see also our Figure 5), which                           findings coincide with clinical investigations (Sahin et al., 2015),
may favor discopathies that result in further decrease of the                           which found a significant correlation of high LL values with
LL. A recent meta-analysis of 13 studies with a total of 796                            the degree of lumbar facet joint degeneration in CT scans of
patients (Chun et al., 2017) found that patients with small LL                          723 patients.
tend to suffer more often from low back pain (independent                                   Sagittal imbalance in general has been shown to correlate with
of the underlying pathology). In a subgroup analysis of five                            clinical symptoms (Glassman et al., 2005; Senteler et al., 2014;
studies, comparing individuals with disk herniation or severe                           Rothenfluh et al., 2015). Particularly, an anterior misalignment
degeneration with a healthy control group, it was further                               of C7, and thus of the thoracic weight, results in high
observed that this condition is more likely to occur in individuals                     compression mainly caused by compensatory muscular forces
with hypolordosis.                                                                      (Galbusera et al., 2013). This effect is less prominent, yet
   Contrary, in a hyperlordotic spine (high LL), the gravity                            still identifiable, for backward misalignment (Bassani et al.,
line is located dorsally and thus close to the posterior spinal                         2019). Hence, careful evaluation of the individual LL and
structures, such as the facet joints and spinous processes. This                        sagittal profile of patients is of utmost importance to avoid

Frontiers in Bioengineering and Biotechnology | www.frontiersin.org                 8                                               June 2021 | Volume 9 | Article 661258
Müller et al. Lordosis-Dependent Spinal Load Distribution
FIGURE 8 | Facet force between each pair of adjacent articular facets against lumbar lordosis (LL). Colors and marker symbols of the data points and the
corresponding regression lines consistently correspond to the modes: lilac up-pointing triangles for simulations without muscles involved; blue squares for passive
muscles; as well as green circles, orange diamonds, and red down-pointing triangles for muscle stimulation of u ∈ {0.1, 0.25, 0.5}, respectively. The significance of the
statistical test is indicated by alongside asterisks (* = tendency with 0.05 ≤ p ≤ 0.1, ** = significant with 0.001 ≤ p < 0.05).
acceleration of degenerative processes. Although lumbar posture 4.2. The Role of M. multifidus in Stabilizing
can be influenced to a certain extent by muscle hypertrophy the Lumbar Spine
training (Scannell and McGill, 2003), in severe cases surgical Lower back muscles, and especially the M. multifidus, play an
correction might be required. In general, utilization of subject- important role in stabilizing the lumbar spine (Macintosh and
specific lumbar spine models might have the ability to Bogduk, 1986; Goel et al., 1993; Kaigle et al., 1995; Wilke et al.,
assist surgeons to correctly restore the individual balance. 1995; Panjabi, 1999; Danneels et al., 2001; Ward et al., 2009).
These models should be based on (supine) CT data and For example, lower back pain patients were shown to have
(standing) radiographs to allow precise measurements of significantly smaller cross-sectional area of their M. multifidus
anatomical parameters, such as PI, LL, and other (multi-level) (Danneels et al., 2000; Kamaz et al., 2007; Hides et al., 2008)
Cobb angles. and were less able to voluntarily contract the M. multifidus
Frontiers in Bioengineering and Biotechnology | www.frontiersin.org 9 June 2021 | Volume 9 | Article 661258Müller et al. Lordosis-Dependent Spinal Load Distribution
in atrophic segments (Wallwork et al., 2009). This becomes 6. CONCLUSION
particularly crucial for hypolordotic spines, where holding forces
in posterior structures are required. As we have shown in The load distribution and stabilizing effect of the M. multifidus
Figure 4, LL increases with increasing muscle force, which for different LL were investigated by using simplified forward
is consistent to findings regarding the correlation of muscle dynamic MBS models of the lumbar spine. Based on clinical
volume and LL (Meakin and Aspden, 2012; Meakin et al., CT data, 28 models with subject-specific geometries, including
2013). passive structures as well as two muscle groups, were constructed.
As we introduced the varying stimulation of the M. multifidus To emphasize a possible dependence of load distribution on
as a second ceteris paribus condition in our model, the the LL, standardized orientation and loading conditions as
influence of varying muscle force on the load distribution well as generic parameters for passive and active structures
could be assessed. In Figures 5–8, we observed an increase were used. Resulting compressive and shear IVD forces,
in compressive and shear forces as well as facet forces with IVD bending moments, and facet forces were displayed
increasing muscle stimulation. However, the significance of and quantitatively connected to LL via the corresponding
the LL dependence of these forces were smaller for higher correlations. Tendentiously, IVD compressive forces in
stimulation values, consistent to observations regarding the hypolordotic lumbar spines were higher than in hyperlordotic
application of follower load (Patwardhan et al., 1999). Hence, lumbar spines. In contrast, facet joint forces increased with
higher muscle forces seem to compensate for structural increasing LL. Alterations in shear forces depended on the
deficiencies, see again Scannell and McGill (2003). These findings vertebral level and bending moments did not show any
underline the important interplay between LL and muscle significant change at all. Simulations with higher stimulation of
forces (primarily of the M. multifidus) in the development the M. multifidus resulted in less significant load distributions,
of degenerative spinal diseases. Thus, future individualized which may be explained by the stabilizing effect of these muscles.
therapy planning should benefit from careful consideration The clinical relevance of our findings was discussed.
of the delicate equilibrium of individual curvature and
muscle strength. DATA AVAILABILITY STATEMENT
The data analyzed in this study is subject to the
5. LIMITATIONS AND PERSPECTIVES following licenses/restrictions: medical CT data of patients.
Requests to access these datasets should be directed to
Several simplifying assumptions regarding our model approach andreas.mueller@uni-koblenz.de.
might have an influence on the absolute values of angles,
forces, and bending moments that were presented in Figures 4– AUTHOR CONTRIBUTIONS
8. First, our model only consists of pelvis, lumbar vertebrae,
IVDs, ligaments, facet joints, and two muscle groups. Yet, AM performed the model calculations, modified the MBS model,
geometries and muscle as well as ligament insertion points were and drafted the scaffold of the manuscript. RR performed the
extracted from subject-specific CT data. Second, the orientation statistical analysis and supervised the writing. ND developed the
of the spine with respect to a horizontal L3 endplate in general basic MBS model components, particularly the geometries on
does not account for real-life variation. As no vertebra C7 the basis of medical image data. MK and SK equally contributed
was available for most spines, a more realistic balance with to the identification of ligament and muscle insertion points
respect to the C7 plumb-line could not be performed. Third, as well as the discussion from a medical point of view. AA
as neither data about subject-specific weight or muscle cross- contributed to the biomechanical discussion and conducted a
section area was available, loading and muscle forces had to be final review of the manuscript. KG helped in developing the
chosen generically. model, provided the MBS graphics, and conducted a final review
For each of the mentioned limitations, it might be worth of the manuscript. All authors contributed to the article and
to conduct a sensitivity analysis regarding the LL dependence approved the submitted version.
of the load distribution. Regarding additional structures and
muscles, a quantitative assessment of LL-dependent stabilizing FUNDING
effects could lead to individual muscle hypertrophy training plans
toward appropriate posture. Regarding the vertebral orientation, AM was supported by funding from Mechanical Systems
a systematic variation of spinal alignment, as a second Engineering Laboratory, EMPA-Swiss Federal Laboratories for
independent variable besides LL, might yield configurations Materials Science and Technology, Duebendorf, Switzerland.
with particular high (or low) loading in certain structures
that could be connected to lower back pain. Regarding the SUPPLEMENTARY MATERIAL
loading protocol, the herein investigated compression ought
to be replaced by common movement tasks, e.g., flexion- The Supplementary Material for this article can be found
extension, equipped with as much individualized information online at: https://www.frontiersin.org/articles/10.3389/fbioe.
as available. 2021.661258/full#supplementary-material
Frontiers in Bioengineering and Biotechnology | www.frontiersin.org 10 June 2021 | Volume 9 | Article 661258Müller et al. Lordosis-Dependent Spinal Load Distribution
REFERENCES Hides, J., Gilmore, C., Stanton, W., and Bohlscheid, E. (2008). Multifidus size and
symmetry among chronic LBP and healthy asymptomatic subjects. Manual
Bassani, T., Casaroli, G., and Galbusera, F. (2019). Dependence of lumbar loads Ther. 13, 43–49. doi: 10.1016/j.math.2006.07.017
on spinopelvic sagittal alignment: an evaluation based on musculoskeletal Jackson, R. P., and McManus, A. C. (1994). Radiographic analysis of sagittal plane
modeling. PLoS ONE 14:e0207997. doi: 10.1371/journal.pone.0207997 alignment and balance in standing volunteers and patients with low back pain
Been, E., and Kalichman, L. (2014). Lumbar lordosis. Spine J. 14, 87–97. matched for age, sex, and size a prospective controlled clinical study. Spine 19,
doi: 10.1016/j.spinee.2013.07.464 1611–1618. doi: 10.1097/00007632-199407001-00010
Briggs, A. M., van Dieën, J. H., Wrigley, T. V., Greig, A. M., Phillips, B., Lo, S. Jentzsch, T., Geiger, J., König, M. A., and Werner, C. M. L. (2017). Hyperlordosis is
K., et al. (2007). Thoracic kyphosis affects spinal loads and trunk muscle force. associated with facet joint pathology at the lower lumar spine. Clin. Spine Surg.
Phys. Ther. 87, 595–607. doi: 10.2522/ptj.20060119 30, 129–135. doi: 10.1097/BSD.0b013e3182aab266
Bruno, A., Anderson, D., D’Agostino, J. M., and Bouxsein, M. (2012). The effect Kaigle, A. M., Holm, S. H., and Hansson, T. H. (1995). Experimental instability in
of thoracic kyphosis and sagittal plane alignment on vertebral compressive the lumbar spine. Spine 20, 421–430. doi: 10.1097/00007632-199502001-00004
loading. J. Bone Miner. Res. 27, 2144–2151. doi: 10.1002/jbmr.1658 Kamaz, M., Kireşi, D., Oğuz, H., Emlik, D., and Levendoğlu, F. (2007). CT
Bruno, A. G., Mokhtarzadeh, H., Allaire, B. T., Velie, K. R., de Paolis Kaluza, M. measurement of trunk muscle areas in patients with chronic low back pain.
C., Anderson, D. E., et al. (2017). Incorporation of CT–based measurements Diagn. Interv. Radiol. 13, 144–148.
of trunk anatomy into subject–specific musculoskeletal models of the spine Keller, T. S., Colloca, C. J., Harrison, D. E., Harrison, D. D., and Janik, T. J.
influences vertebral loading predictions. J. Orthopaed. Res. 35, 2164–2173. (2005). Influence of spine morphology on intervertebral disc loads and stresses
doi: 10.1002/jor.23524 in asymptomatic adults: Implications for the ideal spine. Spine J. 5, 297–309.
Chernukha, K. V., Daffner, R. H., and Reigel, D. H. (1998). Lumbar lordosis doi: 10.1016/j.spinee.2004.10.050
measurement. A new method versus Cobb technique. Spine 23, 74–79. Lafage, V., Schwab, F., Patel, A., Hawkinson, N., and Farcy, J. P. (2009).
doi: 10.1097/00007632-199801010-00016 Pelvic tilt and truncal inclination: two key radiographic parameters
Christophy, M., Faruk, S. N. A., Lotz, J. C., and O’Reilly, O. M. (2012). A in the setting of adults with spinal deformity. Spine 34, E599–E606.
musculoskeletal model for the lumbar spine. Biomech. Model. Mechanobiol. 11, doi: 10.1097/BRS.0b013e3181aad219
19–34. doi: 10.1007/s10237-011-0290-6 Le Huec, J. C., Thompson, W., Mohsinaly, Y., Barrey, C., and Faundez,
Chun, S. W., Lim, C. Y., Kim, K., Hwang, J., and Chung, S. G. (2017). A. (2019). Sagittal balance of the spine. Eur. Spine J. 28, 1889–1905.
The relationships between low back pain and lumbar lordosis: A doi: 10.1007/s00586-019-06083-1
systematic review and meta-analysis. The Spine Journal 17, 1180–1191. Macintosh, J. E., and Bogduk, N. (1986). The biomechanics of the lumbar
doi: 10.1016/j.spinee.2017.04.034 multifidus. Clin. Biomech. 1, 202–213. doi: 10.1016/0268-0033(86)90147-6
Cobb, J. R. (1948). Outline for the study of scoliosis. The American Academy of Meakin, J. R., and Aspden, R. M. (2012). Modelling the effect of variation in sagittal
Orthopedic Surgeons Instructional Course Lectures, volume 5. Ann Arbor, MI: curvature on the force required to produce a follower load in the lumbar spine.
Edwards. J. Mech. Med. Biol. 12:1250013. doi: 10.1142/S0219519412004466
Damm, N., Rockenfeller, R., and Gruber, K. (2019). Lumbar spinal ligament Meakin, J. R., Fulford, J., Seymour, R., Welsman, J. R., and Knapp, K. M. (2013).
characteristics extracted from stepwise reduction experiments allow for The relationship between sagittal curvature and extensor muscle volume in the
preciser modeling than literature data. Biomechanics and Modeling in lumbar spine. J. Anat. 222, 608–614. doi: 10.1111/joa.12047
Mechanobiology 19, 893–910. doi: 10.1007/s10237-019-01259-6 Meakin, J. R., Gregory, J. S., Aspden, R. M., Smith, F. W., and Gilbert, F. J. (2009).
Danneels, L., Vanderstraeten, G., Cambier, D., Witvrouw, E., and de Cuyper, The intrinsic shape of the human lumbar spine in the supine, standing and
H. (2000). CT imaging of trunk muscles in chronic low back pain sitting postures: characterization using an active shape model. J. Anat. 215,
patients and healthy control subjects. European Spine Journal 9, 266–272. 206–211. doi: 10.1111/j.1469-7580.2009.01102.x
doi: 10.1007/s005860000190 Nachemson, A. L. (1981). Disc pressure measurements. Spine 6, 93–97.
Danneels, L., Vanderstraeten, G., Cambier, D., Witvrouw, E., Stevens, V., doi: 10.1097/00007632-198101000-00020
and de Cuyper, H. (2001). A functional subdivision of hip, abdominal, Naserkhaki, S., Jaremko, J. L., and El-Rich, M. (2016). Effects of
and back muscles during asymmetric lifting. Spine 26, 114–121. inter-individual lumbar spine geometry variation on load-sharing:
doi: 10.1097/00007632-200103150-00003 geometrically personalized finite element study. J. Biomech. 49, 2909–2917.
Galbusera, F., Brayda-Bruno, M., Costa, F., and H. J. Wilke (2014). Numerical doi: 10.1016/j.jbiomech.2016.06.032
evaluation of the correlation between the normal variation in the sagittal Panjabi, M. M. (1999). The stabilizing system of the spine. Part I. Function,
alignment of the lumbar spine and the spinal loads. Journal of Orthopaedic dysfunction, adaption, and enhancement. J. Spinal Disord. Tech. 5, 383–389.
Research 32, 537–544. doi: 10.1002/jor.22569 doi: 10.1097/00002517-199212000-00001
Galbusera, F., H. J. Wilke, Brayda-Bruno, M., Costa, F., and Fornari, M. (2013). Patwardhan, A. G., Havey, R. M., Meade, K. P., Lee, B., and Dunlap, B. (1999).
Influence of sagittal balance on spinal lumar loads: a numerical approach. Clin. A follower load increases the load-carrying capacity of the lumbar spine in
Biomech. 28, 370–377. doi: 10.1016/j.clinbiomech.2013.02.006 compression. Spine 24, 1003–1009. doi: 10.1097/00007632-199905150-00014
Gelb, D. E., Lenke, L. G., Bridwell, K. H., Blanke, K., and McEnery, K. W. (1995). Rockenfeller, R., and Günther, M. (2016). Extracting low-velocity concentric and
An analysis of sagittal spinal alignment in 100 asymptomatic middle and older eccentric dynamic muscle properties from isometric contraction experiments.
aged volunteers. Spine 20, 1351–1358. doi: 10.1097/00007632-199520120-00005 Mathematical Biosciences 278, 77–93. doi: 10.1016/j.mbs.2016.06.005
Gezelbash, F., Shirazi-Adl, A., Arjmand, N., El-Ouaaid, Z., Plamondon, A., and Rockenfeller, R., Müller, A., Damm, N., Kosterhon, M., Kantelhardt, S. R., Frank,
Meakin, J. R. (2016). Effects of sex, age, body height and body weight on spinal R., et al. (2020). Muscle-driven and torque-driven centrodes during modeled
loads: sensitivity analyses in a subject-specific trunk muscle musculoskeletal flexion of individual lumbar spines are disparate. Biomech. Model. Mechanobiol.
model. J. Biomech. 49, 3492–3501. doi: 10.1016/j.jbiomech.2016.09.026 20, 267–279. doi: 10.1007/s10237-020-01382-9
Glassman, S. D., Bridwell, K., Dimar, J. R., Horton, W., Berven, S., and Schwab, F. Rothenfluh, D. A., Mueller, D. A., Rothenfluh, E., and Min, K. (2015).
(2005). The impact of positive sagittal balance in adult spinal deformity. Spine Pelvic incidence-lumbar lordosis mismatch predisposes to adjacent
30, 2024–2029. doi: 10.1097/01.brs.0000179086.30449.96 segment disease after lumbar spinal fusion. Eur. Spine J. 24, 1251–1258.
Goel, V. G., Kong, W., Han, J. S., Weinstein, J. N., and Gilbertson, L. doi: 10.1007/s00586-014-3454-0
G. (1993). A combined finite element and optimization investigation of Roussouly, P., Gollogly, S., Berthonnaud, E., and Dimnet, J. (2005).
lumbar spine mechanics with and without muscles. Spine 18, 1531–1541. Classification of the normal variation in the sagittal alignment of the
doi: 10.1097/00007632-199318110-00019 human lumbar spine and pelvis in standing position. Spine 30, 346–353.
Hajihosseinali, M., Arjmand, N., and Shirazi-Adl, A. (2015). Effect of body doi: 10.1097/01.brs.0000152379.54463.65
weight on spinal loads in various activities: a personalized biomechanical Roussouly, P., and Pinheiro-Franco, J. L. (2011). Biomechanical analysis of the
modeling approach. J. Biomech. 48, 276–282. doi: 10.1016/j.jbiomech.2014. spino-pelvic organization and adaptation in pathology. Eur. Spine J. 20, S609–
11.033 S618. doi: 10.1007/s00586-011-1928-x
Frontiers in Bioengineering and Biotechnology | www.frontiersin.org 11 June 2021 | Volume 9 | Article 661258Müller et al. Lordosis-Dependent Spinal Load Distribution Rupp, T. K., Ehlers, W., Karajan, N., Günther, M., and Schmitt, S. (2015). A forward Ward, S. R., Tomiya, A., Regev, G. J., Thacker, B. E., Benzl, R. C., dynamics simulation of human lumbar spine flexion predicting the load sharing Kim, C. W., et al. (2009). Passive mechanical properties of the lumbar of intervertebral discs, ligaments, and muscles. Biomech. Model. Mechanobiol. multifidus muscle support its role as a stabilizer. J. Biomech. 42, 1384–1389. 14, 1081–1105. doi: 10.1007/s10237-015-0656-2 doi: 10.1016/j.jbiomech.2008.09.042 Sahin, M. S., Ergün, A., and Aslan, A. (2015). The relationship between White, A. A. III, and Panjabi, M. M. (1990). Clinical Biomechanics of the Spine, Vol. osteoarthritis of the lumbar facet joints and lumbosacropelvic 2. Philadelphia, PA: JB Lippincott Company. morphology. Spine 40, E1058–E1062. doi: 10.1097/BRS.000000000000 Wilke, H. J., Neef, P., Caimi, M., Hoogland, T., and Cleas, L. E. (1999). New in 1070 vivo measurements of pressures in the intervertebral discs in daily life. Spine Scannell, J. P., and McGill, S. M. (2003). Lumbar posture-should it, and can 24, 755–762. doi: 10.1097/00007632-199904150-00005 it, be modified? A study of passive tissue stiffness and lumbar position Wilke, H. J., Wolf, S., Claes, L. E., Arand, M., and Wiesend, A. (1995). Stability during activities of daily living. Phys. Ther. 83, 907–917. doi: 10.1093/ptj/83. increase of the lumbar spine with different muscle groups. A biomechanical in 10.907 vitro study. Spine 20, 192–198. doi: 10.1097/00007632-199501150-00011 Schünke, M., Schulte, E., Schumacher, U., Voll, M., and Wesker, K. (2015). Wood, K. B., Kos, P., Schendel, M., and Persson, K. (1996). Effect of patient Prometheus Lernatlas der Anatomie. Stuttgart: Thieme. position on the sagittal-plane profile of the thoracolumbar spine. J. Spinal Senteler, M., Weisse, B., Snedeker, J. G., and Rothenfluh, D. A. (2014). Pelvic Disord. 9, 165–169. doi: 10.1097/00002517-199604000-00014 incidence–lumbar lordosis mismatch results in increased segmental joint Zar, J. H. (1972). Significance testing of the Spearman rank correlation coefficient. loads in the unfused and fused lumbar spine. Eur. Spine J. 23, 1384–1393. J. Am. Stat. Assoc. 67, 578–580. doi: 10.1080/01621459.1972.10481251 doi: 10.1007/s00586-013-3132-7 Shirazi-Adl, A., Sadouk, S., Parnianpour, M., Pop, D., and El-Rich, M. (2002). Conflict of Interest: The authors declare that the research was conducted in the Muscle force evaluation and the role of posture in human lumbar spine absence of any commercial or financial relationships that could be construed as a under compression. Eur. Spine J. 11, 519–526. doi: 10.1007/s00586-002- potential conflict of interest. 0397-7 Vrtovec, T., Pernus, F., and Likar, B. (2009). A review of methods for Copyright © 2021 Müller, Rockenfeller, Damm, Kosterhon, Kantelhardt, Aiyangar quantitative evaluation of spinal curvature. Eur. Spine J. 18, 593–607. and Gruber. This is an open-access article distributed under the terms of the Creative doi: 10.1007/s00586-009-0913-0 Commons Attribution License (CC BY). The use, distribution or reproduction in Wallwork, T. L., Stanton, W. R., Freke, M., and Hides, J. A. (2009). The other forums is permitted, provided the original author(s) and the copyright owner(s) effect of chronic low back pain on size and contraction of the lumbar are credited and that the original publication in this journal is cited, in accordance multifidus muscle. Manual Ther. 14, 496–500. doi: 10.1016/j.math.2008. with accepted academic practice. No use, distribution or reproduction is permitted 09.006 which does not comply with these terms. Frontiers in Bioengineering and Biotechnology | www.frontiersin.org 12 June 2021 | Volume 9 | Article 661258
You can also read