Identification of the Optimal Light Harvesting Antenna Size for High-Light Stress Mitigation in Plants - Frontiers
←
→
Page content transcription
If your browser does not render page correctly, please read the page content below
ORIGINAL RESEARCH
                                                                                                                                             published: 15 May 2020
                                                                                                                                       doi: 10.3389/fpls.2020.00505

                                             Identification of the Optimal Light
                                             Harvesting Antenna Size for
                                             High-Light Stress Mitigation in Plants
                                             Guangxi Wu 1,2,3 , Lin Ma 1,2,3 , Richard T. Sayre 2,3* and Choon-Hwan Lee 1,2,3*
                                             1
                                              Department of Molecular Biology, Pusan National University, Busan, South Korea, 2 Pebble Labs, Los Alamos, NM,
                                             United States, 3 New Mexico Consortium, Los Alamos, NM, United States

                                             One of the major constraints limiting biomass production in autotrophs is the
                                             low thermodynamic efficiency of photosynthesis, ranging from 1 to 4%. Given the
                                             absorption spectrum of photosynthetic pigments and the spectral distribution of
                                             sunlight, photosynthetic efficiencies as high as 11% are possible. It is well-recognized
                                             that the greatest thermodynamic inefficiencies in photosynthesis are associated with
                                             light absorption and conversion of excited states into chemical energy. This is due to
                                             the fact that photosynthesis light saturates at one quarter full sunlight intensity in plants
                                             resulting in the dissipation of excess energy as heat, fluorescence and through the
                                             production of damaging reactive oxygen species. Recently, it has been demonstrated
                                             that it is possible to adjust the size of the light harvesting antenna over a broad range of
                                             optical cross sections through targeted reductions in chlorophyll b content, selectively
                                             resulting in reductions of the peripheral light harvesting antenna size, especially in the
                            Edited by:
                      Mikko Tikkanen,        content of Lhcb3 and Lhcb6. We have examined the impact of alterations in light
           University of Turku, Finland      harvesting antenna size on the amplitude of photoprotective activity and the evolutionary
                       Reviewed by:          fitness or seed production in Camelina grown at super-saturating and sub-saturating
                      Michael Hippler,
       University of Münster, Germany
                                             light intensities to gain an understanding of the driving forces that lead to the selection for
                          Erica Belgio,      light harvesting antenna sizes best fit for a range of light intensities. We demonstrate that
           Centrum Algatech, Czechia
                                             plants having light harvesting antenna sizes engineered for the greatest photosynthetic
              *Correspondence:
                                             efficiency also have the greatest capacity to mitigate high light stress through non-
                  Richard T. Sayre
   rsayre@newmexicoconsortium.org            photochemical quenching and reduction of reactive oxygen associated damage. Under
                 Choon-Hwan Lee              sub-saturating growth light intensities, we demonstrate that the optimal light harvesting
               chlee@pusan.ac.kr
                                             antenna size for photosynthesis and seed production is larger than that for plants grown
                   Specialty section:        at super-saturating light intensities and is more similar to the antenna size of wild-type
         This article was submitted to       plants. These results suggest that the light harvesting antenna size of plants is designed
                      Plant Physiology,
               a section of the journal      to maximize fitness under low light conditions such as occurs in shaded environments
            Frontiers in Plant Science       and in light competition with other plants.
      Received: 20 September 2019
                                             Keywords: antenna size, biomass yield, chlorophyll b, photosynthesis, reactive oxygen species, stress
           Accepted: 03 April 2020
           Published: 15 May 2020
                             Citation:
           Wu G, Ma L, Sayre RT and
                                            INTRODUCTION
  Lee C-H (2020) Identification of the
    Optimal Light Harvesting Antenna
                                            In nature, photosynthetic organisms grow under constantly varying light intensities ranging from
  Size for High-Light Stress Mitigation     full sunlight intensities to sub-saturating light intensities. In addition, leaves at the top of the
   in Plants. Front. Plant Sci. 11:505.     canopy experience higher light intensities than those at the bottom of the canopy. This raises the
        doi: 10.3389/fpls.2020.00505        question why do virtually all plants have light harvesting antenna sizes that capture photons at rates

Frontiers in Plant Science | www.frontiersin.org                                  1                                               May 2020 | Volume 11 | Article 505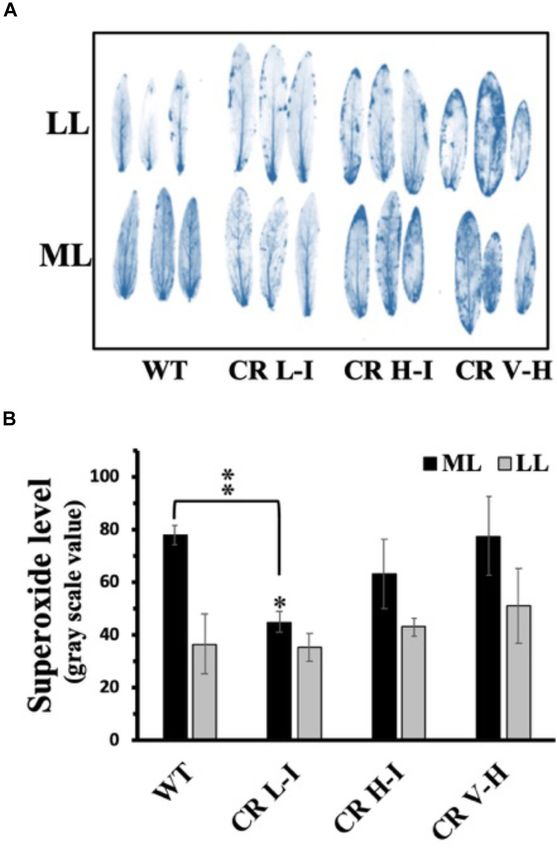
Wu et al.                                                                                                     Optimal Light Harvesting Antenna Size

nearly 10-fold greater than they can be converted into chemical           performance and light stress responses of Camelina plants
energy at full sunlight conditions. Having large light harvesting         having altered levels of Chl b accumulation and associated light
antenna sizes incurs damage to the photosynthetic apparatus               harvesting antenna sizes. These plants had Chl a/b ratios ranging
at light intensities greater than those that saturate electron            from 3 to 14 and corresponding alterations in light harvesting
transfer processes. Plants mitigate high light (HL) stress through        antenna size (Friedland et al., 2019).
non-productive energy dissipation pathways including heat and                We demonstrate that for plants having an optimal antenna size
fluorescence and the production of damaging reactive oxygen               for photosynthetic efficiency, the photo-protective mechanisms
species (Perrine et al., 2012; Friedland et al., 2019). This raises       are fully operational resulting in the best overall photosynthetic
the question why have plants evolved large fixed size light               performance. In contrast, plants having reduced light harvesting
harvesting antenna sizes that light saturate at one quarter full          antenna sizes (Chl a/b ratios > 6.5) are more susceptible to HL
sunlight intensity.                                                       damage. Thus, there is a tipping point in light harvesting antenna
    In low light environments and in stratified plant canopies            size at which reductions in light harvesting antenna size leads to
having a large wasteful light harvesting antenna may provide a            both reductions in photosynthetic efficiency and reductions in
selective advantage by excluding light from competing species.            photoprotective mechanisms against HL leading to reductions in
In monoculture or agricultural environments, however, having              both electron transport and high light stress protection efficiency
large wasteful light harvesting complexes (LHCs) may not be               (Friedland et al., 2019). In contrast, the optimal light harvesting
advantageous for biomass production (Ort et al., 2011). For               antenna size for photosynthesis and seed production for plants
example, it has been shown in green algal and plant monocultures          grown at low light intensities is much larger and more similar in
that organisms which have slightly reduced light harvesting               size to the light harvesting antenna of WT plants. These results
apparatus grow more efficiently than wild-type (WT) strains               suggest that for Camelina light harvesting antenna sizes in wild-
having larger, more wasteful light harvesting antenna (Perrine            type plants have been selected for best performance under low
et al., 2012; Friedland et al., 2019). Chlamydomonas lines having         light intensities as occurs during competition for light.
smaller optimized light harvesting antenna sizes were shown
to have growth rates 40% greater than WT algae when grown
in simulated pond environments (Perrine et al., 2012). Similar            MATERIALS AND METHODS
effects of antenna size reduction on enhanced crop biomass
production have been observed in Camelina engineered to have              Plants and Growth Condition
optimal light harvesting antenna sizes (Friedland et al., 2019).          Wild-type Camelina sativa plants and T4 generation back-
    Chlorophyll (Chl) b accounts for approximately half of                crossed transgenic plants expressing RNAi molecules targeting
the chlorophyll in the peripheral LHC and is not present in               the silencing of the chlorophyllide a oxygenase (CAO) gene
photosynthetic reaction centers. The LHC apoproteins which                previously described by Friedland et al. (2019) were grown
bind Chl b and other pigments are made in the cytoplasm,                  in the greenhouse at 24◦ C/26◦ C with a 14 h/10 h day/night
imported into chloroplasts, and folded in the presence of the             photoperiod. The average moderate light intensity (ML) at mid-
photosynthetic pigments. As a result, a reduction or absence of           morning in the green house was 850 µmol photons m−2 s−1
Chl b can reduce the stability of the LHC proteins resulting              (400–700 nm, photosynthetic active radiation, PAR), while for
in their degradation and graded reductions in the apparent                shaded low light (LL) plants the growth light intensity was sub-
optical cross section of the light harvesting antenna (Hoober             saturating (200 µmol photons m−2 s−1 , PAR). Fully expanded
et al., 2007; Friedland et al., 2019). As previously demonstrated,        leaves from the top of WT and CAO RNAi (CR) plants were
small reductions in Chl b synthesis (Chl a/b ratio = 5) leads             assessed using 3- to 5-weeks old plants for all experiments. The
to a reduction in the number of trimeric LHCII complexes.                 Chl concentration was determined in aqueous 80% acetone as
Reductions in Chl b levels leading to Chl a/b ratios > 6.5,               described by Porra et al. (1989). The transgenic plants were
however, result in additional losses in photochemical efficiency          assigned to three different groups according to their Chl a/b ratios
and the ability to dissipate excess excited states at saturating          or apparent light harvesting antenna sizes at 3–5 weeks of age
light intensities (Perrine et al., 2012; Friedland et al., 2019).         including: a low-intermediate Chl a/b ratio group (CR L-I) having
Thus, there is an optimal light harvesting antenna size for plants        Chl a/b ratios ranging from 4.5 to 6.5, a high-intermediate Chl
corresponding to a Chl a/b ratio of 5.                                    a/b ratio group (CR H-I) group having Chl a/b ratios ranging
    The fact that smaller light harvesting antenna are more               from 6.5 to 8.5, and a very-high Chl a/b ratio group (CR V-H)
susceptible to photodamage than larger antenna is counter-                having Chl a/b ratios greater than 8.5 having the smallest light
intuitive since reductions in light harvesting antenna size would         harvesting antenna size. Significantly, the Chl a/b ratios of top
inherently be expected to reduce HL stress damage as a                    fully expanded leaves from a given plant line did not significantly
result of the decrease in light capture efficiency. Thus, it is           change during growth from 3 to 5 weeks, indicating antenna sizes
hypothesized that there is likely a trade-off between reductions          were stable in a given transgenic line (Supplementary Figure S1).
in photosynthetic efficiency and reductions in HL stress induced
damage associated with alterations in light harvesting antenna            Light Stress Treatment
size. To determine the optimal light harvesting antenna size for          Leaves were detached from dark-adapted (overnight) plants and
biomass production and fitness (seed production) under low                floated on water to avoid water stress for all subsequent
and high light conditions, we characterized the photosynthetic            treatments. Leaves were then exposed to different light

Frontiers in Plant Science | www.frontiersin.org                      2                                          May 2020 | Volume 11 | Article 505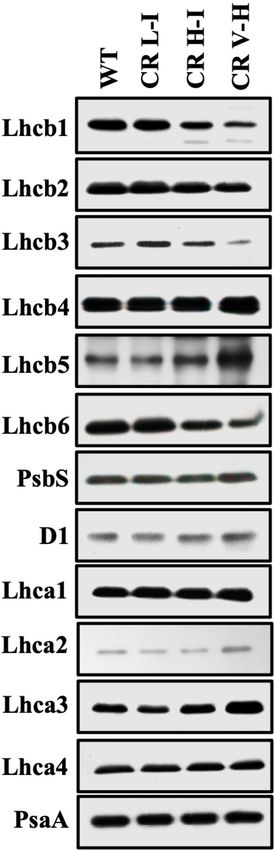
Wu et al.                                                                                                 Optimal Light Harvesting Antenna Size

intensities ranging from 200, 600, 1,000, 1,400 and 1,800              or illuminated at the corresponding growth light intensity
µmol photons m−2 s−1 PAR using a white light-emitting                  for 4 h. Leaf material (100 mg) was then homogenized in
diode (LED) lamp for 3 h at 26◦ C. For HL treatments,                  1 mL 0.1% (w/v) trichloroacetic acid in a blender at 4◦ C. The
plants were dark-adapted overnight and treated at 1,000                homogenate was centrifuged at 10,000 g for 10 min. After
µmol photons m−2 s−1 PAR using the LED lamp for 24 h                   adding 1 mL of 20% trichloroacetic acid containing 0.6% (w/v)
at 26◦ C.                                                              thiobarbituric acid to the supernatant, the mixture was incubated
                                                                       at 95◦ C for 25 min and then centrifuged at 10,000 g for
Chlorophyll Fluorescence Measurements                                  10 min. The absorbance was measured from the supernatant
In vivo chlorophyll fluorescence kinetics were measured using          at 440, 532, and 600 nm. MDA contents were calculated as
detached leaves using a Handy FluorCam FC 1000-H (Photon               described by Hodges et al. (1999).
Systems Instruments, Drásov, Czechia) after dark-adaptation
for 30 min at room temperature. The photosystem II (PSII)              Sodium Dodecyl Sulfate-Polyacrylamide
photochemical efficiency (Fv/Fm) was calculated according to the       Gel Electrophoreses and Immunoblotting
equation of Fv/Fm = (Fm – Fo)/Fm, where Fo is the minimum              Sodium      dodecyl    sulfate  (SDS)-polyacrylamide   gel
fluorescence determined using low-intensity measuring light            electrophoreses (PAGE) and immunoblotting were performed
pulses at 620 nm, and Fm is the maximum fluorescence                   as described by Towbin et al. (1979). Thylakoid membrane
determined after a 0.8 s saturating pulse of white light at            containing 2 µg Chl was solubilized with SDS sample buffer
4,000 µmol photons m−2 s−1 . Non-photochemical quenching               containing 40 mM Tris-HCl (pH 6.8), 10% (v/v) glycerol,
(NPQ) was calculated according to the equation of NPQ = (Fm –          0.1% (w/v) bromophenol blue, 0.1M dithiothreitol and 2%
Fm0 )/Fm0 , where Fm’ is the maximum fluorescence measured             (w/v) SDS for 30 min at room temperature. Polypeptides
using a light-adapted leaf. For the measurement of NPQ                 were separated by SDS-PAGE using 12% (w/v) acrylamide gel
development kinetics, leaves were exposed to actinic light (100        with 3M urea and electro-transferred into polyvinylidene
µmol photons m−2 s−1 ) for 60 s and were then kept in                  fluoride membrane (Immobilon-P, Merck, Darmstadt,
darkness for 60 s before measurement of NPQ decay kinetics.            Germany). Photosystem I (PSI), PSII and LHC proteins
To determine the impact of high light stress on NPQ kinetics           were detected using antibodies raised against the PsbA
and its long-term recovery, plants were exposed to high light          or D1 protein, PsbS, PsaA, Lhcb1-Lhcb6, and Lhca1-
(1,000 µmol photons m−2 s−1 ) for 3, 6, 9 and 24 h. After              Lhca4 (Agrisera AB, Vännäs, Sweden). After incubating
dark-adaptation for 30 min NPQ kinetics were determined as             with anti-rabbit IgG HRP conjugated secondary antibody
described above.                                                       (Agrisera, Vännäs, Sweden) for 2 h at room temperature,
                                                                       antibody-specific signals were imaged using a Clarity
Reactive Oxygen Species (ROS)                                          Western ECL substrate (Bio-Rad Laboratories, Berkeley,
Measurements                                                           CA, United States).
A qualitative or histochemical assay for superoxide oxygen
detection was performed using detached leaf segments as                Pigments Analysis
previously described by Fryer et al. (2002) and Zulfugarov             Xanthophyll cycle pigment were determined according to
et al. (2011). Briefly, leaf samples from overnight dark-              Gilmore and Yamamoto (1991) with slight modifications.
adapted plants were immersed in 6 mM nitroblue tetrazolium             Pigments were extracted with 100% cold acetone from
(NBT) solution containing 50 mM HEPES buffer (pH 7.5) for              overnight dark-adapted leaves after treatment with HL (1,000
2 h in the dark. After the treatment at the corresponding              µmol photons m−2 s−1 ) for 0, 1, and 2 h. The pigment
growth light conditions (ML and LL) for 4 h, pigments                  extracts were filtered through a 0.2-µm membrane filter.
were extracted from leaf segments using absolute ethanol               Pigment separation was performed in a high performance
at 65◦ C by shaking in a water bath. Quantitative levels               liquid chromatography system (HP 1100 series, Hewlett-
of NBT reactive superoxide radicals produced were then                 Packard, Waldbronn, Germany) on a Spherisorb ODS-1
analyzed from the image in the gray scale value using                  column (Waters, Milford, MA, United States) using a
Image J1 .                                                             solvent mixture of acetonitrile:methanol:0.1M Tris-HCl
                                                                       pH 8.0 (72:12:7, v/v/v) for 6 min followed by a 10 min
Measurement of Light Stress Induced                                    linear gradient to methanol:hexane (4:1, v/v). The eluted
Lipid Peroxidation                                                     pigments were monitored at 445 nm. Concentrations of
Malondialdehyde (MDA) is a product of lipid peroxidation and           the pigments were estimated by using the conversion
an indirect indicator of ROS-mediated membrane lipid damage.           factors for peak area normalized to 100% Chl a molecule
MDA production was determined using the thiobarbituric acid            (Chen et al., 2012).
reaction according to Peever and Higgins (1989) with slight
modifications. Leaves were detached from overnight dark-               Statistical Analysis
adapted plants, floated on water, and dark-adapted as controls         All experiments were repeated at least three times (n ≥ 3). Values
                                                                       are expressed as mean ± SD. The significance of differences
1
    rsb.info.nih.gov/ij                                                between experimental groups was analyzed using the unequal

Frontiers in Plant Science | www.frontiersin.org                   3                                         May 2020 | Volume 11 | Article 505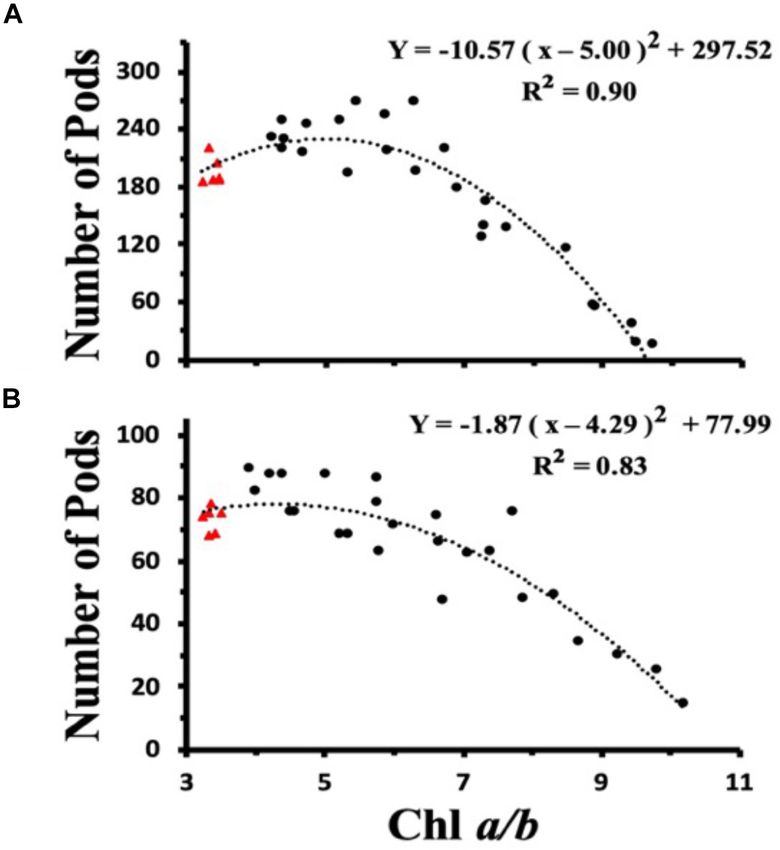
Wu et al.                                                                                                                        Optimal Light Harvesting Antenna Size

variance two-tailed Student’s t-tests. Statistically significant are                  Fv/Fm ratio (Figure 1A). In contrast to plants with substantially
considered as ∗ P < 0.05 or ∗∗ P < 0.01.                                              reduced light harvesting antenna sizes (Chl a/b > 6.5), plants
                                                                                      with optimal light harvesting antenna sizes (CR L-I) had lower
                                                                                      reductions in photochemical efficiency following light stress
                                                                                      treatment. In fact, the lowest reductions in photochemical
RESULTS                                                                               efficiency following HL stress treatment were observed in CR L-1
                                                                                      plants and not in wild-type plants with larger light harvesting
Sensitivity of NPQ and PSII to HL Stress                                              antenna complexes.
Damage as a Function of Light                                                             To gain greater insights into the biophysical basis for these
Harvesting Antenna Size                                                               differences in light stress sensitivity associated with different light
To determine the sensitivity of plants having different light                         harvesting antenna sizes, we compared the relative levels of dark-
harvesting antenna sizes to HL stress, we analyzed the impact                         adapted non-photochemical quenching (NPQ) activity of plants
of HL stress (1,000 µmol photons m−2 s−1 for 24 h) on PSII                            having a range of light harvesting antenna sizes (Figure 1B).
photochemical efficiency as determined by the Chl fluorescence                        NPQ is one of the mechanisms by which excess Chl excited

  FIGURE 1 | Comparison of Fv/Fm and NPQ development and relaxation kinetics in wild-type and CAO RNAi transgenic lines under high light stress. Wild-type (WT),
  CR L-I (Chl a/b = 4.5–6.5), CR H-I (Chl a/b = 6.5–8.5), and CR V-H (Chl a/b 8.5 or above) plant leaves were dark-adapted for 30 min before the measurement of
  Fv/Fm (A) and NPQ (B–F). Leaves were exposed to high light (HL) stress at 1,000 µmol photons m−2 s−1 for 24 h. For the measurement of NPQ development and
  relaxation kinetics, leaves were exposed to actinic light (100 mmol photons m−2 s−1 ) for 60 s and were then kept in darkness for 60 s. The effects of HL stress on
  the NPQ development and relaxation kinetics were tested for 24 h in WT (C), CR L-I (D), CR H-I (E), and CR V-H (F) lines. All experiments were done using fully
  expanded leaves from the top of 4–5 weeks old plants. Results represent the average and SD of three independent measurements.

Frontiers in Plant Science | www.frontiersin.org                                  4                                                 May 2020 | Volume 11 | Article 505
Wu et al. Optimal Light Harvesting Antenna Size
states are dissipated non-destructively (Zulfugarov et al., 2014).
In overnight dark-adapted leaves, NPQ rise kinetics in all of
the CAO RNAi lines were similar to that of WT, except for
the CR V-H lines having the smallest light harvesting antenna
size (Figure 1B). In addition, the maximum level of NPQ was
reduced by 20% in the CR V-H lines and NPQ decay kinetics
were slower than WT, CR L-I and CR H-I lines. Following high
light exposure ranging from 3 to 9 h, NPQ development was
repressed in all plants (Figures 1C–F). Recovery of NPQ after
high light stress for 24 h also varied as a function of antenna
size. In WT plants, the NPQ level reached after actinic light
exposure for 60 s was 44% of the control level (Figure 1C).
In CR L-I lines the NPQ level reached was 58% of the control
level (Figure 1D), whereas the maximum NPQ level reached in
CR H-I lines was only 45% of the control level (Figure 1E).
The NPQ level reached in CR L-I lines was significantly higher
than the levels reached both in WT and in CR H-I lines at
P < 0.5. We observed that plants having the smallest antenna
sizes (CR V-H lines) had no NPQ recovery after HL treatment
for 24 h (Figure 1F). Thus, there was a tipping point in antenna
size relative to NPQ recovery after HL stress with maximum
recovery occurring in plants with Chl a/b ratios near 5, the
Chl a/b ratio that is also optimal for photosynthetic efficiency
(Friedland et al., 2019). FIGURE 2 | Comparison of growth light intensity-dependent changes in
Fv/Fm in wild-type and CAO RNAi transgenic lines. Wild-type (WT), CR L-I
Due to the light-induced production of a strong oxidant, (Chl a/b = 4.5–6.5), CR H-I (Chl a/b = 6.5–8.5), and CR V-H (Chl a/b 8.5 or
P680+ , photosystem II is the most susceptible electron transport above) plants grown either in moderate light (ML) (850 µmol photons
complex to damage under HL stress (Huang et al., 2018). To m−2 s−1 ) (A) or in low light (LL) (200 µmol photons m−2 s−1 ) (B) were
determine the impact of varying light intensities on PSII stability, exposed to light of various intensities for 3 h. All experiments were done using
fully expanded leaves from the top of 4–5 weeks old plants. Before the
we exposed plants to various light intensities for 3 h and then
measurement of Fv/Fm, leaves were dark-adapted for 30 min. Results
determined their PSII efficiency after a dark adaptation period. represent the average and SD of three independent measurements. ∗, values
As shown in Figure 2, both ML and LL grown plants having are significantly different at P < 0.05 and ∗∗, values are significantly different at
Chl a/b ratios of approximately 5 (CR L-I) had statistically P < 0.01 between experimental groups.
significantly lower losses in PSII efficiency than WT or transgenic
plants having Chl a/b ratios > 6.5, when exposed to light
intensities ≥ 1,000 µmol photons m−2 s−1 . Furthermore, plants surprising since it is the least abundant subunit in the LHCII
having the smallest antenna size had the greatest PSII sensitivity complex. Given that Lhcb3 apparently evolved as plants adapted
to light stress. to land environments and is not found in algae, a role for this
protein in NPQ mechanisms has been implied (Alboresi et al.,
2008). Furthermore, the Lhcb3 protein is part of the M-trimer of
Changes in Various Factors Affecting LHCII family members (Crepin and Caffarri, 2018). Reductions
NPQ in Lhcb3 content have been shown to be correlated with the loss
The LHCII is expected to be one of the major quenching site for of moderately bound LHCII M-trimers and alterations in the
NPQ (Horton et al., 1991). In our previous paper (Friedland et al., orientation of the M-trimers. Thus, Lhcb3 plays a critical role in
2019), we observed that the reduction of LHCII trimer abundance regulating energy transfer from the LHC to the reaction center
was directly associated with reduced Chl b contents in CAO RNAi core in higher plants. While the greatest losses in LHCII protein
lines. To determine the impact of Chl b reduction on the specific subunit family member abundance were observed for Lhcb3 in
levels of other LHC protein subunits we assessed the relative low Chl b CAO RNAi lines, we also observed reductions in the
abundance of individual LHC proteins by immunoblotting abundance of Lhcb1 associated with reductions in Chl b content.
(Figure 3). We observed a gradual reduction in major LHCII Lhcb1 is predominantly found in the loosely bound LHCII
polypeptides (Lhcb1, Lhcb2, and Lhcb3) and especially Lhcb3 L-trimers as well as in LHCII M-trimers. The reduction in Lhcb1
with reductions in Chl b levels. In contrast there was little impact levels are consistent with previous descriptions demonstrating
on Lhcb4 and Lhcb5 and LHCI polypeptide (Lhca1, Lhca2, Lhca3, the loss of loosely bound LHCII trimers associated with the loss
and Lhca4) levels as Chl b levels were reduced. The content of Chl b (Friedland et al., 2019) as well as losses in Lhcb6 content
of Lhcb6, a minor LHCII was also reduced in CR H-I and CR involved in binding the LHCII M-trimer with PCII core. Overall,
V-H lines, with no noticeable changes in the PSII and PSI core these results indicate that loosely bound LHCII L-trimers are
polypeptides, D1 and PsaA, respectively. Overall, it is apparent most impacted by reductions in Chl b content followed by the
that Lhcb3 is most sensitive to reductions in Chl b. This is not LHCII M-trimers.
Frontiers in Plant Science | www.frontiersin.org 5 May 2020 | Volume 11 | Article 505Wu et al. Optimal Light Harvesting Antenna Size
To determine the impact of Chl b reduction on NPQ levels,
we measured PsbS and xanthophyll cycle carotenoid levels in the
various CAO RNAi lines. The PsbS protein has been implicated in
the regulation of NPQ (Li et al., 2002) and the xanthophyll cycle
carotenoids participate in energy quenching (Niyogi et al., 1998).
Significantly, there were no noticeable differences in the level of
PsbS protein among the different CAO RNAi lines (Figure 3).
This is surprising given the differential responses in NPQ levels
among the different CAO RNAi lines to reductions in Chl b levels,
thus implying that the observed perturbations in NPQ responses
are not associated with changes in PsbS levels. Just as surprising,
we observed that both zeaxanthin content per Chl a and the
carotenoid de-epoxidation state increased in CAO RNAi lines
with lower Chl b content (Table 1), indicating that steady state
levels of zeaxanthin and the de-epoxidation state were also not
correlated with NPQ (Figure 1). Overall, we observed about a
10 to 20% drop in the total xanthophyll cycle pigment content
(violaxanthin + antheraxanthin + zeaxanthin) in all the CAO
RNAi lines compared to WT plants. As antenna size became
smaller neoxanthin and lutein content per Chl a also decreased,
while the relative content of β-carotene per Chl a increased.
Relative Accumulation of Reactive
Oxygen Species During Growth at Low
and High Light Intensities as a Function
of Antenna Size
To assess the relative production of ROS during growth as a
function of antenna size and light stress, we exposed plants grown
at ML and LL to the corresponding light for 4 h followed by
analysis of ROS accumulation (Asada, 1999; Bondarava et al.,
2010; Zulfugarov et al., 2014). Fully expanded leaves were
detached from overnight dark-adapted plants and chemical-
infiltrated with ROS detection agents by floating on a 6 mM NBT
solution in darkness for 2 h. We observed that NBT-detectable
superoxide levels were lowest in the CR L-I line and greatest in
WT and transgenic lines (CR H-I and CR V-H) having Chl a/b
ratios > 6.5 following exposure of leaves from ML grown plants
when to ML at 850 µmol photons m−2 s−1 for 4 h (Figure 4). In
the rates of oxygen evolution with ferricyanide as a whole chain
electron acceptor, we did not observe any significant differences
among WT and all three transgenic lines (Supplementary Figure
S2). In the case of the leaves from LL grown plants, exposed to
LL at 200 µmol photons m−2 s−1 , superoxide production in CR
L-I lines was similar to that of WT but increased in CR H-I and
CR V-H lines. As expected, plants grown under LL conditions
had lower levels of ROS production than those grown under ML
conditions suggesting ML grown plants are more predisposed to
ROS production than LL grown plants. Thus, CAO RNAi lines
having smaller antenna sizes were more prone to photodamage
FIGURE 3 | Comparison of thylakoid protein contents in wild-type and CAO by ROS at both low and high light intensities.
RNAi transgenic lines. Thylakoid membranes were isolated from overnight
dark-adapted wild-type (WT), CR L-I (Chl a/b = 4.5–6.5), CR H-I (Chl
a/b = 6.5–8.5), and CR V-H (Chl a/b 8.5 or above) transgenic plant leaves. Lipid Peroxidation
Thylakoid membrane contents 2 µg Chl were separated by the sodium One of the potential outcomes of high light stress induced
dodecyl sulfate-polyacrylamide gel electrophoresis (SDS-PAGE) and ROS production is lipid peroxidation leading to the production
immunoblotted using specific antibodies raised against Lhcb1, Lhcb2, Lhcb3,
Lhcb4, Lhcb5, Lhcb6, Lhca1, Lhca2, Lhca3, Lhca4, D1, PsbS, and PsaA.
of malondialdehyde (MDA) and damaged membranes. We
measured lipid peroxidation levels in plants with different light
Frontiers in Plant Science | www.frontiersin.org 6 May 2020 | Volume 11 | Article 505Wu et al. Optimal Light Harvesting Antenna Size
TABLE 1 | Comparison of pigment compositions in wild-type and CAO RNAi transgenic lines under darkness and high light stress.
Neo Vio Ant Lut Zea Chl b β-Car Vio + Ant + Zea AZ/VAZ
WT dark 2.92 ± 0.78 10.95 ± 0.28 ND 20.12 ± 0.69 ND 27.67 ± 0.27 12.98 ± 0.30 10.95 ± 0.28 0
WT HL 1 h 2.79 ± 0.35 4.02 ± 0.01 2.19 ± 0.03 19.34 ± 0.33 4.07 ± 0.08 27.62 ± 0.16 12.43 ± 0.37 10.29 ± 0.05 0.50 ± 0.004
WT HL 2 h 3.34 ± 0.45 3.60 ± 0.01 2.43 ± 0.03 19.94 ± 0.56 5.40 ± 0.12 27.52 ± 0.36 13.06 ± 0.34 11.44 ± 0.10 0.58 ± 0.005
CR L-I dark 2.23 ± 0.25 9.32 ± 0.16 ND 18.04 ± 0.75 ND 16.83 ± 0.14 13.96 ± 0.22 9.32 ± 0.16 0
CR L-I HL 1 h 1.76 ± 0.23 2.62 ± 0.22 1.56 ± 0.07 17.23 ± 0.96 4.39 ± 0.27 16.45 ± 0.15 13.90 ± 0.33 8.57 ± 0.12 0.60 ± 0.028
CR L-I HL 2 h 2.00 ± 0.18 2.56 ± 0.30 1.45 ± 0.09 18.18 ± 0.71 5.15 ± 0.24 16.76 ± 0.31 14.55 ± 0.40 9.16 ± 0.17 0.64 ± 0.031
CR H-I dark 1.75 ± 0.09 8.57 ± 0.15 ND 16.69 ± 0.48 ND 13.34 ± 0.09 14.95 ± 0.25 8.57 ± 0.15 0
CR H-I HL 1 h 1.37 ± 0.26 2.23 ± 0.18 1.38 ± 0.07 15.90 ± 0.72 4.92 ± 0.18 13.29 ± 0.15 14.71 ± 0.41 8.53 ± 0.31 0.66 ± 0.010
CR H-I HL 2 h 1.35 ± 0.08 1.99 ± 0.10 1.35 ± 0.05 16.93 ± 0.67 5.98 ± 0.34 13.57 ± 0.19 15.33 ± 0.34 9.32 ± 0.25 0.71 ± 0.017
CR V-H dark 0.85 ± 0.11 9.91 ± 0.17 ND 14.07 ± 0.38 ND 6.91 ± 0.07 15.70 ± 0.68 9.91 ± 0.17 0
CR V-H HL 1 h 0.96 ± 0.12 2.08 ± 0.03 1.07 ± 0.17 15.82 ± 0.60 6.76 ± 0.35 7.29 ± 0.11 15.55 ± 0.87 9.91 ± 0.51 0.74 ± 0.007
CR V-H HL 2 h 0.94 ± 0.10 1.87 ± 0.14 0.72 ± 0.20 15.70 ± 0.35 7.12 ± 0.26 7.50 ± 0.09 15.82 ± 0.37 9.72 ± 0.19 0.77 ± 0.015
Wild-type (WT), CR L-I (Chl a/b = 4.5–6.5), CR H-I (Chl a/b = 6.5–8.5) and CR V-H (Chl a/b 8.5 or above) plants were used, and overnight dark-adapted (dark) leaves from 4-
week old Camelina plants were treated with high light (HL 1,000 µmol photons m−2 s−1 ) for 1 or 2 h. Pigments were subjected to high performance liquid chromatography
analysis after extraction with 100% cooled acetone. Pigment content was normalized to 100 chlorophyll (Chl) a molecules. Ant, antheraxanthin; β-car, β-carotene; Lut,
lutein; ND, not detectable; Neo, neoxanthin; Vio, violaxanthin; Zea, zeaxanthin. AZ/VAZ, de-epoxidation state was calculated from (0.5 Ant + Zea)/(Vio + Ant + Zea).
harvesting antenna sizes as a function of light treatment by only observable statistically significant difference in yield was for
quantifying MDA content (Masia, 2003). As show in Figure 5, number of pods and total pod yield/plant for the CR L-I plants
MDA levels in LL grown plants did not vary between WT, CR versus WT when grown under ML growth conditions (Figure 6).
L-I and CR H-I lines when they were either dark-adapted or Under ML conditions, both the number of seed pods and the total
exposed to low light intensities for 4 h. In contrast, plants grown weight of pods were about 24% greater for the CR L-I line relative
in medium light intensities and then exposed to the dark had to WT. All plant lines grown at ML had greater pod numbers
twofold greater MDA levels then LL grown plants, suggesting and yield than plants grown at LL but had identical plant height
that growth at higher light predisposes the plants to increased at both light intensities (Figure 6). Compared to WT, seed pod
sustained MDA production. When dark-adapted, medium light number, pod mass and plant height were all slightly reduced in
grown plants were subsequently exposed to medium growth CR H-I lines and further reduced in CR V-H lines when grown in
light for 4 h, MDA levels increased most substantially in WT LL conditions. These results demonstrate the impact of sink (pod)
plants (>60%) but to a lesser extent in the CR L-I and CR H-I strength on determining the distribution of biomass allocation.
lines (>20%). Increased MDA production in CR H-I plants was Furthermore, it is apparent that WT light harvesting antenna
consistent with the elevated ROS production relative to the CR sizes are most fit at low light intensities, and CAO RNAi plants
L-I transgenics as observed in Figure 4. These results indicate having smaller light harvesting antenna sizes had reduced fitness
that WT plants exposed to greater than light saturating growth compared to WT and the CR L-1 line.
conditions generated substantially more ROS and MDA than the
CR transgenics with smaller light harvesting antenna sizes. As
expected, CAO RNAi plants having a range of light harvesting Relationship Between Chl a/b Ratios and
antenna sizes had lower MDA and ROS production levels when Seed Yield
grown under sub-saturating light conditions (LL). To investigate the dependency of plant light harvesting antenna
size on seed yield as a function of growth light intensities, we
measured the number of seed pods/plant for WT and CAO RNAi
Growth Light Intensity-Dependent plants across a range of Chl a/b ratios (measured at top fully
Changes in the Seed Yield expanded leaf) for ML and LL grown plants (Figures 7A,B).
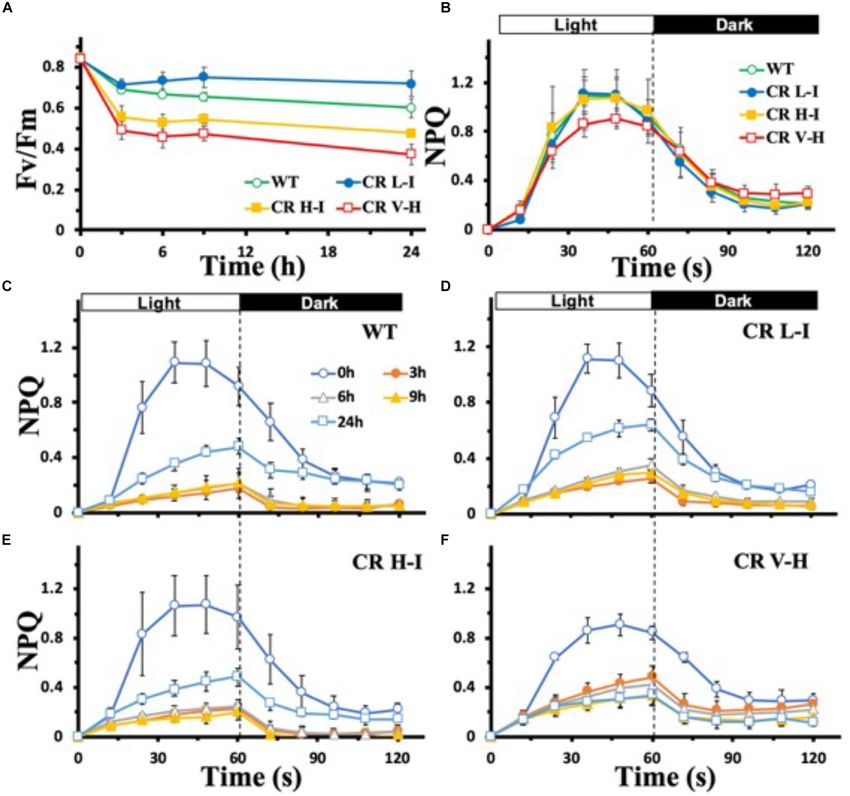
Previously, we have demonstrated that Camelina plants having When the ML grown data were fit with a second order polynomial
an upper canopy leaf Chl a/b ratio of 5 had the highest function, the peak seed pod yield was correlated with plants
photosynthetic and biomass production yields (Friedland et al., having a Chl a/b ratio of 5.0 (Figure 7A). However, when plants
2019). To determine whether there was a relationship between were grown under LL conditions, the peak seed pod yield was
light harvesting antenna size, growth light intensity and correlated with plants having a Chl a/b ratio of 4.3, more similar
maximum seed yield, we compared the number of seed pods, to WT plants (Figure 7B). In addition to the shift in optimal
total pod weight/plant and plant height between WT, CR L-I, Chl a/b ratio or antenna size for plants grown under LL vs. ML
CR H-I, and CR V-H plants grown either under ML or LL conditions, there was a broadening in the distribution of seed
conditions (Figure 6). Previously, we had demonstrated that total yield vs. Chl a/b ratio for LL grown plants. Thus, more wild-
harvestable seed yield in Camelina plants was largely determined type like Chl a/b ratios were associated with enhanced seed yield
by the number of seed pods and not seed mass or numbers of under low and medium light conditions while plants having Chl
seeds per pod (Friedland et al., 2019). In the current study, the a/b ratios less than 5 had reduced seed yield or fitness.
Frontiers in Plant Science | www.frontiersin.org 7 May 2020 | Volume 11 | Article 505Wu et al. Optimal Light Harvesting Antenna Size
FIGURE 5 | Comparison of malondialdehyde (MDA) content in wild-type and
CAO RNAi transgenic lines. Moderate light (ML) (850 µmol photons m−2 s−1 )
and low light (LL) (200 µmol photons m−2 s−1 ) grown wild-type (WT), CR L-I
(Chl a/b = 4.5–6.5), CR H-I (Chl a/b = 6.5–8.5), and CR V-H (Chl a/b 8.5 or
above) transgenic plant leaves were exposed to growth light for 4 h. The MDA
content was measured before the light illumination (Dark-ML or Dark-LL) and
after the light illumination (Light-ML or Light-LL). All experiments were done
using fully expanded leaves from the top of 4–5 weeks old plants. Results
represent the average and SD of three independent measurements.∗∗, values
are significantly different at P < 0.05 between experimental groups.
sensitivity to photoinhibition, and optimal biomass and seed yield
(Perrine et al., 2012; Friedland et al., 2019). Interestingly, the
transition point or the optimal Chl a/b ratio for photosynthetic
performance for both green algae (Perrine et al., 2012) and
FIGURE 4 | Comparison of superoxide anion radical production in wild-type Camelina (Friedland et al., 2019) is similar and more pronounced
and CAO RNAi transgenic lines. Moderate light (ML) (850 µmol photons when grown under high light conditions.
m−2 s−1 ) and low light (LL) (200 µmol photons m−2 s−1 ) grown wild-type In this study, we compared the light stress performance
(WT), CR L-I (Chl a/b = 4.5–6.5), CR H-I (Chl a/b = 6.5–8.5) and CR V-H (Chl
a/b 8.5 or above) transgenic plant leaves were treated with nitroblue
of Camelina CAO RNAi plants grown under ML and LL
tetrazolium (NBT) for histochemical staining for superoxide production during conditions to determine; (1) whether plants with different Chl
illumination at ML or LL for 4 h (A). Quantitative levels of the superoxide a/b ratios and grown under different light intensities had altered
produced were analyzed from the image in grayscale value using Image J sensitivity to photoinhibition associated with ROS production
(rsb.info.nih.gov/ij) (B). All experiments were done using fully expanded leaves
and lipid peroxidation; and (2) whether the optimal light
from the top of 4–5 weeks old plants. Results represent the average and SD
of three independent measurements. ∗, values are significantly different at harvesting antenna size for seed yield depends on the growth
P < 0.05 and ∗∗, values are significantly different at P < 0.01 between light intensities. Our results suggest that the optimal Chl a/b ratio
experimental groups. for photosynthetic performance increases from that of wild-type
plants as the growth light intensity increases. We observed that
high-light induced photoinhibition, ROS and MDA production
DISCUSSION were lowest in ML grown plants having Chl a/b ratios (5) optimal
for biomass production. In contrast, under low light growth
Previously, it has been demonstrated that optimizing light conditions there were no significant differences in sensitivity
harvesting antenna size enhances light utilization efficiency to photoinhibition, ROS or MDA production between plants
leading up to a 40% increase in algal biomass yield relative to WT having Chl a/b ratios ranging from 3.2 (WT) to 10. As previously
green algae (Mussgnug et al., 2007; Perrine et al., 2012). Similar reported (Bruch and Thayer, 1983), high lipid peroxidation
yield enhancement results were observed for transgenic Camelina results in reduction in membrane fluidity by lipid peroxidation.
having slightly reduced light harvesting antenna sizes (Friedland Thus, plants with increased ROS production are likely to have
et al., 2019). It was observed both in green algae and plants that more damaged membranes as observed in higher light grown
there is a tipping point in light harvesting antenna size (Chl a/b plants (Figure 5).
ratio = 5) where even a small change in Chl a/b values can result The reason for the higher sensitivity to HL stress in
in significant differences in thylakoid membrane architecture, plants having antenna sizes corresponding to Chl a/b ratios
Frontiers in Plant Science | www.frontiersin.org 8 May 2020 | Volume 11 | Article 505Wu et al. Optimal Light Harvesting Antenna Size
FIGURE 7 | Chl a/b ratio dependent changes in seed pod number in
wild-type (triangles) and CAO RNAi transgenic lines (circles) grown in
moderate light (ML) (850 µmol photons m−2 s−1 ) (A) or in low light (LL) (200
µmol photons m−2 s−1 ) (B). The data were fit with a second order polynomial
function. Chl content was determined according to Porra et al. (1989).
Lhcb3 and Lhcb1 as well as a minor LHCII polypeptide, Lhcb6
(Figure 3). Lhcb3 is a major component of LHCII M-trimer,
and Lhcb6 is involved in connecting the M-trimer to PSII core
to form higher-order PSII-LHCII supercomplexes together with
Lhcb4 (Kouřil et al., 2012). Lhcb1 levels were also reduced
with increasing reductions in Chl b. Based on previous studies
assessing the relative abundance of LHCII supercomplexes and
FIGURE 6 | Comparison of number of seed pods (A), weight of seed pods LHCII loosely bound trimers (Friedland et al., 2019) we conclude
(B) and height of plants (C) in wild-type and CAO RNAi transgenic lines. that the LHCII L-trimers are most sensitive to reductions in
Wild-type (WT), CR L-I (Chl a/b = 4.5–6.5), CR H-I (Chl a/b = 6.5–8.5), and Chl b followed by the LHCII M-trimers (Friedland et al., 2019).
CR V-H (Chl a/b 8.5 or above) transgenic lines grown in moderate light (ML) There is no direct evidence to prove whether missing Chl b was
(850 µmol photons m−2 s−1 ) or in low light (LL) (200 µmol photons
replaced by Chl a, however, during pigment assembly with LHC
m−2 s−1 ). Grouping of transgenic lines was made using fully expanded leaves
from the top of 4–5 weeks old plants. Results represent the average and SD apoproteins, but we speculate that the pigment composition of
of three independent measurements. **, values are significantly different at LHCII is likely to have changed, because the ratio of Chl a/b in
P < 0.05 between experimental groups. isolated LHCII-L trimer complexes was significantly increased
[from 1.56 (WT) to 2.2 and 4.5] with decreased Chl levels (38
and 54%) in CR H-I and CR V-H lines (Friedland et al., 2019).
less than 5 may in part be due to the role of Chl b in To determine the impact of Chl b and antenna size reduction
stabilizing antennae pigment-protein complexes that mediate on high-light induced photoprotective systems, we assessed the
NPQ processes. The cbs3 Chlamydomonas lines lacking all Chl b impact of varied Chl b reduction on NPQ associated factors.
showed impaired photo-autotropic growth and failed to carry out NPQ is enhanced by the presence of PsbS and zeaxanthin as well
normal photoprotective processes including; state transitions and as by low pH (Li et al., 2002). Thus, we quantified the impact
NPQ relative to WT plants (Perrine et al., 2012). Re-arrangement of Chl b reduction on PsbS and xanthophyll cycle carotenoid
of PSII-LHCII supercomplexes is observed in HL-acclimated levels. The level of zeaxanthin per Chl a and the de-epoxidation
Arabidopsis plants, which is accompanied by reductions in Lhcb3 state increased in the CR H-I and CR V-H lines (Table 1)
and Lhcb6 levels (Kouřil et al., 2013). In this study, we also report inconsistent with the reduction in NPQ levels (Figure 1) and
noticeable decreases in major LHCII polypeptides, especially increased production of ROS in the low Chl b CAO RNAi lines
Frontiers in Plant Science | www.frontiersin.org 9 May 2020 | Volume 11 | Article 505Wu et al. Optimal Light Harvesting Antenna Size
(Figure 4). However, total xanthophyll pigment contents were plants with smaller antenna. The effects of small reductions in
lower than WT in CAO RNAi lines (Table 1) consistent with antenna size on excess light mediated stress response were not as
reductions in NPQ and increased ROS production. In contrast, pronounced for plants grown under LL conditions. In addition,
there was no apparent reduction in PsbS levels in Camelina plants there was a more pronounced tipping point in seed production
having wild-type to very low levels of Chl b (Figure 3). These (fitness) associated with slight antenna size reduction under high
results are surprising given that adjustments in PsbS levels in light than low light growth conditions. The fact that wild-type
response to light stress are correlated with NPQ levels (Ballottari plants and algae have less than optimal antenna sizes, suggests
et al., 2007; Albanese et al., 2016). However, in other studies that the driver for antenna size was to perform well under low
altering antenna size in Arabidopsis Lhcb1 and Lhcb2 knock- light conditions rather than high light conditions.
down mutants, no reduction in PsbS levels were observed (Nicol
et al., 2019). We also observed reductions in Lhcb1 levels in
the low Chl b CAO RNAi lines. Thus, it can be inferred that DATA AVAILABILITY STATEMENT
alterations in the loosely bound LHCII complex levels have little
or no impact on PsbS levels or NPQ. Regardless, ROS production All datasets generated for this study are included in the
increased with reductions in Chl b levels without changes in NPQ article/Supplementary Material.
levels. Collectively, these results suggest that ROS production and
NPQ are not directly correlated and that alternate de-excitation
pathways for NPQ and ROS production exist in plants (Berman AUTHOR CONTRIBUTIONS
et al., 2015). Overall, the lowest levels of ROS production were
observed in WT and the CR L-1 lines and increased in very low GW contributed to the design of light stress experiments, and
Chl b lines. Consistent with earlier observations these results measurements of leaf chlorophyll content, MDA, superoxide
indicate the optimal light harvesting antenna size is a Chl a/b and biomass yield, and substantially to drafting the manuscript.
ratio of 5 (Friedland et al., 2019). LM carried out light stress and leaf chlorophyll fluorescence
An additional factor that may determine the optimal measurement. RS provided transgenic plant materials and
light harvesting antenna size is the ability to recover from contributed to the experimental design, financial support, writing
photoinhibitory light treatment. Under prolonged HL stress and editing of the manuscript. C-HL contributed to the design
(24 h) the CR V-H lines failed to show even partial restoration of of the experimental system, provided research oversight and
HL-repressed NPQ compared with WT, CR L-I and CR H-I lines financial support, and manuscript editing.
(Figure 1). In fact, the CR L-I lines exhibited the greatest ability
to recover NPQ activity following high light stress followed by
WT, CR H-I and CR V-H. For high light grown plants, plants FUNDING
having a Chl a/b ratio of 5 had the greatest ability to recover
NPQ following light stress, and the lowest yields of ROS, MDA This research was also supported by Bayer Crop Sciences.
and photoinhibition. Earlier studies had also shown that algae
and plants with self-adjusting antenna sizes or Chl a/b ratio of
5, had the highest biomass productivity and seed production, ACKNOWLEDGMENTS
respectively (Friedland et al., 2019; Negi et al., 2020). In this
study, we compared seed production (fitness) across a broad C-HL acknowledges support from the Next-Generation
range of plants having altered Chl a/b ratios grown at low and Biogreen 21 Program (SSAC, Grant No. PJ013155012019),
high light intensities. The assessment of various photosynthetic Rural Development Administration; the Basic Science Research
performance characteristics indicates that plants with Chl a/b Program of the National Foundation of Korea (NRF), by the
ratios > 5 have reductions in multiple photosynthetic parameters Ministry of Science, ICT and Future Planning (Grant No.
leading to reduced fitness (seed yield). NRF-2017R1A2A2A05001287).
In summary, CAO RNAi lines with slightly reduced antenna
(Chl a/b ratio = 5) compared to WT showed improved tolerance
to HL stress and recovered well following HL stress when SUPPLEMENTARY MATERIAL
grown at greater than saturating light intensities. These more
efficient plants also accumulated lower levels of damaging The Supplementary Material for this article can be found online
ROS and demonstrated less damage (reduced MDA, reduced at: https://www.frontiersin.org/articles/10.3389/fpls.2020.00505/
photoinhibition and greater NPQ recovery) than WT plants or full#supplementary-material
REFERENCES Alboresi, A., Caffarri, S., Nogue, F., Bassi, R., and Morosinotto, T. (2008). In silico
and biochemical analysis of Physcomitrella patens photosynthetic antenna:
Albanese, P., Manfredi, M., Meneghesso, A., Marengo, E., Saracco, G., identification of subunits which evolved upon land adaptation. PLoS One
Barber, J., et al. (2016). Dynamic reorganization of photosystem 3:e0002033. doi: 10.1371/journal.pone.0002033
II supercomplexes in response to variations in light intensities. Asada, K. (1999). The water-water cycle in chloroplasts: scavenging of active
Biochim. Biophys. Acta 1857, 1651–1660. doi: 10.1016/j.bbabio.2016. oxygens and dissipation of excess photons. Annu. Rev. Plant Biol. 50, 601–639.
06.011 doi: 10.1146/annurev.arplant.50.1.601
Frontiers in Plant Science | www.frontiersin.org 10 May 2020 | Volume 11 | Article 505Wu et al. Optimal Light Harvesting Antenna Size
Ballottari, M., Dall’Osto, L., Morosinotto, T., and Bassi, R. (2007). Contrasting Masia, A. (2003). “Physiological effects of oxidative stress in relation to
behavior of higher plant photosystem I and II antenna systems during ethylene in postharvest produce,” in Postharvest Oxidative Stress in
acclimation. J. Biol. Chem. 282, 8947–8958. doi: 10.1074/jbc.M606417200 Horticultural Crops, ed. D. M. Hodges, (New York, NY: Food Products Press),
Berman, G. P., Nesterov, A. I., López, G. V., and Sayre, R. T. (2015). Superradiance 165–197.
transition and nonphotochemical quenching in photosynthetic complexes. Mussgnug, J. H., Thomas-Hall, S., Rupprecht, J., Foo, A., Klassen, V., Mcdowall, A.,
J. Phys. Chem. C 119, 22289–22296. doi: 10.1021/acs.jpcc.5b04455 et al. (2007). Engineering photosynthetic light capture: impacts on improved
Bondarava, N., Gross, C. M., Mubarakshina, M., Golecki, J. R., Johnson, G. N., solar energy to biomass conversion. Plant Biotechnol. J. 5, 802–814. doi: 10.
and Krieger-Liszkay, A. (2010). Putative function of cytochrome b559 as a 1111/j.1467-7652.2007.00285.x
plastoquinol oxidase. Physiol. Plant. 138, 463–473. doi: 10.1111/j.1399-3054. Negi, S., Perrine, Z., Friedland, N., Kumar, A., Tokutsu, R., Minagawa, J., et al.
2009.01312.x (2020). Light-regulation of light harvesting antenna size substantially enhances
Bruch, R. C., and Thayer, W. S. (1983). Differential effect of lipid peroxidation on photosynthetic efficiency and biomass yield in green algae. Plant J. doi: 10.1111/
membrane fluidity as determined by electron spin resonance probes. Biochim. TPJ.14751
Biophys. Acta 733, 216–222. doi: 10.1016/0005-2736(83)90525-4 Nicol, L., Nawrocki, W. J., and Croce, R. (2019). Disentangling the sites of non-
Chen, M., Li, Y., Birch, D., and Willows, R. D. (2012). A cyanobacterium that photochemical quenching in vascular plants. Nat. Plants 5, 1177–1183. doi:
contains chlorophyll f–a red-absorbing photopigment. FEBS Lett. 586, 3249– 10.1038/s41477-019-0526-5
3254. doi: 10.1016/j.febslet.2012.06.045 Niyogi, K. K., Grossman, A. R., and Björkman, O. (1998). Arabidopsis mutants
Crepin, A., and Caffarri, S. (2018). Functions and evolution of Lhcb isoforms define a central role for the xanthophyll cycle in the regulation of photosynthetic
composing LHCII, the major light harvesting complex of photosystem II of energy conversion. Plant Cell 10, 1121–1134. doi: 10.1105/tpc.10.7.1121
green eukaryotic organisms. Curr. Protein Pept. Sci. 19, 699–713. doi: 10.2174/ Ort, D. R., Zhu, X., and Melis, A. (2011). Optimizing antenna size to maximize
1389203719666180222101534 photosynthetic efficiency. Plant Physiol. 155, 79–85. doi: 10.1104/pp.110.
Friedland, N., Negi, S., Wu, G., Ma, L., Flynn, S., Kummsa, T., et al. (2019). 165886
Fine-tuning the photosynthetic light harvesting apparatus for improved Peever, T. L., and Higgins, V. J. (1989). Electrolyte leakage, lipoxygenase, and lipid
photosynthetic efficiency and biomass yield. Sci. Rep. 9, 1–12. doi: 10.1038/ peroxidation induced in tomato leaf tissue by specific and nonspecific elicitors
s41598-019-49545-8 from Cladosporium fulvum. Plant Physiol. 90, 867–875. doi: 10.1104/pp.90.
Fryer, M. J., Oxborough, K., Mullineaux, P. M., and Baker, N. R. (2002). Imaging 3.867
of photo-oxidative stress responses in leaves. J. Exp. Bot. 53, 1249–1254. doi: Perrine, Z., Negi, S., and Sayre, R. T. (2012). Optimization of photosynthetic light
10.1093/jexbot/53.372.1249 energy utilization by microalgae. Algal Res. 1, 134–142. doi: 10.1016/j.algal.
Gilmore, A. M., and Yamamoto, H. Y. (1991). Zeaxanthin formation and 2012.07.002
energy-dependent fluorescence quenching in pea chloroplasts under artificially Porra, R., Thompson, W., and Kriedemann, P. (1989). Determination of
mediated linear and cyclic electron transport. Plant Physiol. 96, 635–643. doi: accurate extinction coefficients and simultaneous equations for assaying
10.1104/pp.96.2.635 chlorophylls a and b extracted with four different solvents: verification of the
Hodges, D. M., Delong, J. M., Forney, C. F., and Prange, R. K. (1999). Improving the concentration of chlorophyll standards by atomic absorption spectroscopy.
thiobarbituric acid-reactive-substances assay for estimating lipid peroxidation Biochim. Biophys. Acta 975, 384–394. doi: 10.1016/s0005-2728(89)80
in plant tissues containing anthocyanin and other interfering compounds. 347-0
Planta 207, 604–611. doi: 10.1007/s004250050524 Towbin, H., Staehelin, T., and Gordon, J. (1979). Electrophoretic transfer of
Hoober, J. K., Eggink, L. L., and Chen, M. (2007). Chlorophylls, ligands and proteins from polyacrylamide gels to nitrocellulose sheets: procedure and some
assembly of light-harvesting complexes in chloroplasts. Photosynth. Res. 94, applications. Proc. Natl. Acad. Sci. U.S.A. 76, 4350–4354. doi: 10.1073/pnas.76.
387–400. doi: 10.1007/s11120-007-9181-1 9.4350
Horton, P., Ruban, A. V., Rees, D., Pascal, A. A., Noctor, G., and Young, A. J. Zulfugarov, I. S., Tovuu, A., Eu, Y.-J., Dogsom, B., Poudyal, R. S., Nath, K., et al.
(1991). Control of the light-harvesting function of chloroplast membranes by (2014). Production of superoxide from Photosystem II in a rice (Oryza sativa
aggregation of the LHCII chlorophyll—protein complex. FEBS Lett. 292, 1–4. L.) mutant lacking PsbS. BMC Plant Biol. 14:242. doi: 10.1186/s12870-014-
doi: 10.1016/0014-5793(91)80819-o 0242-2
Huang, W., Zhang, S.-B., and Liu, T. (2018). Moderate photoinhibition of Zulfugarov, I. S., Tovuu, A., Kim, J.-H., and Lee, C.-H. (2011). Detection of reactive
photosystem II significantly affects linear electron flow in the shade-demanding oxygen species in higher plants. J. Plant Biol. 54, 351–357. doi: 10.1007/s12374-
plant Panax notoginseng. Front. Plant Sci. 9:637. doi: 10.3389/fpls.2018.00637 011-9177-4
Kouřil, R., Dekker, J. P., and Boekema, E. J. (2012). Supramolecular organization
of photosystem II in green plants. Biochim. Biophys. Acta 1817, 2–12. doi: Conflict of Interest: The authors declare that the research was conducted in the
10.1016/j.bbabio.2011.05.024 absence of any commercial or financial relationships that could be construed as a
Kouřil, R., Wientjes, E., Bultema, J. B., Croce, R., and Boekema, E. J. (2013). High- potential conflict of interest.
light vs. low-light: effect of light acclimation on photosystem II composition
and organization in Arabidopsis thaliana. Biochim. Biophys. Acta 1827, 411–419. Copyright © 2020 Wu, Ma, Sayre and Lee. This is an open-access article distributed
doi: 10.1016/j.bbabio.2012.12.003 under the terms of the Creative Commons Attribution License (CC BY). The use,
Li, X. P., Müller-Moulé, P., Gilmore, A. M., and Niyogi, K. K. (2002). PsbS- distribution or reproduction in other forums is permitted, provided the original
dependent enhancement of feedback de-excitation protects photosystem II author(s) and the copyright owner(s) are credited and that the original publication
from photoinhibition. Proc. Natl. Acad. Sci. U.S.A. 99, 15222–15227. doi: 10. in this journal is cited, in accordance with accepted academic practice. No use,
1073/pnas.232447699 distribution or reproduction is permitted which does not comply with these terms.
Frontiers in Plant Science | www.frontiersin.org 11 May 2020 | Volume 11 | Article 505You can also read