The Effect of Red & Blue Rich LEDs vs Fluorescent Light on Lollo Rosso Lettuce Morphology and Physiology
←
→
Page content transcription
If your browser does not render page correctly, please read the page content below
ORIGINAL RESEARCH
                                                                                                                                          published: 18 February 2021
                                                                                                                                        doi: 10.3389/fpls.2021.603411

                                             The Effect of Red & Blue Rich LEDs
                                             vs Fluorescent Light on Lollo Rosso
                                             Lettuce Morphology and Physiology
                                             Laura Cammarisano 1,2* , Iain S. Donnison 1 and Paul R. H. Robson 1
                                             1
                                              IBERS, Aberystwyth University, Aberystwyth, United Kingdom, 2 Next-Generation Horticultural Systems, Leibniz-Institute
                                             of Vegetable and Ornamental Crops (IGZ), Grossbeeren, Germany

                                             The challenges of feeding an increasing population, an increasingly urban population
                                             and within an increasingly challenging global environment have focused ideas on new
                                             ways to grow food. Growing food in a controlled environment (CE) is not new but
                                             new technologies such as broad-spectrum LEDs and robotics are generating new
                                             opportunities. Growth recipes can be tailored to plant species in a CE and plasticity
                                             in plant responses to the environment may be utilized to make growth systems more
                                             efficient for improved yield and crop quality. Light use efficiency within CE must consider
                                             energy requirements, yield and impacts on quality. We hypothesized that understanding
                                             how plants change their morphology and physiology in response to light will allow us
                           Edited by:        to identify routes to make light more efficient for delivery of high-quality produce. We
                   Bernard Grodzinski,       focused on responses to light in Lollo rosso lettuce which produces compact, crinkly
         University of Guelph, Canada
                                             and highly pigmented leaves. We compared the spectra of the commonly used artificial
                      Reviewed by:
                                             light sources in indoor farming (compact fluorescence tubes, FL, and broad-spectrum
                Raymond M. Wheeler,
     National Aeronautics and Space          light-emitting diodes, LEDs) at two irradiance levels (270 and 570 µmol m−2 s−1 ).
 Administration (NASA), United States        We discovered LEDs (λP : 451, 634, and 665 nm) produced the same amount of
                  Francesco Di Gioia,
  Pennsylvania State University (PSU),       produce for half the incident energy of FL (T5). At higher irradiances LEDs produced
                        United States        9% thicker leaves, 13% larger rosettes and 15% greater carotenoid content. Leaves
                 *Correspondence:            differed in light absorptance with plants grown under lower FL absorbing 30% less
                 Laura Cammarisano
                                             of mid-range wavelengths. We show that the relative efficiencies of LED and FL is a
               cammarisano@igzev.de
                                             function of the irradiances compared and demonstrate the importance of understanding
                   Specialty section:        the asymptotes of yield and quality traits. Increasing our understanding of structural and
         This article was submitted to
        Crop and Product Physiology,
                                             biochemical changes that occur under different combination of wavelengths may allow
               a section of the journal      us to better optimize light delivery, select for different ranges of plasticity in crop plants
            Frontiers in Plant Science       and further optimize light recipes.
      Received: 06 September 2020
        Accepted: 28 January 2021            Keywords: LED – light emitting diode, fluorescent light, red lettuce, light spectral composition, irradiance, leaf
       Published: 18 February 2021           optical properties, leaf structural and functional traits, light adaptation

                              Citation:
    Cammarisano L, Donnison IS and
Robson PRH (2021) The Effect of Red
                                            INTRODUCTION
& Blue Rich LEDs vs Fluorescent Light
  on Lollo Rosso Lettuce Morphology
                                            Incident light provides both energy and information by powering and regulating plant growth and
                       and Physiology.      development. The use of focused light treatments, with direct effects on physiological processes,
          Front. Plant Sci. 12:603411.      allows fine manipulation of the plant phenotype (Carvalho and Folta, 2015). When absorption of
       doi: 10.3389/fpls.2021.603411        photosynthetically active photons exceeds the photosystems capacity to utilize excitation energy,

Frontiers in Plant Science | www.frontiersin.org                                   1                                        February 2021 | Volume 12 | Article 603411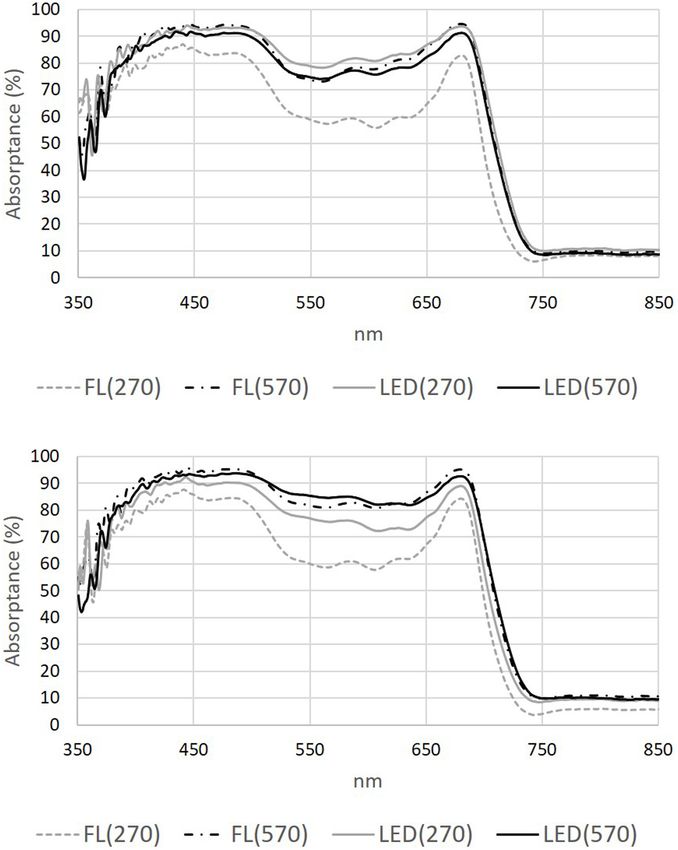
Cammarisano et al.                                                                                                Red Lettuce Adaptations to Light

dissipation of the excess energy is necessary to avoid or to             level (e.g., rosette compactness) and leaf level (e.g., pigmentation,
reduce the risk of photooxidative damage. The excess excitation          thickness, leaf structural anatomy) were studied in combination
energy can be re-emitted as radiation energy and particularly            with chlorophyll fluorescence and leaf absorptance to investigate
chlorophyll a fluorescence or as non-radiative energy that can           plant adaptations to irradiance and light quality. We compared
be dissipated thermally via non-photochemical quenching (NPQ)            Lollo rosso growing in the same controlled environment (CE)
(Niyogi, 2000; Ruban et al., 2007; Kalaji et al., 2017; Kress and        cabinet under two efficient light sources, fluorescent and LEDs,
Jahns, 2017).                                                            at two irradiances to better understand the relative adaptations
    Plants optimize light capture and prevent photodamage in             and efficacy of the light sources and the interactions between their
fluctuating light conditions. Adaptations act across different           different light spectra and yield and crop quality.
scales from macro scale to the micro scale (Bjorkman and
Demmig-Adams, 1995). Adjustments at plant/leaf level
affect light interception and absorption through changes                 MATERIALS AND METHODS
in plant compactness, stem elongation, leaf movement,
protective pigment synthesis (e.g., anthocyanins), protective            Plant Material and Growth Conditions
leaf layers (e.g., wax or trichomes) and leaf area. Further              Red lettuce Lollo rosso seeds (Antonet RZ seeds from RijkZwaan,
adjustments include changes in leaf ultrastructure, i.e., the            De Lier, The Netherlands) were sown in 155 g of sieved
number of cells or airspaces, chloroplast movement and                   John Innes No. 3 soil-based compost. Water holding “field”
more in-depth changes in photosystem stoichiometry and                   capacity of the compost was calculated following the gravimetric
synthesis of antioxidants to scavenge reactive oxygen species            method for soil moisture determination (Reynolds, 1970). Pots
(Bensink, 1971; Štroch et al., 2004; Terashima et al., 2009;             (7 cm × 7 cm × 10 cm) were filled, saturated with water, covered
Davis et al., 2011).                                                     with plastic film and left to drain at room temperature (20 ± 5◦ C).
    Not all incident photons are absorbed because of differences         After 24 h pot weight was noted and pots were dried in the
in intrinsic absorption levels of different wavelengths of light.        oven at 105◦ C. Every 24 h pots were weighed until stable dry
This means that, regardless of the amount of light reaching              weight (DW) was reached. The dry and wet weights were used
the leaf, the capture of photons and the energy conversion               to estimate the weight of pots and soil at approximately 0 and
efficacy of radiant energy into biomass depends on the                   100% field capacity and water content in between these extremes
wavelength of the photon (Hoover, 1937; McCree, 1981). Photon            was estimated as a linear proportion of the difference between
energy is inversely proportional to the wavelength (E = h                these values. Pots with plants were individually irrigated to 80%
c/λ), consequently energy decreases across the electromagnetic           field capacity (205 g) every 48 h until harvest at day 30. The 48
spectrum, photons with longer wavelengths (>750 nm) have                 pots containing seeds were placed into the experimental system
too little energy for photochemistry (1.8 eV, equivalent to              (Fitotron, growth cabinet) which was partitioned in two halves
the energy of a red photon) and the short wavelengths                    separated by white reflective sheets (ORCA grow film, California
photons have excessive energy (Zhu et al., 2008; Barber,                 Grow Films LLC). One side of the cabinet was equipped with
2009; Thapper et al., 2009; Kusuma et al., 2020). Plant                  fluorescent tubes [FL, compact fluorescent tubes spectrum (T5,
adaptive mechanisms to incident radiation can be indicative              F28W/835, 3,500 K), with a spectral composition of blue (401–
of light stress, too little or too much, but also include                498 nm): green–yellow (499–609 nm): red (610–699 nm): far-red
desirable plant quality traits. For instance, in red lettuce, leaf       (700–750 nm) of 15: 44: 35: 6%, respectively) and the other half
pigmentation is a plant stress response and is an important              with a photosynthetically active radiation (PAR) customized LED
characteristic for visual and nutritional quality of lettuce             array (EP006, 380–760 nm, Shenzhen Herifi Co., Ltd., China,
(Becker et al., 2014).                                                   with a spectral composition of blue (401–498 nm): green–yellow
    Controlled Environment Agriculture (CEA) may produce                 (499–609 nm): red (610–99 nm): far-red (700–750 nm) of 19:
optimal growth conditions to obtain the best yield all                   5: 65: 11%, respectively). Two shelves (each shelf was 0.27 m2 ,
year-round (Kozai, 2013). Plant factories could include                  with 12 plant replicates) were arranged in each side of the
environmental stresses in growth recipes to enhance crop                 cabinet at different heights to generate two irradiance levels (270
quality. Furthermore, plant biochemical and biophysical                  and 570 µmol m−2 s−1 ) for a total of four light treatments
responses to the environment may change the way light is                 [FL(270) (270 µmol m−2 s−1 ), FL(570) (570 µmol m−2 s−1 ),
absorbed and could be exploited to further enhance plant                 LED(270) (270 µmol m−2 s−1 ), LED(570) (570 µmol m−2 s−1 )].
performance (Ustin and Jacquemoud, 2020). Characterizing                 Environmental conditions were monitored by four Tinytag
plant responses, especially at leaf level, to light intensity and        Ultra 2 (Gemini Data Loggers, Chichester, United Kingdom)
spectral quality has great potential for the rapidly evolving            placed in each of the treatment areas. Photoperiod was 18 h,
indoor farming including environmental optimization of                   temperature was maintained at an average of 22◦ C, relative
stress application and manipulation of plant morphology                  humidity 50% and ambient CO2 (environmental data from
(Carter and Knapp, 2001; Carvalho and Folta, 2015;                       the individual treatment areas is in Table 1). Irradiance and
Bergstrand et al., 2016).                                                light spectral composition of the treatments were measured
    The aim of this work was to characterize some of the adaptive        (Figure 1) using the spectroradiometer SpectraPen LM 500
morphological and physiological responses to light in the                (cosine-corrected, 380–780 nm; Photon Systems International,
pigmented Lollo rosso lettuce. Morphological responses at plant          Drasov, Czech Republic).

Frontiers in Plant Science | www.frontiersin.org                     2                                   February 2021 | Volume 12 | Article 603411
Cammarisano et al. Red Lettuce Adaptations to Light
TABLE 1 | Environmental data for the treatments reported. used for rosette area, measured as canopy cover, determination
using the Shape descriptor plug in in ImageJ software (version
Treatments Temperature (◦ C) Relative humidity (%)
1.52a) (Schneider et al., 2012). Rosette shoots were harvested
FL(270) 21.6 ± 0.2 50.1 ± 0.6 from just above the cotyledons node and immediately weighed
FL(570) 22.7 ± 0.1 46.1 ± 0.4 to determine fresh weight (FW). Of the 12 plant replicates used
LED(270) 22.0 ± 0.2 49.1 ± 0.5 to determine FW, eight were then placed in a paper bag and dried
LED(570) 23.3 ± 0.2 45.7 ± 0.4 to constant weight at 60◦ C to determine DW.
Values are reported as mean ± standard error of the mean. A random selection of 3 plants were harvested for biochemical
analyses at the end of the experiment (day 30). Fully expanded
leaves, developmentally the third and fourth leaf, were excised,
the midrib was removed and tissue immediately frozen in liquid
nitrogen before storage at -80◦ C until analyzed. Prior to analysis,
samples were freeze-dried and cold milled to a fine powder
in an automated sample grinder (Labman Automation Ltd.,
Middlesbrough, United Kingdom) for 90 s at −70◦ C.
Imaging of Leaf Disks by Light
Microscopy and Transmission Electron
Microscopy
Leaf disks of 1 cm2 were obtained from the fourth leaf (on
the right side of the midrib toward the leaf apex) of four
plant replicates and transferred to cold 2.5% glutaraldehyde in
FIGURE 1 | Spectral distribution including peak wavelengths of the four light
0.1 M sodium cacodylate at pH 7.2, after vacuum infiltration
treatments, FL(270) in dashed gray, FL(570) in dashed black, LED(270) in gray
and LED(570) in black. Fluorescent (FL) light provided by T5 fluorescent discs were stored at 4◦ C. After a series of buffered washes,
lamps. LEDs radiation provided by PAR customized LED array (diodes leaves were dehydrated in an aqueous alcohol (ethanol) series
emitting in the blue: 410, 430, and 460 nm and, diodes emitting in the red: before being fixed in LR White (Hard grade) resin and were
610, 630, and 660 nm). cut in 2–5 µm light microscopy (LM) sections on a Reichert-
Jung Ultracut E Ultramicrotome, dried and blue stained. LM
micrographs were taken using a Leica DM6000 microscope fitted
Sampling and Measurements of Plant with a Hitachi HV-D20 camera. Ultrathin 60 – 80 nm sections
of interest were cut on a Ultramicrotome (Reichert-Jung Ultracut
Morphological, Physiological and Optical E) with a diamond knife (Diatome 21 Ultra 45◦ ) and collected
Parameters on Gilder GS2 × 0.5 3.05 mm diameter nickel or copper slot
Chlorophyll a fluorescence was assessed from leaf number four grids (Gilder Grids, Grantham, United Kingdom) float-coated
using a portable HandyPEA continuous excitation chlorophyll with Butvar B98 polymer (Agar Scientific) films. transmission
fluorimeter (Hansatech, King’s Lynn, United Kingdom). electron microscopy (TEM) sections were double-stained with
First, light-adapted measurements to determine maximum uranyl acetate (Agar Scientific) and Reynold’s lead citrate (TAAB
operating efficiency of PSII photochemistry in the light Laboratories Equipment Ltd., Aldermaston, United Kingdom)
[F V /F M 0 = (F M 0 – F 0 0 )/F M 0 ] were taken, then dark-adapted and observed using a JEOL JEM1010 transmission electron
measurements were taken after 30 min of dark-adaptation using microscope (JEOL Ltd., Tokyo, Japan) at 80 kV. The resulting
the manufacturer’s leaf clips and maximum quantum efficiency images were photographed using Carestream 4489 electron
of PSII photochemistry in the dark [F V /F M = (F M – F 0 )/F M ], microscope film (Agar Scientific) and developed in Kodak D-
non-photochemical quenching [NPQ = (F M – F M 0 )/F M 0 ] and 19 developer. The derived negatives were scanned with an
performance index [PI = [1 – (F 0 /F M )/M0 /VJ ] × [(F M – Epson Perfection V800 film scanner and converted to positive
F 0 )/F 0 ] × [1 – VJ )/VJ )] were determined for four replicates. images (example images shown in Supplementary Figure 1).
The spectral properties of leaf number four were measured Leaf anatomy characteristics (leaf thickness, cell wall thickness
(Ocean Optics Jaz-SpectroClip-TR combined instrument, Ocean and intercellular airspaces area) was measured on the images by
Optics, Dunedin, FL, United States) on the adaxial and abaxial digital analysis of the leaf-cross sections using ImageJ.
leaf surface on day 30. Measurements were taken on the same leaf
position in three plant replicates per treatment (on the right side
of the midrib toward the leaf four apex). The leaf was illuminated Relative Water Content Determination
by a standardized light source (Halogen lamp) through an optical Leaf disks (1 cm2 ), cut from the right side of the midrib toward
fiber, and the transmitted and reflected light was analyzed with the leaf number four apex of four plant replicates, were used
respect to its spectral composition. to determine the relative water content (RWC), calculated using
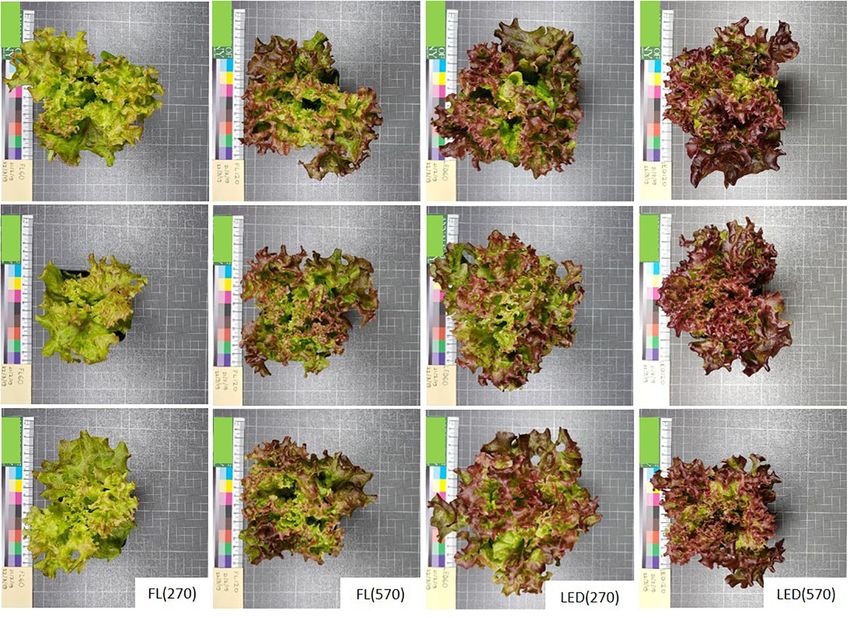
Rosette images (examples in Figure 2) were taken using a fixed the formula: [(FW-DW)/(TW-DW)]∗ 100, where FW is FW, DW
focal length digital camera and fixed-lighting stand. Images were is DW. TW, is turgid weight, which were obtained by leaving
Frontiers in Plant Science | www.frontiersin.org 3 February 2021 | Volume 12 | Article 603411Cammarisano et al. Red Lettuce Adaptations to Light
FIGURE 2 | Representative pictures of three of the lettuce replicates treated with different light. Plants grown under fluorescent light (FL) and LEDs at two irradiance
levels [270 and 570 µmol m−2 s−1 ) (FL(270), FL(570), LED(270), and LED(570)], showing differences in plant area, crinkliness and pigmentation. Pictures taken
30 days after sowing (DAS).
the leaf disk under distilled water in dark conditions for 24 h half area microplate ensuring a 1 cm pathlength using a
(Smart and Bingham, 1974). UV/VIS spectrophotometer (UV 3100 PC Spectrophotometer,
VWR, Belgium). Pigments concentration were determined using
Estimation of Foliar Anthocyanin Content equations reported in Lichtenthaler and Buschmann (2001).
From Reflectance Spectra
Reflectance measurements, recorded on the leaf adaxial and
Statistical Analysis
All the data were statistically analyzed using Microsoft Excel
abaxial surface on day 30, were used to assess red pigmentation
2016 and R studio (R version 3.5.2 (2018-12-20), “Eggshell
due to the presence of anthocyanins. A three-band approach,
Igloo”) with packages: agricolae, car, ggplot2, Mendiburu (2010),
mARI [(R530−570 −1 -R690−710 −1 )∗ RNIR, where R was the
Wickham (2016), and Fox and Weisberg (2019). For the effect
reflectance at 530, 570, 690, and 790 nm and RNIR was the
of the light treatment on the measured parameters data were
reflectance between 700 and 1000 nm] (Gitelson et al., 2006), was
analyzed by one-way analysis of variance (ANOVA) and the
used to estimate leaf anthocyanin content. The red-edge band
means were compared by Least Significance Difference (LSD),
accounts for the variability derived from chlorophyll content
at 5% significance level. The effects of two factors, “irradiance”
and the NIR band for variability related to leaf structure and
and “light source,” and their interaction were tested by two-way
composition (Croft and Chen, 2018).
analysis of variance (ANOVA) (Muggeo, 2003).
Extraction and Quantification of Leaf
Chlorophyll and Carotenoid Content RESULTS
Lyophilized powdered leaf (15 mg) was extracted in three
consecutive washes with 95% ethanol. After 48 h, absorbance Yield and Morphological Responses
of the collected extract was read at 470, 649, and 664 nm Interaction effect was detected between irradiance and light
against the same amount of blank solution in a 96 well source on the averaged FWs and DWs of red lettuce (p = 0.003
Frontiers in Plant Science | www.frontiersin.org 4 February 2021 | Volume 12 | Article 603411Cammarisano et al. Red Lettuce Adaptations to Light
and 0.017, respectively). Light treatments had a significant effect LED(570)] had 11 and 13% greater chlorophyll a:b ratio. Light
on FW and DW (p = 0.000 and p = 7.0 × 10⁻⁵ , respectively) of treatment had a significant effect on levels of the ancillary light
Lollo rosso lettuce growing in the same environment but under harvesting and photoprotective carotenoid pigments (p = 0.014).
two different light sources at two different irradiances (Table 2). Carotenoid content of leaves grown under the highest irradiance
Increasing irradiance of FL significantly increased shoot FW of LED treatment was significantly higher (15%) than the other
(69%) and DW (98%) of “Lollo rosso.” Increasing irradiance three light treatments, which were statistically similar.
under LED treatment did not significantly increase FW or DW Two-way ANOVA demonstrated the light source had a
and biomass values of both LED treatments were grouped with significant effect on all the photosynthetic and pigment
the higher FL treatment by post hoc test. parameters measured except for chlorophyll a:b ratio and
Rosette area (canopy cover) was significantly different between irradiance significantly affected pigments; chlorophyll b and
different light treatments (p = 0.004) (Table 2). Rosettes growing carotenoid contents and chlorophyll a:b ratio. There was
under treatment FL(270) were the smallest, resulting 12% smaller no detectable significant interaction effect on any of the
than rosettes grown under FL(570). In contrast, increasing measured parameters.
irradiance under LEDs decreased rosette area. The largest rosettes Absorptance measurements from the fourth leaf of “Lollo
of any treatments were from plants growing under LED(270), rosso” lettuce plants were influenced by light treatment
rosette area under the higher LED irradiance (LED570) was 13% (Figures 3A,B). Absorptance across the whole PAR region
lower but still greater than either FL treatment. was affected by both light source (p = 0.001) and irradiance
Light treatment had a significant effect on leaf thickness (p = 4.5 × 10⁻⁵ ). Leaf absorptance was significantly lower in
measured on cross-sections of the fourth leaf (p = 2.2 × 10⁻⁵ ). FL(270) samples (∼10% less) than in the other three treatments
The thickest leaves were from plants growing under higher LED in the PAR region (400–700 nm) (p = 3.3 × 10⁻⁶ ). Absorptance in
treatments [LED(570)] and the thinnest from FL(270) plants the middle wavebands, exemplified by 560 nm, was significantly
(Table 2 and Supplementary Figure 1). Light treatment did not lower in FL(270) grown leaves (∼20% less) than all other leaves
have a significant effect on the leaf water status of Lollo rosso (p = 6.6 × 10⁻⁶ ). There was a significant interaction effect
lettuce (Supplementary Table 1). Intercellular airspace doubled between light source and irradiance on the leaf absorptance
from FL(270) to FL(570) leaves which exhibited the highest values at 560 nm (p = 0.001). Absorptance levels were similar from
overall (p = 0.004) (Table 2). the adaxial and abaxial surfaces but the abaxial absorptance
was always slightly lower. The modified anthocyanin reflectance
index (mARI) of Lollo rosso lettuce leaves was significantly
Chlorophyll Fluorescence, Leaf Optical affected by both the light intensity (p = 0.026) and source
Properties, and Pigments (p = 0.040) (Table 4). In FL(270) leaves mARI values were half
Light treatment had a significant effect on the maximum of those of all other treatments (p = 0.013), values increased
operating efficiency of PSII photochemistry in the light, F V /F M 0 , in the order FL(570) < LED(270) < LED(570) but differences
and the maximum quantum efficiency of PSII photochemistry were not statistically significant. The normalized photochemical
in the dark, F V /F M , (p = 0.017 and p = 0.030) (Table 3). The reflectance index [PRIN = PRI/[RDVI∗ (R700 /R670 )], where RDVI
highest F V /F M 0 was measured in leaves under FL(270), while the is the renormalized difference vegetation index and, R670 and
lowest was measured in leaves under LED(270). There was very R700 the reflectance at 670 and 700 nm, respectively (Zarco-
little difference but LSD post hoc test separated measurements of Tejada et al., 2013) was statistically different between light source
F V /F M in leaves grown in FL(270) from the rest of the treatments treatments (p = 1.1 × 10⁻⁹ ). PRIN was almost five-fold higher in
was slightly higher compared to an average of 0.84 from the LED treated plants (Table 4).
other three treatments. No statistical difference was found for
PI and NPQ (Supplementary Table 1). However, it was notable
that the lowest levels of NPQ values were detected from leaves DISCUSSION
grown under treatment FL(270) and NPQ was two-fold higher in
treatment LED(270). Conventional incandescent sources for lighting are inefficient
Light treatment did not have a significant effect on levels of the due to the significant production of heat rather than light,
main reaction center pigment chlorophyll a (p = 0.079) but did heat being an undesirable biproduct in most lighting situations
have a significant effect on levels of the main pigment of the light particularly but not always in horticulture (Both et al., 2017).
harvesting complex, chlorophyll b, (p = 0.013) (Table 3). Two- Improved efficiency was achieved from fluorescent lighting
way ANOVA reported a significant effect of both light source (FL) which in domestic systems was formulated as tubes and
(p = 0.020) and irradiance (p = 0.008) on chlorophyll b content. compact lighting (Mile, 2009) and fluorescent lamps have
The lowest chlorophyll b content was in FL(570) leaves while been used for over 50 years for plant growth (Thomas and
LED(270) leaves contained the greatest chlorophyll b content. Dunn, 1967; Tibbitts et al., 1983; Knight and Mitchell, 1988).
The ratio of chlorophylls a and b of the LED grown plants was Light emitting diode (LED) lighting is even more efficient in
significantly affected by the light treatment (p = 0.007). Leaves terms of reduced heat production and has additional benefits
grown under FL(270) and LED(270) treatments had the lowest such as compact size, longer life span, greater luminous
ratio, i.e., greater light harvesting chlorophyll per reaction center, efficacy, affordable cost and allows greater control of spectra
and leaves grown under the higher irradiance [FL(570) and due to the narrow wavebands achievable from differently
Frontiers in Plant Science | www.frontiersin.org 5 February 2021 | Volume 12 | Article 603411Cammarisano et al. Red Lettuce Adaptations to Light
coated LEDs (Pattison et al., 2018). Thanks to the relatively densities (PPFDs) may be attributed to spectra perhaps through
rapid improvements and the possibility to adjust the spectral stimulation of photomorphogenic adaptations.
emission according to plant needs, LEDs are becoming an Optimized spectrum LEDs focused around the red and blue
increasingly popular light source for plant growth both in wavebands (red peaks at 634 and 665 nm and blue peak at
greenhouse and closed CEs for industry and research (Mitchell 451 nm in our case) are highly efficient for plant growth (Matsuda
et al., 2015). The light technology is being used for varied et al., 2004; Zheng and Van Labeke, 2017), and also impact
purposes including as growth light, to investigate light effects, photomorphogenesis (Izzo et al., 2019). Rosette area (canopy
to increase the daily light integral (DLI) or to environmentally cover) for example, a morphological adaptation supposedly
modify the plant and is speeding up advances in horticulture resulting from the combination of multiple responses to light
(Bantis et al., 2018). such as hypocotyl length, leaf angle and leaf shape (Hoenecke
We made a direct comparison of two efficient light sources, et al., 1992; Cammarisano et al., 2020), responded mainly to
fluorescent and LED, within the same CE cabinet. The light light source and antithetically under the tested light sources. If
sources differed in their spectra and were applied at two light under FL rosettes tended to expand with increasing irradiance,
intensity levels (270 and 570 µmol m−2 s−1 ) to reduce the under LEDs increasing irradiance produced more compacted
possibility that all treatments produced responses that were rosettes. This response of rosettes impacts light interception,
asymptotic in Lollo rosso lettuce. indicating that under low fluorescent light morphology alters to
The same lower irradiance (270 µmol m−2 s−1 ) provided increase light interception, whereas under high LED interception
by fluorescent and LED lights produced approximately twice is reduced probably due to light saturation of photosynthesis for
the wet and DWs when delivered from LEDs. At equal PPF Lollo rosso lettuce under the tested growth conditions.
regimes, the major difference in the tested light treatments was Leaf anthocyanin content responded in parallel to rosette
in the proportions of different wavebands emitted by the two morphology and increased under high light. The photoprotective
light sources (Figure 1). We detected no statistical difference and antioxidant capacity of anthocyanins reduces light
in leaf temperature (23.2 ± 0.2◦ C) between treatments and absorptance by chlorophyll and reduces photodamage by
thus the effect of the same photosynthetically photon flux scavenging active oxygen resulting from the photo-excitation
TABLE 2 | Growth responses and leaf structural traits of Lollo rosso lettuce (30 DAS) growing under the same high and low irradiances of fluorescent, FL(270) and
FL(570), and LED, LED(270), and LED(570), light.
Treatments Rosette area** (cm2 ) Fresh weight*** Dry weight*** Leaf thickness*** Air spaces** (µm2 )
(n = 3) (g/head) (n = 12) (g/head) (n = 8) (mm) (n = 18) (n = 9)
FL(270) 181.9 ± 18.8c 10.2 ± 1.1b 0.62 ± 0.07b 0.18 ± 0.01c 1.89 ± 0.20b
FL(570) 202.8 ± 2.8b,c 17.3 ± 0.9a 1.23 ± 0.05a 0.22 ± 0.00b 4.11 ± 0.63a
LED(270) 259.3 ± 6.8a 18.6 ± 1.5a 1.25 ± 0.14a 0.21 ± 0.00b 2.67 ± 0.24b
LED(570) 229.5 ± 13.1a,b 17.6 ± 1.6a 1.27 ± 0.17a 0.24 ± 0.00a 2.33 ± 0.44b
Two-way ANOVA
Irradiance * * *** *
Light source ** ** ** ***
Interaction ** *
Values are reported as mean ± standard error of the mean. Different letters within columns indicate significant treatment differences at P < 0.05, as determined by
Fisher’s least significant difference (LSD) test, with a > b > c. Significance codes (ANOVA): 0.000 “***,” 0.001 “**,” 0.01 “*.”
TABLE 3 | Chlorophyll fluorescence and chlorophyll and carotenoid pigment content of Lollo rosso lettuce growing under the same high and low irradiances of
fluorescent, FL(270) and FL(570), and LED, LED(270), and LED(570), light for 30 days.
Treatments F V /F M ’* (n = 4) F V /F M * (n = 4) Chlorophyll a (mg Chlorophyll b* (mg Chlorophyll a:b** Carotenoids* (mg
g−1 ) (n = 3) g−1 ) (n = 3) (n = 3) g−1 ) (n = 3)
FL(270) 0.79 ± 0.01a 0.86 ± 0.00a 6.18 ± 0.07 2.04 ± 0.07a,b 3.03 ± 0.13b 1.46 ± 0.01b
FL(570) 0.75 ± 0.01ab 0.85 ± 0.00ab 5.99 ± 0.32 1.78 ± 0.09c 3.37 ± 0.02a 1.50 ± 0.07b
LED(270) 0.70 ± 0.04b 0.84 ± 0.01b 6.80 ± 0.15 2.30 ± 0.07a 2.96 ± 0.03b 1.55 ± 0.05b
LED(570) 0.72 ± 0.01ab 0.83 ± 0.01b 6.67 ± 0.23 1.99 ± 0.09b,c 3.35 ± 0.04a 1.72 ± 0.01a
Two-way ANOVA
Irradiance ** ** *
Light source * * * * **
Interaction
Values are reported as mean ± standard error of the mean. Different letters within columns indicate significant treatment differences at P < 0.05, as determined by
Fisher’s least significant difference (LSD) test, with a > b > c. Significance codes (ANOVA): 0.001 “**,” 0.01 “*.”
Frontiers in Plant Science | www.frontiersin.org 6 February 2021 | Volume 12 | Article 603411Cammarisano et al. Red Lettuce Adaptations to Light
and Bugbee, 2001). Plants growing under low intensity FL had
the lowest absorptance across the PAR region and when 560 nm
was examined specifically (Table 4). Thus, the adaptive responses
induced under low FL may be unable to efficiently utilize the
available photons because this light is poorly intercepted. This
is also in accordance with the plants grown under low FL
appearing green indicating a lack of compounds absorbing in the
mid-wavebands. “Weakly absorbed wavelengths” absorptance
can be increased by lengthening of the light path in the leaf by
the détour effect (Terashima et al., 2009). Plants under high FL
produced the largest intercellular air spaces, a response that is
characteristic of low light conditions (Ustin and Jacquemoud,
2020). The expansion of the intercellular air spaces increases
light diffusion and the probability for a photon to be captured.
The same was not observed in FL(270) leaves, supposedly to
avoid negative consequences associated with air spaces such as
reduced mesophyll conductance to CO2 (Gorton et al., 2003).
At higher irradiances there was no longer a difference between
the biomass accumulated in plants growing under different light
sources. Chlorophyll a:b ratio increased under higher intensity
treatments regardless of the source [FL(570) and LED(570)]
reflecting a decrease in light harvesting chlorophyll b in favor
of reaction centers (Friedland et al., 2019). The observed
adaptations in the chl a:b, responding mainly to light intensity
this time, indicated an enhanced light use efficiency under higher
FIGURE 3 | Leaf absorptance from 350 to 850 nm of red lettuce grown under PPFD. Additionally, leaf thickness was greater under LED(570),
different light sources (FL, compact fluorescence tubes and LED) at two this response is known to increase in response to high light
irradiance levels (270 and 570 µmol m−2 s−1 ). (A) measurements taken on
the adaxial side of leaf number four, (B) measurements taken on the abaxial
(Poorter et al., 2019) and is an adaptive strategy that enhanced
side of leaf number four (N = 3). Absorptance was determined from water use efficiency (Yun and Taylor, 1986).
reflectance and transmittance data measured on the leaf at 30 DAS using a The increase in leaf carotenoid content in LED(570)
Halogen lamp. confirmed the likely formation of excessive radiative energy
and suggested these accessory pigments could enhance energy
dissipation (Kress and Jahns, 2017). The higher carotenoid
of chlorophyll (Gould et al., 2002; Kyparissis et al., 2007). content was not reflected in higher NPQ suggesting that
Anthocyanin content, here estimated as mARI, increased under the photoprotective mechanisms induced including greater
all light treatments compared with low FL. Bioactive compound chlorophyll a:b ratio, carotenoid and anthocyanin content
accumulation increases in response to blue light (Ouzounis et al., and reduced rosette area were sufficient to regulate light
2015), while red and blue LEDs enhance both quality and yield in absorption and mitigate against phototoxicity derived from
lettuce compared to FL lamps (Stutte et al., 2009). The FL source excess of light energy.
had major emission peaks around 560 and 610 nm and green– Our results show LEDs spectrum to potentially deliver more
yellow radiation is reported to suppress lettuce growth (Dougher energy efficiently by producing twice the DW accumulated under
TABLE 4 | Percentage absorptance in the PAR region (400–700 nm) and at 560 nm and the modified anthocyanin reflectance index (mARI) and normalized
photochemical reflectance index (PRIN ) of cv. Lollo rosso lettuce leaves grown under the same high and low irradiances of fluorescent, FL(270) and FL(570), and LED,
LED(270), and LED(570), light for 30 days.
Treatments Absorptance PAR*** (%) (n = 6) Absorptance at 560nm*** (%) (n = 6) mARI* (n = 6) PRIN *** (N = 6)
FL(270) 71.00 ± 1.94b 58.20 ± 2.52b 1.33 ± 0.13b 0.0025 ± 0.0000b
FL(570) 86.50 ± 1.54a 76.96 ± 2.36a 2.61 ± 0.27a 0.0035 ± 0.0002b
LED(270) 84.13 ± 1.58a 78.71 ± 2.00a 2.68 ± 0.53a 0.0153 ± 0.0021a
LED(570) 85.53 ± 1.41a 79.48 ± 2.63a 2.80 ± 0.20a 0.0125 ± 0.0015a
Two-way ANOVA
Irradiance *** ** *
Light source ** *** * ***
Interaction *** **
Values are reported as mean ± standard error of the mean. Different letters within columns indicate significant treatment differences at P < 0.05, as determined by
Fisher’s least significant difference (LSD) test, with a > b > c. Significance codes (ANOVA): 0.000 “***,” 0.001 “**,” 0.01 “*.”
Frontiers in Plant Science | www.frontiersin.org 7 February 2021 | Volume 12 | Article 603411Cammarisano et al. Red Lettuce Adaptations to Light
the same photon flux emitted by FL. We hypothesize the light and editing. ID: funding acquisition, supervision. PR:
composition, and more precisely the differing proportions of funding acquisition, conceptualization, resources, writing –
blue, green–yellow, red and far-red photons, have differently original draft, writing – reviewing, and editing, supervision.
excited the photosynthetic pigments of Lollo rosso lettuce altering All authors contributed to the article and approved the
its saturation threshold for yield and consequently determining submitted version.
the adaptive strategies implemented to enhance the use of the
available light.
Thus, in efficiently exploiting LED light sources it is vital to FUNDING
identify the point at which the relationships between irradiance
and desirable crop qualities become asymptotic in various LC was funded by an Aberystwyth University studentship. ID and
environments in order to avoid energy wastage and especially PR by the BBSRC Core Strategic Programme in Resilient Crops
negative influences on plant photosynthetic capacity and biomass BBS/E/W/0012843A.
accumulation. The inefficiency of the tested compact fluorescence
tubes as a light source for Lollo rosso lettuce growth may also
derive from the lack of a response that increases utilization of
other available wavebands in this light. This presumably has little
ACKNOWLEDGMENTS
evolutionary impact but it may be that constitutively pigmented We wish to thank Dr. Alan Coockson (Aberystwyth University)
crops lack an appreciable benefit from artificial light sources. for his technical assistance in the imaging of leaf disks
We conclude that the stated increased efficacy of LED versus by microscopy techniques, and Alan Gay (Aberystwyth
FL is a function of the irradiances compared and, at the University) for his kind support in the optical study of
higher irradiances compared here LEDs are no more efficient leaf properties.
than fluorescent light. The presented results demonstrate the
importance of the light source and its spectral quality plus
the interaction with irradiance in controlling plant growth and
quality, both in terms of morphology and nutritional content. SUPPLEMENTARY MATERIAL
The Supplementary Material for this article can be found
DATA AVAILABILITY STATEMENT online at: https://www.frontiersin.org/articles/10.3389/fpls.2021.
603411/full#supplementary-material
The original contributions presented in the study are included
in the article/Supplementary Material, further inquiries can be Supplementary Figure 1 | Leaf cross-sections of red lettuce plants grown under
two irradiance treatments (270 and 570 µmol m−2 s−1 ) emitted by two different
directed to the corresponding author/s.
light sources (Fluorescent light and LEDs). Images of leaf cross-sections are at the
same magnification.
AUTHOR CONTRIBUTIONS Supplementary Table 1 | Effect of two irradiance treatments (270 and 570 µmol
m−2 s−1 ) emitted by fluorescent tubes (FL) and LEDs on leaf disk relative water
LC: conceptualization, methodology, investigation, formal content (RWC), cell wall thickness, performance index (PI) and non-photochemical
analysis, writing – original draft, and writing – reviewing quenching (NPQ) of Lollo rosso lettuce at 30 DAS.
REFERENCES Both, A., Bugbee, B., Kubota, C., Lopez, R. G., Mitchell, C., Runkle, E. S.,
et al. (2017). Proposed product label for electric lamps used in the
Bantis, F., Smirnakou, S., Ouzounis, T., and Koukounaras, A. (2018). Current plant sciences. HortTechnology 32, 544–549. doi: 10.21273/HORTTECH03
status and recent achievements in the field of horticulture with the use of light- 648-16
emitting diodes (LEDs). Sci. Hortic. 235, 437–451. doi: 10.1016/j.scienta.2018. Cammarisano, L., Donnison, I. S., and Robson, P. R. H. (2020). Producing
02.058 enhanced yield and nutritional pigmentation in lollo rosso through
Barber, J. (2009). Photosynthetic energy conversion: natural and artificial. Chem. manipulating the irradiance, duration, and periodicity of LEDs in the
Soc. Rev. 38, 185–196. doi: 10.1039/b802262n visible region of light. Front. Plant Sci. 11:82. doi: 10.3389/fpls.2020.59
Becker, C., Klaering, H. P., Schreiner, M., Kroh, L. W., and Krumbein, A. (2014). 8082
Unlike quercetin glycosides, cyanidin glycoside in red leaf lettuce responds Carter, G. A., and Knapp, A. K. (2001). Leaf optical properties in higher plants:
more sensitively to increasing low radiation intensity before than after head linking spectral characteristics to stress and chlorophyll concentration. Am. J.
formation has started. J. Agric. Food Chem. 62, 6911–6917. doi: 10.1021/ Bot. 88, 677–684. doi: 10.2307/2657068
jf404782n Carvalho, S. D., and Folta, K. M. (2015). Expanding genetic potential with light
Bensink, J. (1971). On Morphogenesis of Lettuce Leaves in Relation to Light and environmentally modified organisms. Crit. Rev. Plant Sci. 2689, 486–508. doi:
Temperature. Wageningen: Veenman. 10.1080/07352689.2014.929929
Bergstrand, K. J., Mortensen, L. M., Suthaparan, A., and Gislerød, H. R. (2016). Croft, H., and Chen, J. M. (2018). “Leaf pigment content,” in Comprehensive Remote
Acclimatisation of greenhouse crops to differing light quality. Sci. Hortic. 204, Sensing, ed. S. Liang, (Oxford: Elsevier). doi: 10.1016/B978-0-12-409548-9.
1–7. doi: 10.1016/j.scienta.2016.03.035 10547-0
Bjorkman, O., and Demmig-Adams, B. (1995). “Regulation of photosynthetic Davis, P. A., Caylor, S., Whippo, C. W., and Hangarter, R. P. (2011). Changes in
light energy capture, conversion, and dissipation in leaves of higher plants,” leaf optical properties associated with light-dependent chloroplast movements.
in Ecophysiology of Photosynthesis. Springer Study Edition, Vol. 100, eds E. D. Plant Cell Environ. 34, 2047–2059. doi: 10.1111/j.1365-3040.2011.02
Schulze, and M. M. Caldwell, (Berlin: Springer). 402.x
Frontiers in Plant Science | www.frontiersin.org 8 February 2021 | Volume 12 | Article 603411Cammarisano et al. Red Lettuce Adaptations to Light Dougher, T. A. O., and Bugbee, B. (2001). Evidence for yellow light Mitchell, C. A., Dzakovich, M. P., Gomez, C., Lopez, R., Burr, J. F., Hernández, suppression of lettuce growth. Photochem. Photobiol. 73:208. doi: 10.1562/0031- R., et al. (2015). Light-emitting diodes in horticulture. Hortic. Rev. 43, 1–88. 86552001073
Cammarisano et al.                                                                                                                         Red Lettuce Adaptations to Light

Zhu, X., Long, P. S., and Ort, D. R. (2008). What is the maximum efficiency              Copyright © 2021 Cammarisano, Donnison and Robson. This is an open-access
  with which photosynthesis can convert solar energy into biomass? Curr. Opin.           article distributed under the terms of the Creative Commons Attribution License
  Biotechnol. 19, 153–159. doi: 10.1016/j.copbio.2008.02.004                             (CC BY). The use, distribution or reproduction in other forums is permitted, provided
                                                                                         the original author(s) and the copyright owner(s) are credited and that the original
Conflict of Interest: The authors declare that the research was conducted in the         publication in this journal is cited, in accordance with accepted academic practice.
absence of any commercial or financial relationships that could be construed as a        No use, distribution or reproduction is permitted which does not comply with
potential conflict of interest.                                                          these terms.

Frontiers in Plant Science | www.frontiersin.org                                    10                                           February 2021 | Volume 12 | Article 603411
You can also read