Salt tolerance screening in Limonium sinuatum varieties with different flower colors
←
→
Page content transcription
If your browser does not render page correctly, please read the page content below
www.nature.com/scientificreports
OPEN Salt‑tolerance screening
in Limonium sinuatum varieties
with different flower colors
Xiaojing Xu, Yingli Zhou, Ping Mi, Baoshan Wang* & Fang Yuan*
Limonium sinuatum, a member of Plumbaginaceae commonly known as sea lavender, is widely used
as dried flower. Five L. sinuatum varieties with different flower colors (White, Blue, Pink, Yellow,
and Purple) are found in saline regions and are widely cultivated in gardens. In the current study,
we evaluated the salt tolerance of these varieties under 250 mmol/L NaCl (salt-tolerance threshold)
treatment to identify the optimal variety suitable for planting in saline lands. After the measurement
of the fresh weight (FW), dry weight (DW), contents of Na+, K+, Ca2+, Cl−, malondialdehyde (MDA),
proline, soluble sugars, hydrogen peroxide (H2O2), relative water content, chlorophyll contents, net
photosynthetic rate, and osmotic potential of whole plants, the salt-tolerance ability from strongest
to weakest is identified as Pink, Yellow, Purple, White, and Blue. Photosynthetic rate was the most
reliable and positive indicator of salt tolerance. The density of salt glands showed the greatest
increase in Pink under NaCl treatment, indicating that Pink adapts to high-salt levels by enhancing salt
gland formation. These results provide a theoretical basis for the large-scale planting of L. sinuatum in
saline soils in the future.
Limonium sinuatum L., a native Mediterranean plant, is widely distributed in Northern Africa, western Asia,
and Europe1. L. sinuatum, a member of the Plumbaginaceae family, is a typical recretohalophyte that can grow
in saline2 or drought environments due to the presence of salt glands in the epidermis and the surrounding thick
cuticle to reduce the water e vaporation3. Different L. sinuatum varieties are usually identified based on flower
color. The flower petals are white, while the calyxes can be different colored (e.g., white, blue, pink, yellow, and
purple)4. The calyxes remain long after the petals have disappeared, making the flowers attractive for long periods
of time and excellent for use as fresh cut flowers or in dried a rrangements5. The flower stems are approximately
40–50 cm tall, each flower stem has 2–3 branches with 5–6 flowers clustered together, and the diameter of each
flower is ~ 0.5 cm6. L. sinuatum is commonly referred to as statice, sea lavender, sea n otchleaf7, or wavyleaf sea
lavender when used for gardening or floral arrangements7. Moreover, the entire plant is used as a traditional
Chinese medicine for h emostasis8. In China, L. sinuatum is widely distributed along the coast of the Yellow Sea
and the Bohai S ea9.
Soil salinization is a major environmental factor affecting plant growth and d evelopment10. Plant salt toler-
ance is a highly complex trait involving many factors, such as tissue and organ structure and physiological and
biochemical reactions11. Salt stress alters the contents of soluble sugars, ions, and proline in p
lants12, and it affects
the synthesis of plant soluble substances13, leading to changes in salt tolerance14.
Most crops are non-halophytes, and their growth is inhibited in saline soil15. By contrast, halophytes, including
euhalophytes, recretohalophytes, and psudohalophytes16, can grow and complete their lifecycles in the presence
of ≥ 200 mmol/L NaCl17. L. sinuatum is a recretohalophyte with salt glands for excreting excess N a+ out of the
plants to avoid salt stress. To date, 67 species with salt glands have been reported, belonging to 13 f amilies18.
Among Plumbaginaceae family members, many studies have been carried out on L. bicolor, including salt secre-
tion measurements19, analysis of salt gland d ifferentiation20, and transcriptomic analysis during leaf development
and in response to NaCl treatment16. However, although L. sinuatum also belongs to Limonium, few studies of
the salt resistance in different varieties of this plant have been reported.
Generally, L. sinuatum has greater potential than L. bicolor for use as a horticultural crop in saline s oils20,
because the growth cycle of L. sinuatum is short (do not need vernalization for flowering) and the flower color is
various, and it is more suitable for g ardening21. Given that Limonium species are considered to be pioneer plants
for transforming saline s oils22, it is important to explore the use of these plants to maximize the utilization of
saline lands to increase the economic and ecological value of these environments. Here, we selected five common
Shandong Provincial Key Laboratory of Plant Stress, College of Life Sciences, Shandong Normal University, Ji’nan,
Shandong, People’s Republic of China. *email: bswang@sdnu.edu.cn; yuanfang@sdnu.edu.cn
Scientific Reports | (2021) 11:14562 | https://doi.org/10.1038/s41598-021-93974-3 1
Vol.:(0123456789)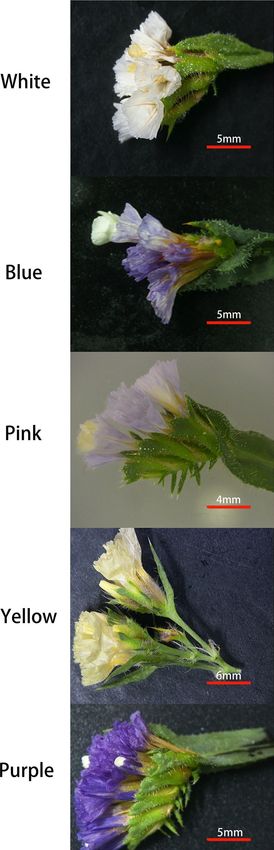
www.nature.com/scientificreports/
garden varieties of L. bicolor (named based on flower color), including White, Blue, Pink, Yellow, and Purple, and
determined their salt-tolerance thresholds. We evaluated the salt tolerance of these varieties by comparing fresh
weight, dry weight, ion, proline, soluble sugars, and chlorophyll content, net photosynthetic rate, and osmotic
potential to identify the varieties with the strongest salt tolerance. Based on these salt-tolerance indicators, we
identified the most suitable variety for planting in saline soil.
Materials and methods
Plant materials and growth conditions. The seeds of five Limonium sinuatum varieties with different
flower colors (White, Blue, Pink, Yellow, and Purple) were purchased from Lanxiang Horticulture Seedling Co.,
Ltd. (China). This study complies with local and national regulations. The author Baoshan Wang had formally
identified L. sinuatum, and the seeds harvesting process is in full compliance with relevant government guide-
lines. Unfortunately, we were unable to find a voucher specimen of L. sinuatum stored in any publicly available
herbarium. The dried seeds were stored in a refrigerator at < 4 °C. The seeds were sterilized in 6% NaClO for
15 min, washed with sterile distilled water, and sown in nutrient soil (soil: vermiculite: perlite, 3: 1: 1). The plants
were grown in a growth chamber at 28 °C/23 °C (day/night) under 600 μmol/m2/s full-spectrum light (15 h
photoperiod) and 60% relative humidity. In order to make accurate comparisons among the five varieties, all
plants were cultured for six months under the above conditions for flowering (Fig. 1). Flower color can be used
to distinguish among different varieties of L. sinuatum, including White, Blue, Pink, Yellow, and Purple.
Measurement of salt‑tolerance threshold. To determine the salt-tolerance threshold, two-week-old
seedlings with two expanded leaves were treated with different concentrations of NaCl (0, 100, 200, 300 and
400 mmol/L). After two weeks of treatment, the aerial parts of the plants were collected and used to measure
fresh weight (FW) and dry weight (DW) according to Huang et al.23. Five replicates were performed per variety,
and the means among different varieties under each NaCl treatment were used to calculate the salt-tolerance
threshold. In detail, a fit regression curve was established with different NaCl concentrations vs. FW or DW. The
NaCl concentration at which the plants showed 50% FW or D W24 compared to the non-NaCl treatment group
was considered to be the salt-tolerance threshold.
After the determination of salt-tolerance threshold, two-week-old seedlings of the five varieties with two
expanded leaves were then re-treated with 0 mmol/L and 250 mmol/L NaCl (considered to be the salt-tolerance
threshold in the following experiments) for two weeks and used to measure the physiological indicators.
Determination of physiological indicators. Determination of FW, DW and relative water content of
leaf.. After cleaning the leaves with 10 mM calcium chloride solution25 followed by deionized water, FW of the
leaves was measured immediately and DW was obtained following incubation at 105 °C for 15 min and drying
to constant weight at 70 °C for 2 days23. Five replicates were performed per variety and treatment. The reduction
rate was calculated as (FW under control condition—FW under saline condition)/FW under control condi-
tion × 100%. The same method was processed in calculating the reduction rate of DW. The relative water content
is calculated as (FW-DW)/FW × 100%26.
Determination of sodium ion ( Na+), potassium ion ( K+), calcium ion ( Ca2+), and chloride ion ( Cl−) contents.. The
ion contents in the samples were measured according to Higinbotham27. In brief, leaf tissue (0.5 g FW) was col-
lected from plants under both 0 and 250 mmol/L NaCl treatment for all five varieties. The tissues were ashed,
dissolved in HNO3, and the contents of Na+, K+, and C
a2+ measured using a Flame photometer (FP6440, Yuanxi,
Shanghai, China). C l− content was measured by ion chromatography according to W ang28. Briefly, after boiling
for 30 min and filtering through a 0.22 μm filter membrane, the ion solution was injected into an ion chromato-
graph (ICS-90A, ThermoFisher, Massachusetts, USA) to measure C l− contents. The ion concentration is shown
as mmol/g FW. Five replicates were performed for each variety and treatment. Given that Na+ content increased
under NaCl treatment, the increase rate was calculated as (Na+ content under saline condition—Na+ content of
control)/Na+ content of control × 100%. The same calculation method was applied in the increase rate of C l−.
Determination of proline content, osmotic potential, malondialdehyde (MDA), hydrogen peroxide (H2O2), soluble
sugars, and chlorophyll content, and photosynthetic rate.. Proline content was determined in accordance with
Demiral29. The plant tissue was ground, and ground tissue (0.5 g FW) was added to 10 mL of 5% acetic acid and
40 mL of distilled water. After filtering, the filtrate (8 mL) was mixed with 0.8 g zeolite with shaking for 5 min
and centrifuged for 10 min (1500 g). The supernatant (3 mL) was combined with glacial acetic acid (3 mL) and
ninhydrin reagent (3 mL) and boiled for 1 h. Benzene (3 mL) was used for static layering, and the upper colored
liquid was collected and used to measure optical density at 515 nm. The proline content was calculated from
a standard curve based on the optical density. Five replicates were performed for each variety and treatment.
The osmotic potential was measured as described by Tomlinson30. Fresh leaf tissue (0.5 g) was cut into small
pieces, frozen in liquid nitrogen, and placed into a syringe to squeeze out and collect the cell sap. A freezing
point osmometer (SMC 30C-1, Tianhe, Tianjin, China) was used to measure the osmotic potential of the plant
cell sap. The formula used to calculate osmotic potential is − iCRT (R = 0.0083143 L Mpa M ol−1 K−1, T = 298 K).
Five replicates were performed for each variety and treatment.
The MDA content was determined as reported in H ong31. Leaf tissue (0.5 g) was collected and homogenized
in 5 mL 0.1% TCA. The homogenate was transferred to the test tube, combined with 5 mL 0.5% thiobarbituric
acid solution, and boiled for 10 min. The sample was centrifuged at 1500 g for 15 min, and the optical density
of the supernatant was measured at 532 nm and 600 nm. MDA content (mmol/g FW) = ΔAN/155 W, ΔA is the
difference between A 532 and A 600; N is the total volume of the supernatant; 155 is the absorption coefficient of
Scientific Reports | (2021) 11:14562 | https://doi.org/10.1038/s41598-021-93974-3 2
Vol:.(1234567890)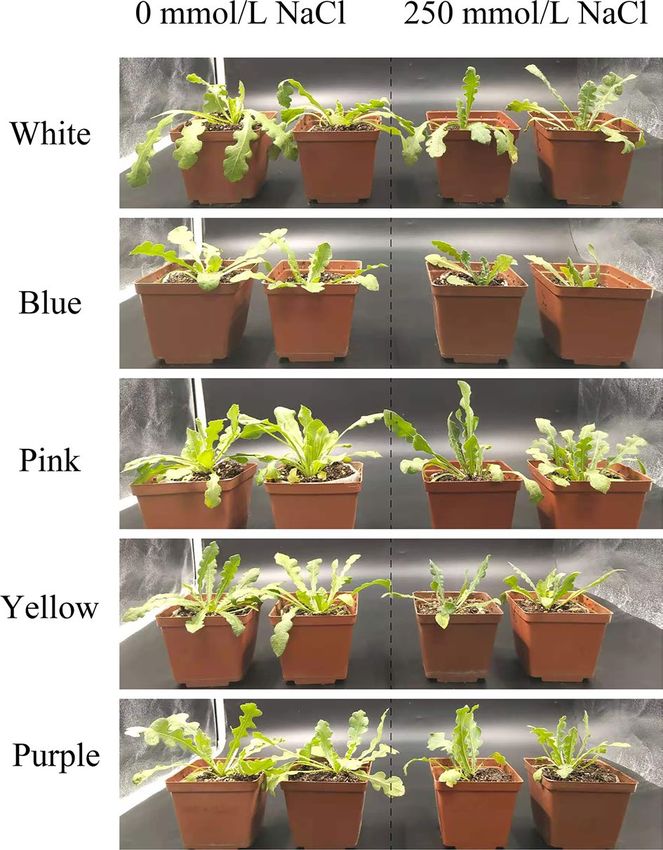
www.nature.com/scientificreports/
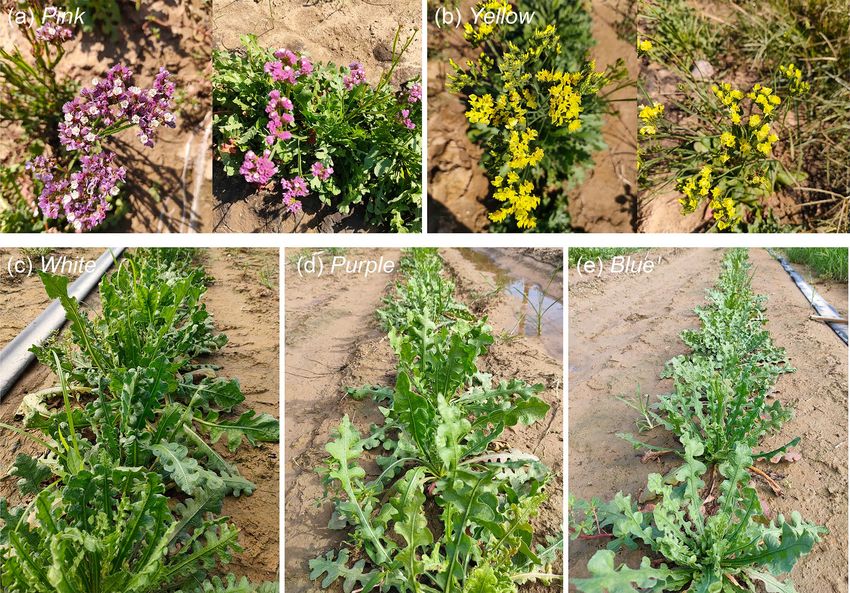
Figure 1. Flower color in different varieties of Limonium sinuatum after 6 months of growth. The photographs
show flowers from the White, Blue, Pink, Yellow, and Purple varieties. Different colors indicates the calyx’s colors.
1 mmol reaction product at 532 nm; W is the fresh weight of the plant material (g). Five replicates were performed
for each variety and treatment.
The content of H
2O2 was determined as described by V ergara32. In brief, fresh leaves (0.3 g) was grinded in
5 mL precooled acetone before centrifuged at 500 g for 8 min. Afterward the supernatant (1 mL) was mixed with
Scientific Reports | (2021) 11:14562 | https://doi.org/10.1038/s41598-021-93974-3 3
Vol.:(0123456789)
www.nature.com/scientificreports/
Figure 2. Salt-tolerance thresholds of five varieties of Limonium sinuatum. A 50% reduction in biomass
compared to the control was used as the standard to determine the salt-tolerance threshold. (a) Changes in fresh
weight (FW) of the leaves of five L. sinuatum varieties under different salt treatments. (b) Changes in dry weight
(DW) of the leaves of five L. sinuatum varieties under different salt treatments.
ammonia (0.2 mL) and 20% T iCl4 (0.1 mL) for 2 min, the precipitate was washed with acetone for 3–5 times and
dissolved in 2 M H2SO4 (5 mL) after centrifuged at 600 g for 7 min. Then the content of H2O2 was measured at
415 nm and calculated as H2O2 content (μmol/g FW) = CVT/FWV1, C is the concentration of H2O2 in the sample
checked on the standard curve (μmol), VT was the total volume of sample extract (mL), V 1 was the volume of
sample extract (mL), and FW was the fresh weight of plant tissue (g). Five replicates were performed for each
variety and treatment.
Soluble sugars were measured following the protocol of P rado33. Fresh leaf tissue (0.3 g) was dissolved in
10 mL of double distilled H2O (ddH2O) in a boiling water bath for 50 min, filtered, and brought to a volume of
25 mL. Afterward 0.5 mL of extract solution was combined with 1.5 mL distilled water, 0.5 mL ethyl anthrone
acetate, and 5 mL concentrated sulfuric acid, shaken thoroughly, boiled in water bath for 1 min, and cooled.
The optical density of the solution was measured at 630 nm. The soluble sugars content was calculated from a
standard curve. Five replicates were performed for each variety and treatment.
Chlorophyll levels were determined referring to Maxwell34. Leaf tissue (0.3 g) was combined with 5 mL
dimethyl sulfoxide in 5 mL 80% acetone and incubated in a 65°C water bath at 24 h (protected from the light)
to fully decolorize. Afterward bring to 25 mL after filtration and the solution was used to measure the optical
density at 663 nm, 645 nm, and 470 nm. Chlorophyll content (mg g −1 or mg dm−2) = CV/1000A, C is chlorophyll
concentration (mg L −1 or mg dm−2); V is the total volume of extract solution (mL); A is fresh weight of the sam-
ple (g) or sampling area ( dm−2). The pigment concentration (mg/L) was calculated as C a = 12.7A663 − 2.69A645;
Cb = 22.9A645 − 4.68A663; Ctotal = 20.0A645 + 8.02A663; CXC = (1000A470 − 3.27Ca − 104Cb)/229; Ca, Cb are the con-
centrations of chlorophyll a and b, Ctotal is the concentration of total chlorophyll; C XC is the total concentration
of carotenoids. Five replicates were performed for each variety and treatment.
The photosynthetic rate was measured on the basis of W ang35. In this experiment, a photosynthetic instru-
ment (LI-6400XT, LI-COR, Nebraska, USA) was used to measure the photosynthetic parameters of leaves. The
photosynthetic effective quantum density, UPAR (μmol m−1 s−1), μ is 4.5536, was measured at a temperature of
23°C, and the leaf area of each cultivar was 1 cm2. Five replicates were performed for each variety and treatment.
Determination of salt gland density in different varieties. The density of salt glands was measured
according to Yuan37. The leaves were fixed in a mixture of ethanol and acetic acid (3:1; v/v), rinsed with 70%
ethanol to decolorize, and cleared in Hoyer’s solution. Afterward cleaned leaves were fixed on a glass slide for
DIC microscopy (ECLIPSE 80i, Nikon, Tokyo, Japan). The salt gland density was calculated according to D ing38
and expressed as number per mm2. Five replicates were performed for each variety and treatment.
Data analysis
Statistical analysis and correlation were performed using SPSS 13.0 software (SPSS Software Inc., USA). The
results were subjected to a one-way analysis of variance (ANOVA), and Duncan’s test was used to determine
significant differences between the means (P = 0.05). In the figures, the error bars represent the means ± stand-
ard deviations (n = 5) and different letters indicate significant differences at P = 0.05. Correlation is processed
at P = 0.05 and 0.01 using Pearson correlation analysis. The figures were generated using SigmaPlot 12.5 (Systat
Software, Chicago, IL, USA).
Results
Identification of the salt‑tolerance threshold. Plant biomass is an important measure of salt toler-
ance. Figure 2 shows the biomass of the aerial parts of plants under a gradient of different NaCl concentrations
(0, 100, 200, 300, and 400 mmol/L) after 2 weeks of treatment. FW and DW were measured in the five varieties
of L. sinuatum seedlings and constructed a regression curve based on the means of five data under different
treatments as independent variables. Most studies use the salt concentration at which plant growth or biomass
decreases by 50% of the control value as the salt-tolerance threshold39. Here, when the FW and DW of the
Scientific Reports | (2021) 11:14562 | https://doi.org/10.1038/s41598-021-93974-3 4
Vol:.(1234567890)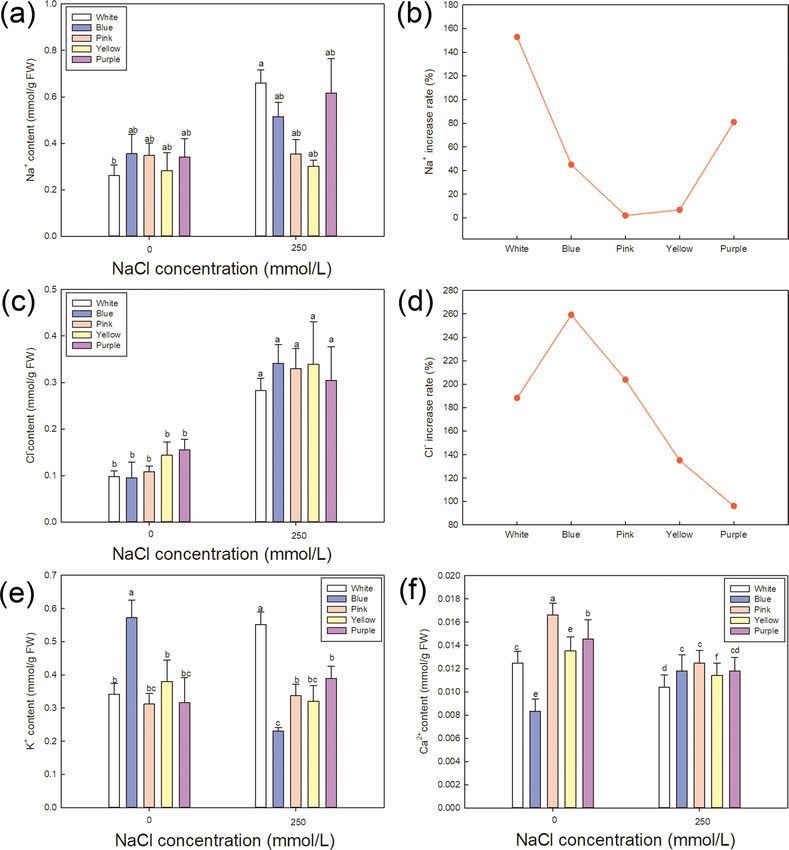
www.nature.com/scientificreports/
Figure 3. Growth of five varieties of Limonium sinuatum seedlings after two weeks of salt treatment.
upper parts of the seedlings were reduced by 50% of the non-NaCl treatment value, different varieties showed
different salt-tolerance thresholds. The highest threshold was obtained for Pink (250 mmol/L) (Supplementary
Fig. 1), suggesting that Pink is the most salt-tolerant variety. To identify the optimal salt concentration for further
experiments, we calculated the average salt-tolerance threshold, i.e., 228 mmol/L for FW and 233 mmol/L for
DW (Fig. 2). Therefore, a salt-tolerance threshold of 250 mmol/L was utilized in subsequent experiments.
Pink shows the best growth under 250 mmol/L NaCl treatment. All varieties showed inhibited
growth under 250 mmol/L NaCl treatment (Fig. 3), but the changes in FW and DW showed no significant trends
among varieties (Supplementary Fig. 2). In order to make effective comparison among different varieties, FW
and DW reduction rate are calculated to compare the changes between control and saline condition (Fig. 4). Pink
showed the least FW reduction, followed by Yellow, Purple, White and Blue, while White has the least DW reduc-
tion, afterward Pink, Yellow, Purple and Blue. Based on the reduction rate of FW and DW, Pink is considered
the most salt tolerance variety, followed by Yellow, Purple, White, and Blue. Biomass can be used as a measure of
plant growth, and various physiological processes could be responsible for the ability of Pink to maintain growth
in the presence of salt. Therefore, we measured the physiological indicators of the different varieties under NaCl
treatment in order to reveal the underlying salt-tolerance mechanisms.
Effect of NaCl treatment on different physiological indicators in five varieties. Comparisons
of the N a+, K+, Ca2+, and Cl− contents; MDA, soluble sugars, proline contents, H2O2 content and relative water
content of leaf; chlorophyll contents; and osmotic potential and photosynthetic rate are shown in Figs. 5, 6, 7 and
8, respectively. Each variety showed significant changes under NaCl treatment.
Figure 5 shows a comparison of the relative Na+, K+, Ca2+ and Cl− contents among varieties under 250 mmol/L
NaCl treatment. N a+ and Cl− content under NaCl treatment increased compared with the control in all varie-
ties (Fig. 5a,c), while K + and Ca2+ showed various trends in different varieties (Fig. 5e,f). Given that N a+ and
−
Cl are considered the stress ion to protoplast and different varieties have various basal level under control, the
increase rate of N a+ (Fig. 5b) and C l− (Fig. 5d) under NaCl treatment are calculated in each variety in order to
make intuitive comparison among different varieties. Pink shows the least N a+ increase (1.87%) under saline
condition, followed by Yellow, Blue, Purple and White. In the aspect of Cl− increase, Purple (96.04%) has the least,
afterward Yellow, Pink, White and Blue. Together with the increase rate of N a+ and Cl−, these results indicate that
Pink accumulates less Na+ and Cl− than the other varieties under high-salt conditions, which should lead to less
injury than the other varieties.
Figure 6 shows a comparison of the relative MDA, soluble sugars, proline contents, H 2O2 and relative water
content of leaf among varieties. Though the MDA increase rate of Pink under saline condition (Fig. 6b) shows
the most, the absolute value of MDA (Fig. 6a) is the least accumulation in Pink, indicating that Pink suffered the
Scientific Reports | (2021) 11:14562 | https://doi.org/10.1038/s41598-021-93974-3 5
Vol.:(0123456789)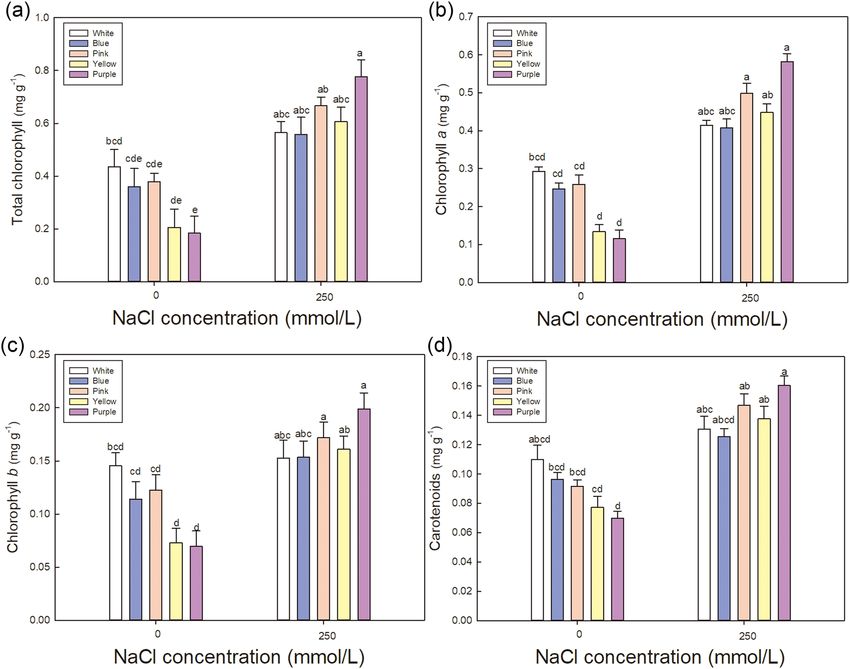
www.nature.com/scientificreports/
Figure 4. Effect of NaCl stress on the reduction rate of fresh weight (FW) and dry weight (DW) of the leaves of
five Limonium sinuatum varieties. The reduction rate was calculated as (FW or DW under control condition −
FW or DW under saline condition)/FW or DW under control condition × 100%.
least amount of damage under salt treatment, as MDA can be used as a measure of the degree of damage under
NaCl treatment40. High accumulation of MDA can be detected in White and Blue (Fig. 6a), which may explain
the serious damage level.
To cope with the damage caused by NaCl treatment, cells usually accumulate organic osmotic regulating
substance such as soluble sugars (Fig. 6c) and proline (Fig. 6e). High accumulation of soluble sugars is shown
in Pink and Purple, and the increase rate (Fig. 6d) under saline treatment indicates the comparison between
varieties. Highest increase rate is detected in Purple, followed by Pink and Yellow. Besides, high proline accumula-
tion is shown in Blue, Yellow and Pink in descending order of actual value (Fig. 6e), while the increase rate has
the opposite trend with the most in White, Blue and Pink (Fig. 6f). Proline reduces the osmotic potential in the
cell41, allowing it to resist external osmotic stress, thereby improving plant survival in adverse environments29.
Proline content depends on the catabolism of s ugar42.Combined the absolute value and the increase rate, Pink
is considered to accumulate a large amounts of soluble sugars and proline to improve the osmotic adjustment
ability under salt treatment. The large accumulation of osmoregulation substances can effectively reduce the
osmotic potential under NaCl t reatment43. Figure 8 (a) shows that the osmotic potential decline markedly in all
varieties, and Yellow and Pink have the most reduction rate (Fig. 8b).
Moreover, H2O2, as a kind of superoxide, can cause oxidative stress to plants under various stresses44. In
Fig. 6g, under salt stress, the lowest H 2O2 generation is detected in Pink, while higher in White and Purple, which
indicates that Pink suffers the least oxidative stress under salt treatment and is more suitable for saline environ-
ment. In addition, relative water content is also measured (Fig. 6h) and no significant difference is detected among
different varieties, indicating that all varieties of L. sinuatum can keep normal moisture condition to cope with
physiological drought of N aCl45.
Plants always produce large amounts of pigments under saline environment to maintain normal photosyn-
thetic efficiency. In addition, a positive correlation was detected between chlorophyll content and net photo-
synthetic rate46. Figure 7 shows a comparison of the relative chlorophyll content among varieties. In order to
show the changes in pigment content in more detail, the changes in total chlorophyll, chlorophyll a, chlorophyll
b, and carotenoid contents are shown. The pigment contents of the Pink and Purple varieties were high, which
help improve the photosynthetic rate. Under NaCl treatment, net photosynthetic rate is obviously inhibited in all
varieties (Fig. 8c). Pink shows the highest under saline condition, and the reduction rate under salt treatment is
also the lowest in Pink (Fig. 8d). These results further explain why Pink has the highest biomass under NaCl treat-
ment, which may be due to high accumulation in osmoregulation substance and high photosynthetic efficiency.
Effects of NaCl on salt gland density of five varieties of Limonium sinuatum. Salt glands are
structures for salt secretion that are specifically produced by r ecretohalophytes47. We therefore performed statis-
tical analysis of the salt gland densities of expanded leaves of the five L. sinuatum varieties under NaCl treatment.
Figure 9a shows the changes in salt gland density in the leaves of the five varieties of L. sinuatum under salt
stress (images shown in Supplementary Fig. 3). Salt gland density increased in all varieties under NaCl treatment
compared to the control. The density of salt glands in Pink increased by 225.86% (Fig. 9b), while in Purple only
7%. The increased salt gland can help the plants to excrete more Na+ outsides in order to further decrease the
Na+ accumulation in vivo.
Finally, given that Pink showed the greatest tolerance to NaCl treatment, in order to verify the optimal variety
suitable for growing in field, we examined flowering in the five varieties grown in Yellow River Delta (salt content:
0.2%). After six months of growth, only Pink and Yellow plants flowered consistently, whereas the three other
varieties rarely flowered and only showed vegetative growth (Fig. 10). These results suggest that Pink and Yellow
Scientific Reports | (2021) 11:14562 | https://doi.org/10.1038/s41598-021-93974-3 6
Vol:.(1234567890)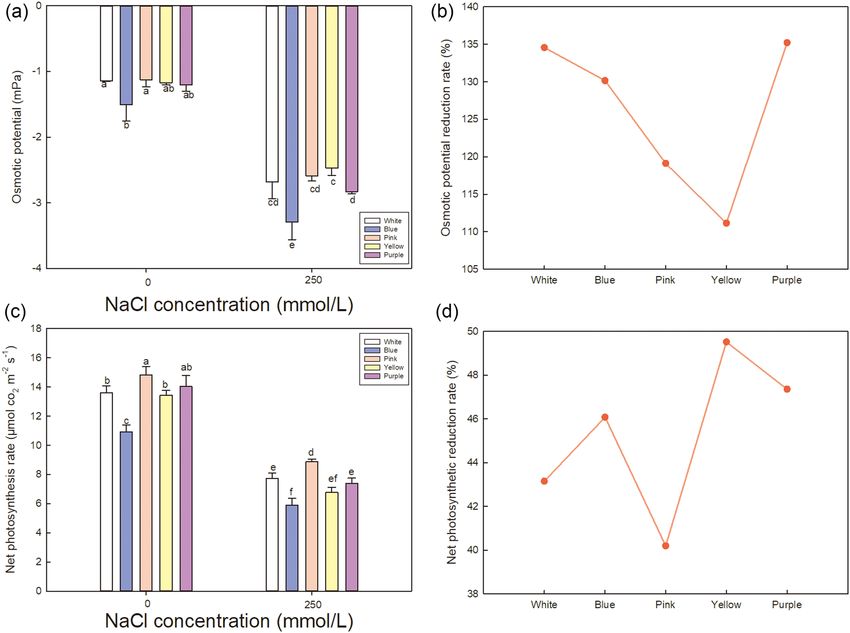
www.nature.com/scientificreports/
Figure 5. Effect of NaCl treatment on N a+, K+, Ca2+, and Cl− contents. Contents of N
a+ (a), Cl− (c), K+ (e) and
2+
Ca (f) under control and NaCl treatment in different varieties. The data are means ± SD of five replicates.
Different letters indicate significant differences between two groups at P = 0.05 using Duncan’s test with SPSS. (b,
d) The increase rate of Na+ and C l− under NaCl treatment in five varieties, which was calculated as (ion contents
under NaCl treatment—ion contents under control)/ion contents under control × 100%.
are the optimal varieties for the development of saline horticulture and further planting in saline soil, which is
consistence with the formal results in laboratory conditions.
Discussion
L. sinuatum is a pioneer plant that could be used for the improvement of saline lands due to the high salt resist-
ance and various c olors48. Therefore, it is important to identify the best salt-tolerant varieties for cultivation
in these areas. In the current study, Pink showed the highest biomass and the strongest salt resistance among
the five varieties examined. Our analysis of physiological indicators including Na+, K+, Ca2+, and Cl− contents;
MDA, soluble sugars, proline contents, H2O2 content, relative water content and chlorophyll contents, osmotic
Scientific Reports | (2021) 11:14562 | https://doi.org/10.1038/s41598-021-93974-3 7
Vol.:(0123456789)
www.nature.com/scientificreports/
Figure 6. Effect of NaCl stress on MDA, soluble sugars, proline contents, H 2O2 and relative water content in
the leaves of five varieties of Limonium sinuatum. Contents of MDA (a), soluble sugars (c), proline (e), H2O2
(g) and relative water content (h) of leaves under control and NaCl treatment in different varieties. The data
are means ± SD of five replicates. Different letters indicate significant differences between two groups at P = 0.05
using Duncan’s test with SPSS. The increase rate of MDA (b), soluble sugars (d) and proline (f) are calculated
using (value under NaCl treatment—value under control)/value under control × 100%.
Scientific Reports | (2021) 11:14562 | https://doi.org/10.1038/s41598-021-93974-3 8
Vol:.(1234567890)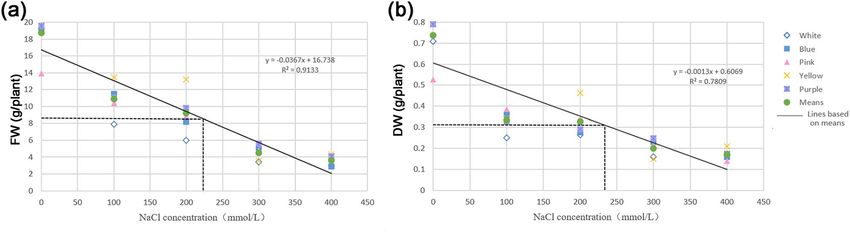
www.nature.com/scientificreports/
Figure 7. Effect of NaCl treatment on chlorophyll contents in the leaves of five varieties of Limonium sinuatum.
(a–d) Total chlorophyll, chlorophyll a, chlorophyll b, and carotenoid contents under control and NaCl
treatment. The data are means ± SD of five replicates. Different letters indicate significant differences between
two groups at P = 0.05 using Duncan’s test with SPSS.
potential, photosynthetic rate, and salt gland density under 250 mmol/L NaCl (salt-tolerance threshold) treat-
ment explained why Pink has the greatest salt tolerance. Moreover, analysis of plants grown in the field (Fig. 10)
confirmed the superior salt resistance of Pink. Pink is recommended as the optimal varieties for extensive planting
and greening in saline soil, followed by Yellow.
Plant biomass is an important indicator of salt tolerance43: the greater the increase in biomass under salt stress,
the higher the salt tolerance. As shown in Fig. 4, Pink showed the minimal reduction under 250 mmol/L NaCl
treatment, and photosynthetic efficiency of Pink was also the highest among five varieties (Fig. 8), indicating
that Pink suffered the least damage under saline condition. The three basic components of salt stress are usually
considered as ionic toxicity, osmotic stress and oxidative stress49.
How Pink cope with high ionic toxicity? On the one hand, under salt stress, N a+ content increases, which
affects the absorption of K+ and C a2+. K+ plays an important role in the osmotic regulation of cells50. Ca2+
regulates the ionic balance and reduces the absorption of N a+51. In salt-tolerant plants, K
+ efflux is significantly
inhibited under salt stress to maintain high intracellular K +/Na+ levels, thereby reducing the damage from salt
stress52. After salt treatment, the Pink variety had the relatively low N a+ and Cl− contents among the five varie-
ties, whereas K + and C a2+ showed the opposite trend. Therefore, Pink regulates ionic balance under salt stress,
maintaining high K+/Na+ levels, thus showing strong salt tolerance. On the other hand, salt gland is the typical
and specific epidermal structure of r ecetohalophytes53, which can excrete the excessive N a+ out of the plants to
avoid damage54. The most salt gland was induced in Pink under salt treatment (Fig. 9), so it is speculated that
Na+ can be effectively transferred out of the cell to further avoid ionic toxicity.
NaCl can induce the physiological drought due to the osmotic stress. Compatible media was always generated
to deal with the osmotic stress, such as proline and soluble sugars. Proline is an important compatible solute
in plant cells that protects enzymes from inactivation by NaCl and reduces the osmotic potential in the c ells55,
thereby helping plants resist external osmotic stress and tolerate adverse environments29. Sugar content under
stress condition is intricately associated with carbohydrate content of plant25. Though not always the highest
Scientific Reports | (2021) 11:14562 | https://doi.org/10.1038/s41598-021-93974-3 9
Vol.:(0123456789)
www.nature.com/scientificreports/

                                            Figure 8.  Effect of NaCl stress on the osmotic potential and net photosynthetic rate in the leaves of five varieties
                                            of Limonium sinuatum. (a, c) Osmotic potential and net photosynthetic rate under control and NaCl treatment.
                                            The data are means ± SD of five replicates. Different letters indicate significant differences between two groups
                                            at P = 0.05 using Duncan’s with SPSS. (b, d) The reduction rate of osmotic potential and net photosynthetic rate
                                            under NaCl treatment. The reduction rate was calculated as (the value under control—the value under NaCl
                                            treatment)/the value under control × 100%.

                                            Figure 9.  Effect of NaCl stress on salt gland density in the leaves of five varieties of Limonium sinuatum. (a)
                                            The data are means ± SD of five replicates. Different letters indicate significant differences between two groups at
                                            P = 0.05 using Duncan’s with SPSS. (b) The increase rate of salt gland density was calculated using (value under
                                            NaCl treatment—value under control)/value under control × 100%.

          Scientific Reports |   (2021) 11:14562 |               https://doi.org/10.1038/s41598-021-93974-3                                                   10

Vol:.(1234567890)
www.nature.com/scientificreports/
Figure 10. Growth of five varieties of Limonium sinuatum in saline soil.
Mean Std. D FW DW Na K Ca Cl MDA Sugar Proline H2O2 RWC Chl Os Pr SG
FW 4.0040 1.55376 1.000
DW 0.3427 0.14626 0.955** 1.000
Na 0.4891 0.14593 − 0.030 0.011 1.000
K 0.3658 0.10977 0.444 0.386 0.579* 1.000
Ca 0.3192 0.05828 − 0.096 0.029 − 0.327 − 0.390 1.000
Cl 0.0116 0.00171 0.120 0.207 − 0.209 − 0.303 0.452 1.000
MDA 0.0202 0.00521 − 0.246 − 0.292 0.587* 0.330 0.046 − 0.046 1.000
Sugar 0.8329 0.15517 0.349 0.365 0.193 0.006 − 0.265 − 0.226 − 0.012 1.000
−
Proline 13.9340 4.86710 − 0.584* − 0.445 − 0.431 0.610* 0.315 0.038 − 0.273 1.000
0.703**
H2O2 22.8932 11.46676 0.003 − 0.004 0.654** 0.791** − 0.437 − 0.497 0.418 0.059 − 0.384 1.000
RWC 0.9145 0.01192 − 0.029 − 0.312 − 0.168 0.020 − 0.282 − 0.134 0.316 − 0.160 − 0.209 − 0.104 1.000
− −
Chl 0.6344 0.14499 0.316 0.431 0.069 − 0.001 − 0.086 0.126 0.200 − 0.230 − 0.031 1.000
0.645** 0.547*
Os − 2.7737 0.34859 − 0.488 − 0.402 0.119 − 0.051 − 0.123 − 0.269 0.201 − 0.041 0.406 0.392 − 0.180 − 0.224 1.000
− −
Pr 7.3313 1.09242 0.674** 0.591* − 0.092 0.447 − 0.223 − 0.101 − 0.332 0.243 0.049 0.023 0.179 1.000
0.644** 0.677**
SG 6.7918 2.46219 − 0.094 − 0.084 − 0.169 − 0.304 0.393 0.224 − 0.330 − 0.456 − 0.004 − 0.496 − 0.059 0.162 − 0.570* 0.147 1.000
Table 1. Correlation analysis between fresh weight (FW) and other 14 indicators including dry weight (DW),
Na+ (Na), K+ (K), Ca2+ (Ca), Cl− (Cl), MDA, soluble sugars (Sugar), proline (Proline), hydrogen peroxide
(H2O2), relative water content (RWC) and chlorophyll contents (Chl), osmotic potential (Os), photosynthetic
rate (Pr), and salt gland density (SG) using Pearson correlation analysis. **Correlation is significant at the 0.01
level (2-tailed). *Correlation is significant at the 0.05 level (2-tailed).
Scientific Reports | (2021) 11:14562 | https://doi.org/10.1038/s41598-021-93974-3 11
Vol.:(0123456789)www.nature.com/scientificreports/
accumulation in proline and soluble sugars, Pink keep the relatively high level of osmotic adjustment substance
to reduce the osmotic potential, which allowed the plant to re-absorb water from the NaCl solution to maintain
normal growth.
Oxidative stress is inevitable induced by salt stress due to the generation of superoxide, with the typical rep-
resentative H2O256. Pink suffered the smallest oxidative stress under salt treatment and is more suitable for saline
environment. MDA content can reflect the degree of membrane damage and the effects of stress on p lants57. The
least accumulation of MDA also insist the opinion that Pink suffered less oxidative stress.
Given that 16 physiological indicators were measured under salt treatment in addition to DW and FW, which
one is most closely related to biomass? Correlation analysis was performed between FW and the other 14 indica-
tors. As shown in Table 1, photosynthetic rate showed the strongest positive correlation with salt resistance in
L. sinuatum.
Together, the results of our experiments show that the Pink variety has the strongest salt tolerance. Based on
these results, the level of salt tolerance of the five varieties of L. sinuatum from high to low is Pink, Yellow, Purple,
White, and Blue. Further analysis of the performance of these varieties in saline soil also validate the results of
these preliminary experiments. Nonetheless, our findings provide a theoretical basis for the cultivation of L.
sinuatum in saline-alkali areas, which could be widely planted to facilitate the greening and transformation of
saline soils.
Received: 3 February 2021; Accepted: 5 July 2021
References
1. Lledó, M. D. et al. Endemism and evolution in Macaronesian and Mediterranean Limonium taxa. In The Biology of island Floras,
325–337 (2011).
2. Caperta, A. D., Róis, A. S., Teixeira, G., Garcia-Caparros, P. & Flowers, T. J. Secretory structures in plants: Lessons from the Plum-
baginaceae on their origin, evolution and roles in stress tolerance. Plant Cell Environ. 43, 2912–2931 (2020).
3. González-Orenga, S., Grigore, M. N., Boscaiu, M. & Vicente, O. Constitutive and induced salt tolerance mechanisms and potential
uses of Limonium Mill. species. Agronomy 11, 413 (2021).
4. Grieve, C. et al. Productivity and mineral nutrition of Limonium species irrigated with saline wastewaters. HortScience 40, 654–658
(2005).
5. Akat, H., Saracoglu, O. & Cakar, H. Yield response of Limonium sinuatum cultivars under salinity stress. J. Environ. Biol. 41,
302–309 (2020).
6. Sheikh-Assadi, M., Khandan-Mirkohi, A., Alemardan, A. & Moreno-Jiménez, E. Mycorrhizal Limonium sinuatum (L.) mill.
enhances accumulation of lead and cadmium. Int. J. Phytoremed. 17, 556–562 (2015).
7. Ibrahim, H. E., El-Fadaly, H. & El-Naggar, A. Study on the response of Statice plants (Limonium sinuatum, L.) to humic acid
application. Alex. Sci. Exchange J. 37, 515–528 (2016).
8. Yan, W., Xiao, Y. J., Lin, Y. & Chen, B. H. Study of Limonium sinense polyphenols inducing apoptosis in HL-60 human leukemia
cells. J. Fujian Normal Univ. (Natural Science Edition) 02, 119–124 (2014).
9. Zhang, S. et al. Salinity influences Cd accumulation and distribution characteristics in two contrasting halophytes, Suaeda glauca
and Limonium aureum. Ecotoxicol. Environ. Saf. 191, 110230 (2020).
10. Shrivastava, P. & Kumar, R. Soil salinity: A serious environmental issue and plant growth promoting bacteria as one of the tools
for its alleviation. Saudi J. Biol. Sci. 22, 123–131 (2015).
11. Ashraf, M., Akram, N., Arteca, R. N. & Foolad, M. R. The physiological, biochemical and molecular roles of brassinosteroids and
salicylic acid in plant processes and salt tolerance. Crit. Rev. Plant Sci. 29, 162–190 (2010).
12. Agami, R. Applications of ascorbic acid or proline increase resistance to salt stress in barley seedlings. Biol. Plant. 58, 341–347
(2014).
13. Amini, F. & Ehsanpour, A. A. Soluble proteins, proline, carbohydrates and N a+/K+ changes in two tomato (Lycopersicon esculentum
Mill.) cultivars under in vitro salt stress. Am. J. Biochem. Biotechnol. 1, 204–208 (2005).
14. Parvaiz, A. & Satyawati, S. Salt stress and phyto-biochemical responses of plants—a review. Plant Soil Environ. 54, 89 (2008).
15. Aslamsup, R., Bostansup, N., Mariasup, M. & Safdar, W. A critical review on halophytes: Salt tolerant plants. J. Med. Plants Res. 5,
7108–7118 (2011).
16. Yuan, F., Lyu, M. J. A., Leng, B. Y., Zhu, X. G. & Wang, B. S. The transcriptome of NaCl-treated Limonium bicolor leaves reveals
the genes controlling salt secretion of salt gland. Plant Mol. Biol. 91, 241–256 (2016).
17. Yang, X., Dong, M. & Huang, Z. Role of mucilage in the germination of Artemisia sphaerocephala (Asteraceae) achenes exposed
to osmotic stress and salinity. Plant Physiol. Biochem. 48, 131–135 (2010).
18. Yuan, F., Guo, J., Shabala, S. & Wang, B. Reproductive physiology of halophytes: Current standing. Front. Plant Sci. 9, 1954 (2019).
19. Feng, Z. T. et al. K+ accumulation in the cytoplasm and nucleus of the salt gland cells of Limonium bicolor accompanies increased
rates of salt secretion under NaCl treatment using NanoSIMS. Plant Sci. 238, 286–296 (2015).
20. Yuan, F. et al. Comparative transcriptome analysis of developmental stages of the Limonium bicolor leaf generates insights into salt
gland differentiation. Plant Cell Environ. 38, 1637–1657 (2015).
21. Mi, P., Yuan, F., Guo, J., Han, G. & Wang, B. Salt glands play a pivotal role in the salt resistance of four recretohalophyte Limonium
Mill. species. Plant Biol https://doi.org/10.1111/plb.13284 (2021).
22. Lu, C. et al. The SNARE protein LbSYP61 participates in salt secretion in Limonium bicolor. Environ. Exper. Bot. 176, 104076
(2020).
23. Huang, W. et al. Leaf fresh weight versus dry weight: Which is better for describing the scaling relationship between leaf biomass
and leaf area for broad-leaved plants?. Forests 10, 256 (2019).
24. Wang, D., Yuan, F., Wang, B. & Chen, M. Response of plant biofuel hybrid Pennisetum to NaCl stress and its salinity threshold.
Chin. J. Plant Ecol. 36, 572–577 (2012).
25. Rahman, M. M. et al. Acetic acid: A cost-effective agent for mitigation of seawater-induced salt toxicity in mung bean. Sci. Rep. 9,
1–15 (2019).
26. Roger, R. & Manuel, J. Handbook of Plant Ecophysiology Techniques. Gas Exchange Techniques in Photosynthesis and Respiration
Infrared Gas Analyser 113–139. (2003).
27. Higinbotham, N., Etherton, B. & Foster, R. Mineral ion contents and cell transmembrane electropotentials of pea and oat seedling
tissue. Plant Physiol. 42, 37–46 (1967).
Scientific Reports | (2021) 11:14562 | https://doi.org/10.1038/s41598-021-93974-3 12
Vol:.(1234567890)www.nature.com/scientificreports/
28. Wang, Y. F., Tseng, Y. C., Yan, J. J., Hiroi, J. & Hwang, P. P. Role of SLC12A10. 2, a Na-Cl cotransporter-like protein, in a Cl uptake
mechanism in zebrafish (Danio rerio). Am. J. Physiol. Regul. Integr. Comp. Physiol. 319, R82–R86 (2009).
29. Demiral, T. & Türkan, I. Comparative lipid peroxidation, antioxidant defense systems and proline content in roots of two rice
cultivars differing in salt tolerance. Environ. Exp. Bot. 53, 247–257 (2005).
30. Tomlinson, A., McCann, L. C. & Pearce, E. I. Comparison of human tear film osmolarity measured by electrical impedance and
freezing point depression techniques. Cornea 29, 1036–1041 (2010).
31. HongBo, S., ZongSuo, L. & MingAn, S. Changes of anti-oxidative enzymes and MDA content under soil water deficits among 10
wheat (Triticum aestivum L.) genotypes at maturation stage. Colloids Surfaces B Biointerfaces 45, 7–13 (2005).
32. Vergara, R., Parada, F., Rubio, S. & Pérez, F. J. Hypoxia induces H 2O2 production and activates antioxidant defence system in
grapevine buds through mediation of H2O2 and ethylene. J. Exp. Bot. 63, 4123–4131 (2012).
33. Prado, F. E., Boero, C., Gallardo, M. R. A. & González, J. A. Effect of NaCl on growth germination and soluble sugars content in
Chenopodium quinoa Willd. seeds. Bot. Bull. Acad. Sinica 41, 27–34 (2000).
34. Maxwell, K. & Johnson, G. N. Chlorophyll fluorescence—a practical guide. J. Exp. Bot. 51, 659–668 (2000).
35. Wang, W. J. et al. Effect of collar insertion on soil respiration in a larch forest measured with a LI-6400 soil CO2 flux system. J. For.
Res. 10, 57–60 (2005).
36. Zhang, X., Zhang, Y. & Zhoub, Y. Measuring and modelling photosynthetically active radiation in Tibet Plateau during April–
October. Agric. For. Meteorol. 102, 207–212 (2000).
37. Yuan, F., Chen, M., Leng, B. & Wang, B. An efficient autofluorescence method for screening Limonium bicolor mutants for abnormal
salt gland density and salt secretion. S. Afr. J. Bot. 88, 110–117 (2013).
38. Ding, F., Chen, M., Sui, N. & Wang, B. S. Ca2+ significantly enhanced development and salt-secretion rate of salt glands of Limonium
bicolor under NaCl treatment. S. Afr. J. Bot. 76, 95–101 (2010).
39. Lieth, H., Sucre, M. G. & Herzog, B. Tasks for vegetation sciences. In Mangroves and Halophytes: Restoration and Utilisation, Volume
43. Studies on halophytes and salinity problems in Mediterranean agriculture. 25–30 (2008).
40. McKenna, M. J., Bangsbo, J. & Renaud, J. M. Muscle K+, Na+, and Cl− disturbances and Na+-K+ pump inactivation: Implications
for fatigue. J. Appl. Physiol. 104, 288–295 (2008).
41. Gomes, F. P., Oliva, M. A., Mielke, M. S., Almeida, A. A. F. & Aquino, L. A. Osmotic adjustment, proline accumulation and cell
membrane stability in leaves of Cocos nucifera submitted to drought stress. Sci. Hortic. 126, 379–384 (2010).
42. Monreal, J. et al. Proline content of sugar beet storage roots: Response to water deficit and nitrogen fertilization at field conditions.
Environ. Exp. Bot. 60, 257–267 (2007).
43. Agarwal, R., Alborzi, P., Satyan, S. & Light, R. P. Dry-weight reduction in hypertensive hemodialysis patients (DRIP) a randomized,
controlled trial. Hypertension 53, 500–507 (2009).
44. Schützendübel, A., Nikolova, P., Rudolf, C. & Polle, A. Cadmium and H2O2-induced oxidative stress in Populus × canescens roots.
Plant Physiol. Biochem. 40, 577–584 (2002).
45. Ma, C. C., Li, Q. F., Gao, Y. B. & Xin, T. R. Effects of silicon application on drought resistance of cucumber plants. Soil Sci. Plant
Nutr. 50, 623–632 (2004).
46. Buttery, B. & Buzzell, R. The relationship between chlorophyll content and rate of photosynthesis in soybeans. Can. J. Plant Sci.
57, 1–5 (1977).
47. Yuan, F., Leng, B. & Wang, B. Progress in studying salt secretion from the salt glands in recretohalophytes: how do plants secrete
salt?. Front. Plant Sci. 7, 977 (2016).
48. Huari, W. N. & Mera, A. Erratum: Nauray Huari, W. & Galán de Mera, A. Anales del Jardín Botánico de Madrid 65(1): 73–95.
(2008).
49. Yuan, F., Xu, Y., Leng, B. & Wang, B. Beneficial effects of salt on halophyte growth: Morphology, cells, and genes. Open Life Sci. 14,
191–200 (2019).
50. Sutherland, L., Cairney, J., Elmore, M., Booth, I. & Higgins, C. Osmotic regulation of transcription: Induction of the proU betaine
transport gene is dependent on accumulation of intracellular potassium. J. Bacteriol. 168, 805–814 (1986).
51. White, R. J. & Reynolds, I. J. Mitochondria and N a+/Ca2+ exchange buffer glutamate-induced calcium loads in cultured cortical
neurons. J. Neurosci. 15, 1318–1328 (1995).
52. Hniličková, H., Hnilička, F., Orsák, M. & Hejnák, V. Effect of salt stress on growth, electrolyte leakage, Na+ and K+ content in
selected plant species. Plant Soil Environ. 65, 90–96 (2019).
53. Yuan, F. et al. Comparative transcriptome analysis of developmental stages of the L imonium bicolor leaf generates insights into
salt gland differentiation. Plant Cell Environ. 38, 1637–1657 (2015).
54. Leng, B. et al. The lb23 mutant of recretohalophyte Limonium bicolor (Bag.) Kuntze with 20-, 24-, 28-and 32-cell salt glands shows
elevated salt secretion. Flora 259, 151441 (2019).
55. Okuma, E., Soeda, K., Tada, M. & Murata, Y. Exogenous proline mitigates the inhibition of growth of Nicotiana tabacum cultured
cells under saline conditions. Soil Sci. Plant Nutr. 46, 257–263 (2000).
56. Cho, U. H. & Seo, N. H. Oxidative stress in Arabidopsis thaliana exposed to cadmium is due to hydrogen peroxide accumulation.
Plant Sci. 168, 113–120 (2005).
57. Campos, P. S., nia Quartin, V., chicho Ramalho, J. & Nunes, M. A. Electrolyte leakage and lipid degradation account for cold
sensitivity in leaves of Coffea sp. plants. J. Plant Physiol. 160, 283–292 (2003).
Acknowledgements
This work was supported by the NSFC (National Natural Science Research Foundation of China, project
nos. 31600200; 31770288), and the Development Plan for Youth Innovation Team of Shandong Provincial
(2019KJE012).
Author contributions
F.Y. designed the research; X.X. and Y.Z. performed the research; X.X. and P.M. analyzed the data; X.X. wrote
the paper; F.Y. and B.W. revised the paper.
Competing interests
The authors declare no competing interests.
Additional information
Supplementary Information The online version contains supplementary material available at https://doi.org/
10.1038/s41598-021-93974-3.
Correspondence and requests for materials should be addressed to B.W. or F.Y.
Scientific Reports | (2021) 11:14562 | https://doi.org/10.1038/s41598-021-93974-3 13
Vol.:(0123456789)www.nature.com/scientificreports/
Reprints and permissions information is available at www.nature.com/reprints.
Publisher’s note Springer Nature remains neutral with regard to jurisdictional claims in published maps and
institutional affiliations.
Open Access This article is licensed under a Creative Commons Attribution 4.0 International
License, which permits use, sharing, adaptation, distribution and reproduction in any medium or
format, as long as you give appropriate credit to the original author(s) and the source, provide a link to the
Creative Commons licence, and indicate if changes were made. The images or other third party material in this
article are included in the article’s Creative Commons licence, unless indicated otherwise in a credit line to the
material. If material is not included in the article’s Creative Commons licence and your intended use is not
permitted by statutory regulation or exceeds the permitted use, you will need to obtain permission directly from
the copyright holder. To view a copy of this licence, visit http://creativecommons.org/licenses/by/4.0/.
© The Author(s) 2021
Scientific Reports | (2021) 11:14562 | https://doi.org/10.1038/s41598-021-93974-3 14
Vol:.(1234567890)You can also read