Combined Application of Organic and Inorganic Nitrogen Fertilizers Affects Soil Prokaryotic Communities Compositions - MDPI
←
→
Page content transcription
If your browser does not render page correctly, please read the page content below
agronomy
Article
Combined Application of Organic and Inorganic
Nitrogen Fertilizers Affects Soil Prokaryotic
Communities Compositions
Liyuan Liu † , Chuanzong Li † , Shuhao Zhu, Yan Xu, Houyu Li, Xiangqun Zheng * and
Rongguang Shi *
 Agro-Environmental Protection Institute, Ministry of Agriculture and Rural Affairs, Tianjin 300191, China;
 liuliyuan101@126.com (L.L.); 18612895943@126.com (C.L.); xz070614@126.com (S.Z.);
 13630820265@163.com (Y.X.); houyuli1@126.com (H.L.)
 * Correspondence: cannyliu1001@126.com (X.Z.); rongguangshi1@163.com (R.S.)
 † Liyuan Liu and Chuanzong Li have contributed equally to this work.

 Received: 25 November 2019; Accepted: 11 January 2020; Published: 16 January 2020

 Abstract: As a fundamental part of the soil ecosystem, prokaryotes are involved in the preservation
 of soil functions. However, little is known of how the combined application of long-term organic
 and inorganic nitrogen fertilizer affects the prokaryotic communities’ dynamics at a paddy field.
 A long-term positioning experiment initiated in 2013 with four treatments (NO: no N fertilizer, CN:
 100% urea N with no organic fertilizer, PM: 80% urea N plus 20% N with pig manure, CM: 80% urea
 N plus 20% N with compost) were applied to detect the differential responses of soil physicochemical
 properties, and prokaryotic community structure and composition in different fertilization regimes.
 The results indicated that the long-term combined application of organic and inorganic nitrogen
 fertilizers altered the physicochemical properties to some extent and, simultaneously, established
 unique prokaryotic communities. In detail, the treatment of PM and CM significantly increased the
 content of soil organic carbon (SOC) and total nitrogen (TN) compared to NO. Moreover, a total of 31
 indicator taxa were screened across the four treatments by LDA Effect Size (LEfSe) analysis following
 the principle of the greatest differences, which suggests that these indicator taxa were more sensitive
 to the fertilization. This research suggested that the combined application of long-term organic and
 inorganic nitrogen fertilizers not only contributed to the soil’s physicochemical properties but also
 changed the prokaryotic community composition.

 Keywords: fertilization regimes; soil physicochemical properties; prokaryotic communities;
 indicator taxa

1. Introduction
      Among all agronomic practices, the application of inorganic fertilizers is regarded as the most
active method to improve soil fertility and crop productivity [1]. A large amount of inorganic fertilizers
has been applied to increase the worldwide crop yield [2]. However, the long-term unreasonable
application of chemical fertilizers has resulted in serious adverse effects on the physicochemical
properties of soil, such as the degradation of soil organic carbon (SOC) and soil acidification [3,4].
Moreover, severe environment pollution, induced by the excessive application of inorganic fertilizers,
has aroused extensive attention [5]. Consequently, effective and environmentally-friendly fertilization
regimes should be strongly advocated. Organic fertilizers are rich in nutrients mainly derived from
animal manure and crop straws, which are agricultural waste [6,7]. It has been demonstrated that
soil’s physicochemical properties can be modified by organic fertilizer as a result of its comprehensive
nutrients [8,9]. Moreover, the fertilizer efficiency of organic factors is more lasting when compared with

Agronomy 2020, 10, 132; doi:10.3390/agronomy10010132                            www.mdpi.com/journal/agronomy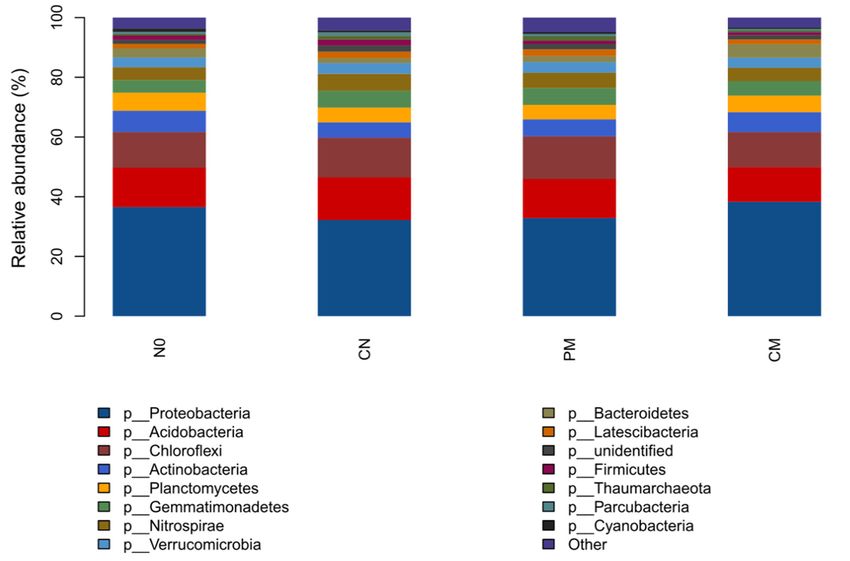
Agronomy 2020, 10, 132                                                                                  2 of 13

inorganic fertilizers [10–12]. Therefore, the application of organic fertilizers is better for the nutrient
recycling of soil and the reduction of environmental pollution [13]. Unfortunately, the nutrient release
of organic fertilizers is slow and unpredictable, which restricts its prevalence [14,15]. Considering the
properties of chemical fertilizers and organic fertilizers, the combined application of chemical fertilizers
and organic fertilizers would be a preferable strategy for nutrient management and environmental
protection for soil in comparison with the application of either of them alone [16–18].
      Although the productivity of soil is mainly caused by the high levels of nutrients available to
crops, soil microorganisms also have a great effect on soil quality and, consequently, influence soil
productivity [19,20]. As the most diverse soil microbial population, prokaryotes are involved in the
process of organic decomposition, humus formation, and nutrient cycling, which are significantly
influenced by fertilization regimes [21,22]. For instance, nitrifying bacteria are responsible for the
process of oxidation from ammonia (NH3 ) to nitrite (NO2 − ), and then from NO2 − to nitrate (NO3 − )
under aerobic conditions, which can be absorbed by crops [23,24]. Accordingly, a pellucid explanation
for the shifts in soil’s prokaryotic communities under different fertilization regimes would contribute
to a better understanding of the status of soil nutrient cycling.
      The studies on soil microbiology mainly focus on the improvements and breakthroughs in
research techniques. The method of classical isolation culture and plate counting is regarded as
a milestone in soil microbial research. However, this method cannot reflect the abundance of soil
microbial communities and their function [25]. The method of soil microbial biomass analysis that
arose in the 1970s, which could effectively quantify the microbial turnover process of nutrients such
as soil carbon, nitrogen, and phosphorus, promoted further research on the biochemical process of
soil microbiology [26]. With the development of biological technology, molecular techniques such
as polyacrylamide gel electrophoresis (DGGE), terminal restriction fragment length polymorphism
(T-RFLP), clone libraries, and DNA sequencing were applied to the research of soil microorganisms in
the late 1990s. Nevertheless, these methods mainly concentrated on the dominant group that can be
cultivated, which makes it difficult to comprehensively explore the diversity of soil microbes [27–29].
After this, the method of high-throughput sequencing was used to study the divergence of the soil
microbial community, which has been proved to be a better way to assess soil microbial ecology [30].
Notably, Illumina MiSeq sequencing, according to 16S rRNA gene libraries, was widely used to explore
soil prokaryotic communities involving long-term fertilization regimes [31–33]. For example, it has
been demonstrated that the application of long-term organic fertilizers would enhance the diversity of
soil prokaryotic communities, especially the Gram positive microorganisms [34]. Additionally, the
effects of different organic fertilizers on soil prokaryotic communities varied under distinct planting
conditions [35]. However, there is less research on prokaryotic communities’ dynamics of tidal sand
soil, which develops from river alluvial or coastal sediments after planting crops.
      In this research, a field experiment, lasting for six consecutive years with four different fertilization
regimes under tidal sand soil in a double-rice cropping rotation system, was established to explore
the influences of different organic fertilizers on the structure and composition of soil prokaryotic
communities. The purposes of this study were: (i) to examine the changes in soil’s physicochemical
properties and prokaryotic community diversity under different fertilizer regimes, (ii) to detect the
differences in the relative abundances of dominant phyla under each treatment, and (iii) to identify the
indicator taxa under different prokaryotic taxonomic levels by LDA Effect Size (LEfSe) analysis.

2. Materials and Methods

2.1. Study Site
     The experiment was carried out at Yanxi Town, Liuyang City, Hunan Province, China (113.82 E,
28.33 N) with a subtropical monsoon humid climate. The mean annual temperature was 17.5 ◦ C and
the annual average precipitation was 1562 mm. The initial soil properties of the study site are shown
in Table 1.
Agronomy 2020, 10, 132 3 of 13
Table 1. The initial soil properties of the studied site.
Soil Organic Total Alkali-Hydrolyzable Available Total Available
Total P
pH Carbon N (TN) Nitrogen (AN) P (AP) K (TK) K (AK)
(TP) (g/kg)
(SOC) (g/kg) (g/kg) (mg/kg) (mg/kg) (g/kg) (mg/kg)
5.61 16.62 1.21 48.93 0.54 21.25 11.51 155.7
2.2. Experimental Design
The experiment was designed randomly from April 2013 to 2019 under a double-rice cropping
system with four treatments and three replicates: no nitrogen fertilizer (NO), 100% urea nitrogen with
no organic fertilizer (CN), 80% urea nitrogen plus 20% nitrogen with pig manure (PM), and 80% urea
nitrogen plus 20% nitrogen with compost (CM). The TN applied to each treatment, except NO, was
180 kg hm−2 (pure N). All treatments received 105 kg hm−2 of K2 O and 60 kg hm−2 of P2 O5 each
growing season. The amount of organic materials applied in the treatments of PM and CM was based
on the total amount of nitrogen contained in the organic materials. The application of phosphate
fertilizers and potassium fertilizers was partially supplemented if the content of K2 O and P2 O5 in the
organic fertilizers was not enough. The physical and chemical properties of the organic materials are
shown in Table 2. In this experiment, organic fertilizers and phosphate fertilizers were used as a basal
fertilizer, while 60% of the inorganic nitrogen and potassium fertilizers were used as base fertilizers
and 40% were used as top dressing at the tillering stage. Each plot was 4.0 × 5.0 m, which covers an
area of 20 m2 . Moreover, all of the plots were separated by a cement ridge (20 × 25 cm) to prevent
interactions between each plot. The crop managements of all the plots, including pests, diseases, and
weeds, were coincident.
Table 2. Physical and chemical properties of the organic materials.
Organic Material pH N (%) P2 O5 (%) K2 O (%) C (%) Moisture Content (%)
PM 8.38 0.23 0.23 0.13 13.49 68.7
CM 8.28 0.83 1.07 0.75 30.05 32.1
Nutrient content (%) are based on a fresh weight basis.
2.3. Sample Collection
Soil samples were collected in March 2019, before the early rice planting, to avoid interference
from rice and recent fertilization. For each plot, soil was gathered from five sites, which were selected
randomly except for the two edge rows to avoid the potential edge effects at 0–10 cm in depth, and,
subsequently, formed a composite sample. All the samples were transmitted to the lab immediately on
ice and split into two portions: one was stored at −80 ◦ C for prokaryotic analysis and the other was
stored for soil physicochemical properties analysis after being air-dried.
2.4. Soil Properties Analysis
The soil properties index measured in this research included SOC, TN, TP, pH, and SOC/TN,
following the description of Bao [36]. In brief, the vitriol acid–potassium dichromate oxidation method
was used to determine the level of SOC. Soil pH was measured by a pH meter (FE20-FiveEasyTM pH,
Germany). TN was extracted with 98% sulfuric acid and TP was extracted with 98% sulfuric acid and
perchloric acid, and then a continuous flow analyzer (AA3, Bran + Luebbe, Hamburg, Germany) was
used to measure extracting solution.
2.5. Microbial Analysis
PowerSoil DNA Isolation Kit (MoBio Laboratories, Carlsbad, CA, USA) was used to extract
the soil DNA from 0.5 g soil from each sample, which was stored at −80 ◦ C. Next, 1%
agarose gels were used to check the quality of the extracted soil DNA. The primers 515 F:Agronomy 2020, 10, 132 4 of 13
50 -barcode-GTGCCAGCMGCCGCGGTAA and 806 R: 50 -barcode-GGACTACHVGGGTWTCTAAT
were used to amplify the V4 hypervariable region of 16S rRNA. The total volume of the polymerase
chain reaction (PCR) system was 25 µL, including 30 ng template DNA, 1 µL Forward Primer (5 µmol/L)
and Reverse Primer (5 µmol/L), respectively, 12.5 µL 2× Taq Plus Master Mi, 3 µL BSA (2ng/µL), and
7.5 µL ddH2 O. The cycling parameters of PCR were 94 ◦ C for 5 min, followed by 30 cycles at 94 ◦ C
for 30 s, 50 ◦ C for 30 s, 72 ◦ C for 60 s, and 72 ◦ C for 7 min. Three PCR products of each sample were
gathered together to reduce the biases of a reaction-level PCR. Then, a QIAquick Gel Extraction Kit
(QIAGEN, Hilden, Germany) was used to purify the PCR products, which were further sequenced
based on the Miseq platform at Allwegene Company (Beijing, China). The raw sequences were quality
filtered using 2.6 (CU, Fort Collins, CO, USA), based on the consideration described by Edgar and
Cole [37,38]. The retained sequences were analyzed by USEARCH 7,1 (Joint Genome Institute MBL,
Woods Hole Cornell University, CNRS, France) to generate the operational taxonomic units (OTUs)
table according to 97% similarity after the chimeras were removed. The representative sequences of
OTUs were classified against the Silva 16S rRNA database, based on a confidence threshold of 70% [39].
2.6. Analysis of Data
Statistical Program for Social Sciences (SPSS 20.0 Inc., Chicago, IL, USA) was applied for data
statistic and charts preparing. One-way analysis of variance (ANOVA) was carried out for differences
analysis and a Duncan comparison test was performed for multiple comparisons. Rarefaction was
conducted through Mothur v.1.30.1 (University of Michigan, Ann Arbor, MI, USA) to study the
sequencing depth of the soil samples. Nonparametric Shannon diversity index (Shannon), the richness
of the Chao1 estimator (Chao1), and Good’s nonparametric coverage estimator (Coverage), according
to the OTU dataset, were also calculated by Mothur software. Beta diversity was analyzed by nonmetric
multidimensional scaling (NMDS) based on unweighted UniFrac phylogenetic distance metrics at
the OTU level with the vegan of R. Linear discriminant analysis effect size (LEfSe), according to the
Kruskal–Wallis (KW) sum-rank testing. This was conducted to select the significantly different species,
which were defined as the indicator taxa of prokaryotic taxa among groups. The effect size of each
indicator taxa were evaluated by linear discriminant analysis (LDA). [2].
3. Results
3.1. Soil Properties
As shown in Table 3, soil physicochemical properties were modified to a large extent under
different long-term fertilization regimes. Specifically, the pH value significantly decreased, by 0.17,
under CN treatment but increased by 0.08 in response to CM treatment relative to NO treatment. The
difference between the NO and PM treatments was not significant. Furthermore, the PM and CM
treatments significantly increased the SOC by 16.42% and 22.08%, respectively, compared to the NO
treatment. While no significant difference was observed between the CN and NO, and PM and CN
treatments. In addition, we observed that TN varied from 1.39 to 1.73 g kg−1 and the minimum and
maximum appeared in the treatments of NO and PM, respectively. The content of TN under the PM
and CM is significantly higher than under the NO and CN treatments. Comparatively, the content of
TP ranged from 348.20 to 397.63 mg kg−1 , and the minimum and maximum appeared in the treatments
of CN and PM, respectively. As for the SOC/TN, there were no significant differences among the
four treatments.Agronomy 2020, 10, 132 5 of 13
Table 3. Soil properties under different treatments.
Treatment pH SOC (g/kg) TN (g/kg) TP (mg/kg) SOC/TN
NO 6.61 ± 0.01 b 19.97 ± 0.39 c 1.39 ± 0.06 b 360.64 ± 16.03 b 14.38 ± 0.56 a
CN 6.44 ± 0.03 c 20.91 ± 1.13 bc 1.46 ± 0.07 b 348.20 ± 14.51 c 14.29 ± 0.58 a
PM 6.64 ± 0.04 ab 23.25 ± 1.58 ab 1.73 ± 0.05 a 397.63 ± 26.38 a 13.41 ± 1.18 a
CM 6.69 ± 0.03 a 24.38 ± 1.64 a 1.68 ± 0.05 a 374.12 ± 12.71 ab 14.54 ± 0.59 a
Data are presented as the Mean ± Standard Deviation (n = 3). Different letters within columns indicate significance
at p < 0.05 according to Duncan’s test. NO: no nitrogen fertilizer. CN: 100% urea nitrogen with no organic fertilizer.
PM: 80% urea nitrogen plus 20% nitrogen with pig manure. CM: 80% urea nitrogen plus 20% nitrogen with compost.
SOC: soil organic carbon. TN: total nitrogen. TP: total phosphorus.
3.2. Sequencing Data
A total of 1,600,337 reads were successfully elicited from all the soil samples. After filtering,
1,561,198 effective sequences were maintained, which varied from 81,893 to 239,204 for each sample
(Table S1). Moreover, 12,358 OTUs, which varied from 5815 to 6628 per sample, were identified from the
whole samples based on 97% similarity. Furthermore, all of the OTUs were assorted as bacteria, with
60 phyla, 161 classes, 231 orders, 392 families, and 617 genus. A rarefaction analysis was used to study
the sequencing depth and the results showed that the number of OTUs observed reached saturation,
which indicated that the sequencing depth was adequate for further analysis (Figure S1). Additionally,
the coverage indices for each treatment exceeded 0.95, which revealed that the sequencing capability
was sufficient to occupy the majority of the prokaryotic community’s features (Table 4). There were no
significant differences in the OTU number, Shannon index, and Chao1 under the treatments of CN,
PM, and CM, compared to the NO treatment.
Table 4. Estimated number of observed OTUs and the biodiversity, richness, and coverage of
each treatment.
Treatment Observed OTUs Shannon Chao1 Coverage
NO 6014.07 ± 360.68 a 10.76 ± 0.1542 a 8281.18 ± 410.84 a 0.9642 ± 0.0016 a
CN 6065.17 ± 82.41 a 10.74 ± 0.13424 a 8276.39 ± 166.56 a 0.9643 ± 0.0010 a
PM 5891.23 ± 244.51 a 10.66 ± 0.12511 a 8263.72 ± 501.33 a 0.9645 ± 0.0023 a
CM 6125.60 ± 280.43 a 10.80 ± 0.07543 a 8278.63 ± 421.21 a 0.9644 ± 0.0024 a
Data are presented as the Mean ± Standard Deviation (n = 3). Different letters within columns indicate significance
at p < 0.05 according to Duncan’s test. NO: no nitrogen fertilizer. CN: 100% urea nitrogen with no organic fertilizer.
PM: 80% urea nitrogen plus 20% nitrogen with pig manure. CM: 80% urea nitrogen plus 20% nitrogen with compost.
Observed OTUs, observed operational taxonomic units. Shannon, nonparametric Shannon diversity index. Chao1,
richness of the Chao1 estimator. Coverage, Good’s nonparametric coverage estimator.
3.3. Prokaryotic Community Structures and Compositions
According to the unweighted UniFrac phylogenetic distance, nonmetric multidimensional scaling
(NMDS) was employed to detect the beta diversity of the prokaryotic community structures. The results
showed that the soil prokaryotic communities varied significantly among the different fertilization
treatments (Figure 1). Samples within the same treatment clustered tightly together and differentiated
among treatments, with the exception of one of the sample in the NO treatment, which suggested that
samples from the same treatment have a high similarity and samples from different treatments have
high variation. In detail, the cluster of CM grouped apart from the other three clusters along the first
components (NMDS1). Moreover, the cluster CN, NO, and PM separated from each other along the
second components (NMDS2). Based on cluster positioning in the nonmetric multidimensional scaling
(NDMS) space, the greatest difference was between the NO and CN treatments shown in Figure 1.
Furthermore, PM and CM treatment clusters were situated between the NO and CN treatments, which
suggests that an intermediate change in the prokaryotic community was obtained under the CM and
PM treatments when compared to the NO treatment. In addition, the CM and PM treatments impacted
the prokaryotic communities in an orthogonal manner when compared to the CN treatment. Moreover,Agronomy 2020, 10, 132 6 of 13
the two organic fertilizer treatments (PM and CM) were also situated apart, which indicated that the
responses of the
Agronomy 2020, 10, xsoil
FORprokaryotic
PEER REVIEWcommunities were distinct in different organic materials. 7 of 13
Figure 1. Beta diversity of the soil prokaryotic community of different fertilization regimes. NO: no N
Figure 1. Beta diversity of the soil prokaryotic community of different fertilization regimes. NO: no
fertilizer. CN: 100% urea N with no organic fertilizer. PM: 80% urea N plus 20% N with pig manure.
N fertilizer. CN: 100% urea N with no organic fertilizer. PM: 80% urea N plus 20% N with pig manure.
CM: 80% urea N plus 20% N with compost. Beta diversity was analyzed by nonmetric multidimensional
CM: 80% urea N plus 20% N with compost. Beta diversity was analyzed by nonmetric
scaling (NMDS) based on unweighted UniFrac phylogenetic distance metrics at the OTU level, and
multidimensional scaling (NMDS) based on unweighted UniFrac phylogenetic distance metrics at the
displayed in a scatter diagram.
OTU level, and displayed in a scatter diagram.
The top five dominant phyla of each samples were Proteobacteria, Acidobacteria, Chlorofexi,
Actinobacteria, and Planctomycetes, which occupied upward of 65% of the relative abundance of
the prokaryotic communities (Figure 2). In detail, the relative abundance of Proteobacteria in the
sample was higher than the other phyla, which was most abundant in CM treatment (38.3%) but
least abundant in CN treatment (32.19%). As the second-most abundant phyla, Acidobacteria was
most abundant in CN treatment (14.13%) but least abundant in CM treatment (11.57%). Chlorofexi
was most abundant in PM treatment (14.32%) and least abundant in CM treatment (11.78%), whereas
Actinobacteria was most abundant in NO treatment (7.12%) and least abundant in CN treatment (5.14%).
Similarly, Planctomycetes was most abundant in NO treatment (6.06%) and least abundant in CN and
PM treatments (4.95% and 4.875%).
To explore the differences in relative abundances of six prokaryotic phyla of the top 10 dominant
bacteria, an analysis of variance (ANOVA) was applied (Figure 3). The abundances of Proteobacteria
under the treatments of CN and PM were significantly (p < 0.05) decreased by 18.99% and 14.24%,
when compared to the CM treatment. However, the difference in the abundances of Proteobacteria
between CM and NO was not significant. The abundances of Acidobacteria increased by 8.16% under
the treatment of CN compared to the treatment of no nitrogen fertilizer (NO) without a significant
difference. The abundances of Acidobacteria decreased by 10.71% and 12.05% under the PM and
CM treatments, respectively, compared to the NO treatment and the differences were not significant.
The abundances of Actinobacteria and Planctomycetes were decreased by 6.85% to 27.83% and 8.43% to
Figure 2. The relative abundances of dominant prokaryotic phyla in four kinds of organic materials
amendment. Data were means of three replicates of composite samples. NO: no N fertilizer. CN: 100%Agronomy 2020, 10, 132 7 of 13
19.62% under the three treatments with nitrogen fertilizer compared to the NO treatment. However,
a significant difference was only observed between the CN and NO treatments for Actinobacteria.
Regarding Planctomycetes, significant differences were observed in the CN and PM treatments relative
to the Figure
NO treatment. The abundance
1. Beta diversity of the soilof Nitrospiraecommunity
prokaryotic under the of
CN treatment
different was significantly
fertilization increased
regimes. NO: no
by 47.25% compared to the NO treatment. The abundances of Nitrospirae under the PM
N fertilizer. CN: 100% urea N with no organic fertilizer. PM: 80% urea N plus 20% N with pig manure. and CM
treatments
CM: were increased
80% urea by 20.02%
N plus 20% Nand 4.28%,
with respectively,
compost. compared
Beta diversity wasto the NO treatment,
analyzed without
by nonmetric
a significant difference. There was no significant difference in the abundances of Chlorofexi
multidimensional scaling (NMDS) based on unweighted UniFrac phylogenetic distance metrics at the allamong
of the OTU
treatments (Figure
level, and 3c). in a scatter diagram.
displayed
Figure 2. The relative abundances of dominant prokaryotic phyla in four kinds of organic materials
Figure 2. The relative abundances of dominant prokaryotic phyla in four kinds of organic materials
amendment. Data were means of three replicates of composite samples. NO: no N fertilizer. CN: 100%
amendment. Data were means of three replicates of composite samples. NO: no N fertilizer. CN: 100%
urea N with no organic fertilizer. PM: 80% urea N plus 20% N with pig manure. CM: 80% urea N plus
20% N with compost.
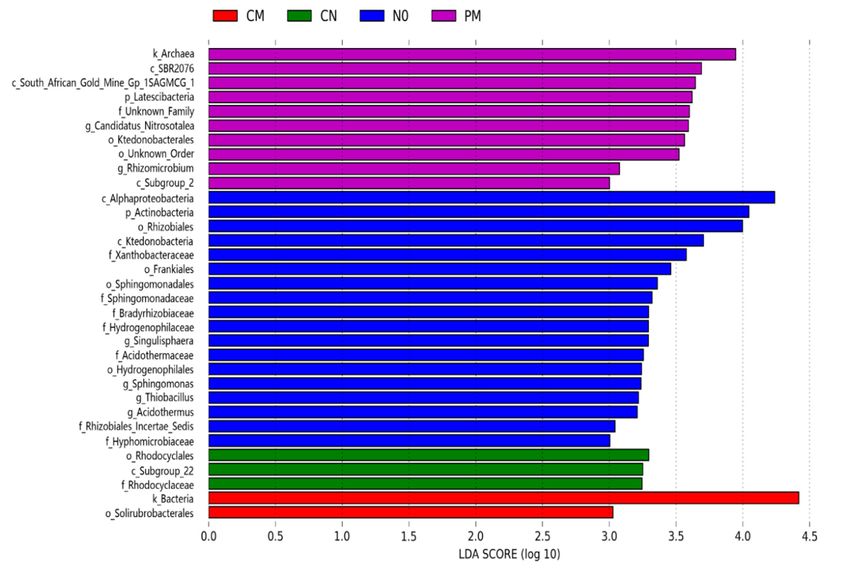
3.4. Indicator Taxa of Different Treatments Subjected to Different Long-Term Fertilization Regimes
Linear discriminant analysis (LDA) effect size (LEfSe) was applied to identify specific prokaryotic
taxa among the NO, CN, PM, and CM treatments. As shown in Figure 4, a total of 31 indicator
taxa were screened across the four treatments following the principle of the greatest differences
(LDA ≥ 3) under different taxonomic levels. The relative abundances of the kingdom Bacteria
and order Solirubrobacterales were dramatically higher in CM treatment than in the other three
treatments. Therefore, they were considered as the indicator taxa of CM treatment. Similarly, the class
Subgroup_22, order Rhodocyclales and family Rhodocyclaceae were considered as the indicator taxa of CN
treatment, the Phylum Acidobacteria, class Alphaproteobacteria, and Ktedonobacteria, order Rhizobiales,
Frankiales, Sphingomonadales, Hydrogenophilales, family Hyphomicrobiaceae, Rhizobiales_Incertae_Sedis,
Acidothermaceae, Hydrogenophilaceae, Bradyrhizobiaceae, Sphingomonadaceae, genus Singulisphaera,
Sphingomonas, Thiobacillus, and Acidothermus as the indicator taxa of NO treatment, kingdom Archaea,
class SBR2076, South_African_Gold_Mine_Gp_1SAGMCG_1 and Subgroup_2, order Ktedonobacterales,
phylum Latescibacteria, genus Candidatus_Nitrosotalea, and Rhizomicrobium as the indicator taxa of
PM treatment.Agronomy 2020, 10, x FOR PEER REVIEW 8 of 13
urea N with no organic fertilizer. PM: 80% urea N plus 20% N with pig manure. CM: 80% urea N plus8 of 13
Agronomy 2020, 10, 132
20% N with compost.
Figure 3. Comparison of the relative abundances of six bacteria phyla of the top 10 dominant bacteria
Figure
phyla 3. Comparison
across treatmentsof(Proteobacteria,
the relative abundances of sixChlorofexi,
Acidobacteria, bacteria phyla of the top 10Planctomycetes
Actinobacteria, dominant bacteria
and
phyla across treatments (Proteobacteria, Acidobacteria, Chlorofexi, Actinobacteria, Planctomycetes
Nitrospirae for (a–f) respectively). Bars indicate the standard error (n = 3). Different letters above and
Nitrospirae for (a–f) respectively). Bars indicate the standard error (n = 3). Different letters
columns within the same species indicate significance at p < 0.05, according to Duncan’s test. NO: no N above
columnsCN:
fertilizer. within
100%theurea
sameNspecies
with noindicate
organicsignificance at p 80%
fertilizer. PM: < 0.05, according
urea to Duncan’s
N plus 20% test.manure.
N with pig NO: no
CM: 80% urea N plus 20% N with compost.Rhizobiales, Frankiales, Sphingomonadales, Hydrogenophilales, family Hyphomicrobiaceae,
Rhizobiales_Incertae_Sedis, Acidothermaceae, Hydrogenophilaceae, Bradyrhizobiaceae, Sphingomonadaceae,
genus Singulisphaera, Sphingomonas, Thiobacillus, and Acidothermus as the indicator taxa of NO
treatment, kingdom Archaea, class SBR2076, South_African_Gold_Mine_Gp_1SAGMCG_1 and
Subgroup_2, order Ktedonobacterales, phylum Latescibacteria, genus Candidatus_Nitrosotalea, and
Agronomy 2020, 10, 132 9 of 13
Rhizomicrobium as the indicator taxa of PM treatment.
Figure 4. Taxonomic cladogram obtained from the LEfSe of 16S rDNA sequences. NO: no N fertilizer.
Figure
CN: 100% 4. urea
Taxonomic
N withcladogram
no organicobtained
fertilizer.from
PM:the
80%LEfSe
urea of
N 16S
plusrDNA sequences.
20% N NO: no NCM:
with pig manure. fertilizer.
80%
CN: 100% urea N with no organic
urea N plus 20% N with compost. fertilizer. PM: 80% urea N plus 20% N with pig manure. CM: 80%
urea N plus 20% N with compost.
4. Discussion
4. Discussion
This research discovered that the combined application of long-term organic and inorganic
This
fertilizer research discovered
significantly that
increased the soilthe
pHcombined application
value, whereas of long-term
the single applicationorganic and nitrogen
of inorganic inorganic
fertilizer significantly increased the soil pH value, whereas the single application
fertilizer significantly decreased the pH value compared with NO treatment (Table 1), which was in line of inorganic
nitrogen
with fertilizer
previous significantly
studies [40]. Theredecreased the pH value
are three possible compared
explanations for with NO treatment
the different response(Table 1), which
mechanisms
ofwas
pHintoline
thewith previous
various studies regimes.
fertilization [40]. ThereFirst,
are three possible
organic explanations
fertilizer for may
application the different response
have increased
mechanisms
soil pH, mainlyofdue pH toto the
theliming
variouseffect
fertilization regimes.
of the organic First,and
matter organic fertilizer
carbonates application
in organic may [41].
fertilizer have
Second, urea may have been converted into ammonium or ammonia in the soil first and, subsequently,
the pH value decreased, due to the processes of nitrification, which converts ammonium to nitrate
under the treatment of only inorganic fertilizer application [42]. Third, ammonium can decrease soil
pH by completing the exchange sites of the soil solid phases with base cations [43]. Additionally, soil
nutrient status was modified to different degrees under different fertilization regimes in this research.
Among the four treatments, organic and inorganic fertilizer combined applications (PM, CM) most
clearly increased the SOC content, which coincided with the studies of Daquiado and Wei [34,44].
We may cite two mechanisms for the increased SOC using the treatments with organic fertilizers.
There was a high content of organic compounds, which were easily biodegradable in the pig manure
and compost compared with inorganic fertilizer [17]. In addition, organic fertilizer could promote
the growth of crops, which results in an increased input of SOC to soil via crops [45]. Moreover, the
results of the present study demonstrated that the combined application of long-term organic and
inorganic fertilizer would improve TN and TP content (Table 2), which is in accordance with Daquiado
and Zhong [34,46]. Above all, the combined application of long-term organic and inorganic fertilizer
increased the nutrient status of the soil.
The biodiversity and composition of the prokaryotic community is considered to be one of the
most important factors for the material circulation and energy flow of soil ecosystems, which can be
affected by fertilization regimes [47,48]. In our research, there was no significant difference in theAgronomy 2020, 10, 132 10 of 13
prokaryotic community diversity between different treatments, which was consistent with the findings
of Chen and Dai [1,35]. This phenomenon could be explained by the existence of prokaryotic groups,
which were not sensitive to the environmental changes. However, it contrasted with the findings of
Cui, who found that the combined application of long-term organic and inorganic fertilizer resulted in
a significantly (p < 0.05) higher prokaryotic richness index, which might be explained by the longer
treatment period used in the study of Cui of 34 years from 1982 to 2016 [2].
As well as biodiversity, the differences in the prokaryotic community compositions were significant
among different treatments, which corresponded with previous research [38]. In our study, the top
five dominant phyla across all samples were Proteobacteria, Acidobacteria, Chlorofexi, Actinobacteria, and
Planctomycetes, which was similar to the results of two previous studies [35,49]. As the most abundant
phyla of the soil bacteria, Proteobacteria, which were composed of gram-negative bacteria, preferred
the environment with a high nutrient content demonstrated in the study of Byss [50]. There were
significant (p < 0.05) differences in the abundance of Proteobacteria under CM and PM treatments,
while there were no significant differences in the SOC, TN, and TP content under the two treatments,
which indicated that the abundance of Proteobacteria was not only affected by soil nutrient content
but also fertilizer type. This echoes the previous findings of Lazcano, who found that Proteobacteria
was particularly influenced by the types of fertilizer supplied [51]. Moreover, the phenomenon that
Acidobacteria are able to thrive in acidic soils was observed in our study, which has also been proven
in the study of Lauber and Rousk [52,53]. However, there were no significant differences in the
abundances of Chlorofexi, which may be significantly affected by the soil water content and were not
sensitive to fertilization regimes [35]. It is well known that Actinobacteria plays an important role in the
turnover of organic matter of soil because it participates in the decomposition of polymers. However,
there was no significant difference in the abundances of Actinobacteria under the treatments of CM,
PM, and CN in our study, which contrasted with the findings of previous studies that indicated that a
higher SOC drove the increase in Actinobacteria abundance [52,53].
5. Conclusions
The combined application of long-term organic and inorganic fertilizer increased the nutrient
status of soil. Specifically, the treatment of PM and CM significantly increased the SOC and TN
content compared to NO. Moreover, different fertilization regimes established the unique prokaryotic
communities of paddy soil. For instance, the abundances of Proteobacteria under the PM treatment
were significantly decreased by 10.13% compared to the NO treatment, while the difference in the
abundances of Proteobacteria between CM and NO was not significant. In addition, LEfSe indicated
that a total of 31 indicator taxa were screened across the four treatments following the principle
of the greatest differences under different taxonomic levels, which suggests that these prokaryotic
taxa were more sensitive to fertilization. This research suggested that the combined application of
long-term organic and inorganic fertilizer not only contributed to the soil nutrients but also changed
the prokaryotic community’s composition.
Supplementary Materials: The following are available online at http://www.mdpi.com/2073-4395/10/1/132/s1.
Table S1: OTUs across treatments. Figure S1: Rarefaction curves of bacteria depicting the effect of 3% dissimilarity
on the number of OTUs identified in the 12 soil samples.
Author Contributions: Conceptualization, L.L., C.L., and S.Z. Formal analysis, L.L., and C.L. Funding acquisition,
X.Z. and R.S. Investigation, L.L. and S.Z. Methodology, S.Z. Project administration, X.Z. Resources, H.L. Supervision,
R.S. Validation, L.L., S.Z., and Y.X. Visualization, H.L. Writing—original draft, L.L. Writing—review & editing,
Y.X., C.L. All authors have read and agreed to the published version of the manuscript.
Funding: The National Key R&D Program of China, grant number 2016YFD0201201 and National Key R&D
Program of China, grant number 2016YFD0201200, funded this research.
Acknowledgments: We thank Guixian Xie of Hunan Agricultural University for cooperation and assistance in
the field experimentation.
Conflicts of Interest: The authors declare no conflict of interest.Agronomy 2020, 10, 132 11 of 13
References
1. Chen, D.; Yuan, L.; Liu, Y.; Ji, J.; Hou, H. Long-term application of manures plus chemical fertilizers sustained
high rice yield and improved soil chemical and bacterial properties. Eur. J. Agron. 2017, 90, 34–42. [CrossRef]
2. Cui, X.; Zhang, Y.; Gao, J.; Peng, F.; Gao, P. Long-term combined application of manure and chemical fertilizer
sustained higher nutrient status and rhizospheric bacterial diversity in reddish paddy soil of Central South
China. Sci. Rep. 2018, 8, 16554. [CrossRef] [PubMed]
3. Chang, E.; Chung, R.; Tsai, Y.H. Effect of different application rates of organic fertilizer on soil enzyme
activity and microbial population. Soil Sci. Plant Nutr. 2007, 53, 132–140. [CrossRef]
4. Gong, W.; Yan, X.; Wang, J.; Hu, T.; Gong, Y. Long-term manuring and fertilization effects on soil organic
carbon pools under a wheat–maize cropping system in North China Plain. Plant Soil 2008, 314, 67–76.
[CrossRef]
5. Ning, C.; Gao, P.; Wang, B.; Lin, W.; Jiang, N.; Cai, K. Impacts of chemical fertilizer reduction and organic
amendments supplementation on soil nutrient, enzyme activity and heavy metal content. J. Integr. Agric.
2017, 16, 1819–1831. [CrossRef]
6. Bakht, J.; Shafi, M.; Jan, M.T.; Shah, Z. Influence of crop residue management, cropping system and N
fertilizer on soil N and C dynamics and sustainable wheat (Triticum aestivum L.) production. Soil Tillage Res.
2009, 104, 233–240. [CrossRef]
7. Sun, R.; Zhang, X.; Guo, X.; Wang, D.; Chu, H. Bacterial diversity in soils subjected to long-term chemical
fertilization can be more stably maintained with the addition of livestock manure than wheat straw. Soil Biol.
Biochem. 2015, 88, 9–18. [CrossRef]
8. Li, X.; Guo, J.; Dong, R.; Ahring, B.K.; Zhang, W. Properties of plant nutrient: Comparison of two
nutrient recovery techniques using liquid fraction of digestate from anaerobic digester treating pig manure.
Sci. Total Environ. 2016, 544, 774–781. [CrossRef]
9. Zhang, P.; Chen, X.; Wei, T.; Yang, Z.; Jia, Z.; Yang, B. Effects of straw incorporation on the soil nutrient
contents, enzyme activities, and crop yield in a semiarid region of China. Soil Tillage Res. 2016, 160, 65–72.
[CrossRef]
10. Hati, K.M.; Mandal, K.G.; Misra, A.K.; Ghosh, P.K.; Bandyopadhyay, K.K. Effect of inorganic fertilizer and
farmyard manure on soil physical properties, root distribution, and water-use efficiency of soybean in
Vertisols of central India. Bioresour. Technol. 2006, 97, 2182–2188. [CrossRef]
11. Bhattacharyya, R.; Chandra, S.; Singh, R.; Kundu, S.; Srivastva, A.; Gupta, H. Long-term farmyard manure
application effects on properties of a silty clay loam soil under irrigated wheat-soybean rotation. Soil Tillage
Res. 2007, 94, 386–396. [CrossRef]
12. Amusan, A.O.; Adetunji, M.; Azeez, J.O.; Bodunde, J.G. Effect of the integrated use of legume residue,
poultry manure and inorganic fertilizers on maize yield, nutrient uptake and soil properties. Nutr. Cycl.
Agroecosyst. 2011, 90, 321–330. [CrossRef]
13. Ge, G.; Li, Z.; Fan, F.; Chu, G.; Hou, Z.; Liang, Y. Soil biological activity and their seasonal variations in
response to long-term application of organic and inorganic fertilizers. Plant Soil. 2009, 326, 31–44. [CrossRef]
14. Bandyopadhyay, K.K.; Misra, A.K.; Ghosh, P.K.; Hati, K.M. Effect of integrated use of farmyard manure
and chemical fertilizers on soil physical properties and productivity of soybean. Soil Tillage Res. 2010,
110, 115–125. [CrossRef]
15. Chen, M.; Cui, Y.; Bai, F.; Wang, J. Effect of two biogas residues’ application on copper and zinc fractionation
and release in different soils. J. Environ. Sci. 2013, 25, 1865–1873. [CrossRef]
16. Zhang, H.; Xu, M.; Zhang, F. Long-term effects of manure application on grain yield under different cropping
systems and ecological conditions in China. J. Agric. Sci. 2008, 147, 31–42. [CrossRef]
17. Yanardağ, İ.H.; Zornoza, R.; Cano, A.F.; Yanardağ, A.B.; Mermut, A.R. Evaluation of carbon and nitrogen
dynamics in different soil types amended with pig slurry, pig manure and its biochar by chemical and
thermogravimetric analysis. Biol. Fertil. Soils. 2014, 51, 183–196. [CrossRef]
18. Calderon, F.J.; Benjamin, J.; Vigil, M.F. A comparison of corn (Zea mays L.) residue and its biochar on soil C
and plant growth. PLoS ONE 2015, 10, 0121006. [CrossRef]
19. Chu, H.; Lin, X.; Fujii, T.; Morimoto, S.; Yagi, K.; Hu, J. Soil microbial biomass, dehydrogenase activity,
bacterial community structure in response to long-term fertilizer management. Soil Biol. Biochem. 2007,
39, 2971–2976. [CrossRef]Agronomy 2020, 10, 132 12 of 13
20. Islam, M.R.; Chauhan, P.S.; Kim, Y.; Kim, M.; Sa, T. Community level functional diversity and enzyme
activities in paddy soils under different long-term fertilizer management practices. Biol. Fertil. Soils. 2010,
47, 599–604. [CrossRef]
21. Li, C.; Yan, K.; Tang, L.; Jia, Z.; Li, Y. Change in deep soil microbial communities due to long-term fertilization.
Soil Biol. Biochem. 2014, 75, 264–272. [CrossRef]
22. Zhang, X.; Zhang, Q.; Liang, B.; Li, J. Changes in the abundance and structure of bacterial communities in
the greenhouse tomato cultivation system under long-term fertilization treatments. Appl. Soil. Ecol. 2017,
121, 82–89. [CrossRef]
23. Chen, M.; Chen, Y.; Dong, S.; Lan, S.; Zhou, H.; Tan, Z. Mixed nitrifying bacteria culture under different
temperature dropping strategies: Nitrification performance, activity, and community. Chemosphere 2018, 195,
800–809. [CrossRef] [PubMed]
24. Naghdi, M.; Cledon, M.; Brar, S.K.; Ramirez, A.A. Nitrification of vegetable waste using nitrifying bacteria.
Ecol. Eng. 2018, 121, 83–88. [CrossRef]
25. King, K.W.; Smith, P.H. Comparisons of two media proposed for the isolation of bacteria from the rumen.
J. Bacteriol. 1955, 70, 726. [CrossRef]
26. Seki, H. Microbial biomass on particulate organic matter in seawater of the euphotic zone. Appl. Microb.
1970, 19, 960–962. [CrossRef]
27. Bossio, D.A.; Scow, K.M. Impacts of carbon and flooding on soil microbial communities: Phospholipid fatty
acid profiles and substrate utilization patterns. Appl. Environ. Microb. 1995, 61, 4043–4050. [CrossRef]
28. Joseph, S.J.; Hugenholtz, P.; Sangwan, P.; Osborne, C.A.; Janssen, P.H. Laboratory cultivation of widespread
and previously uncultured soil bacteria. Appl. Environ. Microb. 2003, 69, 7210–7215. [CrossRef]
29. Smalla, K.; Wachtendorf, U.; Heuer, H.; Liu, W.T.; Forney, L. Analysis of BIOLOG GN substrate utilization
patterns by microbial communities. Appl. Environ. Microb. 1998, 64, 1220–1225. [CrossRef]
30. Shendure, J.; Ji, H. Next-generation DNA sequencing. Nat. Biotechnol. 2008, 26, 1135–1145. [CrossRef]
31. Smets, W.; Leff, J.W.; Bradford, M.A.; McCulley, R.L.; Lebeer, S.; Fierer, N. A method for simultaneous
measurement of soil bacterial abundances and community composition via 16S rRNA gene sequencing. Soil
Biol. Biochem. 2016, 96, 145–151. [CrossRef]
32. Chávez-Romero, Y.; Navarro-Noya, Y.E.; Reynoso-Martínez, S.C.; Sarria-Guzmán, Y.; Govaerts, B.; Verhulst, N.
16S metagenomics reveals changes in the soil bacterial community driven by soil organic C, N-fertilizer and
tillage-crop residue management. Soil Tillage Res. 2016, 159, 1–8. [CrossRef]
33. Ansola, G.; Arroyo, P.; de Miera, L.E.S. Characterisation of the soil bacterial community structure and
composition of natural and constructed wetlands. Sci. Total Environ. 2014, 473–474, 63–71. [CrossRef]
[PubMed]
34. Daquiado, A.R.; Kuppusamy, S.; Kim, S.Y.; Kim, J.H.; Yoon, Y.E.; Kim, P.J. Pyrosequencing analysis of bacterial
community diversity in long-term fertilized paddy field soil. Appl. Soil Ecol. 2016, 108, 84–91. [CrossRef]
35. Dai, H.; Chen, Y.; Yang, X.; Cui, J.; Sui, P. The effect of different organic materials amendment on soil bacteria
communities in barren sandy loam soil. Environ. Sci. Pollut. Res. 2017, 24, 24019–24028. [CrossRef]
36. Bao, S.D. Analytical Methods of Soil Agrochemistry, 3rd ed.; China Agricultural Press: Beijing, China, 1999.
(In Chinese)
37. Edgar, R.C. UPARSE: Highly accurate OTU sequences from microbial amplicon reads. Nat. Methods 2013,
10, 996–998. [CrossRef]
38. Cole, J.R.; Wang, Q.; Cardenas, E.; Fish, J.; Chai, B.; Farris, R.J. The Ribosomal Database Project: Improved
alignments and new tools for rRNA analysis. Nucleic Acids Res. 2009, 37, D141–D145. [CrossRef]
39. Wang, Q.; Garrity, G.M.; Tiedje, J.M.; Cole, J.R. Naive Bayesian Classifier for Rapid Assignment of rRNA
Sequences into the New Bacterial Taxonomy. Appl. Environ. Microb. 2007, 73, 5261–5267. [CrossRef]
40. Chen, C.; Zhang, J.; Lu, M.; Qin, C.; Chen, Y.; Yang, L. Microbial communities of an arable soil treated for 8
years with organic and inorganic fertilizers. Biol. Fertil. Soils 2016, 52, 455–467. [CrossRef]
41. Cooper, J.M.; Warman, P.R. Efects of three fertility amendments on soil dehydrogenase activity, organic C
and pH. Can. J. Soil Sci. 1997, 77, 281–283. [CrossRef]
42. Li, J.; Cooper, J.M.; Lin, Z.; Li, Y.; Yang, X.; Zhao, B. Soil microbial community structure and function
are significantly affected by long-term organic and mineral fertilization regimes in the North China Plain.
Appl. Soil Ecol. 2015, 96, 75–87. [CrossRef]Agronomy 2020, 10, 132 13 of 13
43. Li, X.L.; George, E.; Marschner, H. Phosphorus depletion and pH decrease at the root-soil and hyphae-soil
interfaces of VA mycorrhizal white clover fertilized with ammonium. New Phytol. 1991, 119, 397–404.
[CrossRef]
44. Wei, M.; Hu, G.; Wang, H.; Bai, E.; Lou, Y.; Zhang, A. 35 years of manure and chemical fertilizer application
alters soil microbial community composition in a Fluvo-aquic soil in Northern China. Eur. J. Soil Biol. 2017,
82, 27–34. [CrossRef]
45. Ding, X.; Han, X.; Liang, Y.; Qiao, Y.; Li, L.; Li, N. Changes in soil organic carbon pools after 10 years
of continuous manuring combined with chemical fertilizer in a Mollisol in China. Soil Tillage Res. 2012,
122, 36–41. [CrossRef]
46. Zhong, W.; Gu, T.; Wang, W.; Zhang, B.; Lin, X.; Huang, Q. The effects of mineral fertilizer and organic
manure on soil microbial community and diversity. Plant Soil 2009, 326, 511–522. [CrossRef]
47. Ahn, J.H.; Song, J.; Kim, B.Y.; Kim, M.S.; Joa, J.H.; Weon, H.Y. Characterization of the bacterial and archaeal
communities in rice field soils subjected to long-term fertilization practices. J. Microbiol. 2012, 50, 754–765.
[CrossRef]
48. Yuan, H.; Ge, T.; Zhou, P.; Liu, S.; Roberts, P.; Zhu, H. Soil microbial biomass and bacterial and fungal
community structures responses to long-term fertilization in paddy soils. J. Soil Sediments 2013, 13, 877–886.
[CrossRef]
49. Zhao, Z.B.; He, J.Z.; Geisen, S.; Han, L.L.; Wang, J.T.; Shen, J.P. Protist communities are more sensitive
to nitrogen fertilization than other microorganisms in diverse agricultural soils. Microbiome 2019, 7, 33.
[CrossRef]
50. Byss, M.; Elhottova, D.; Triska, J.; Baldrian, P. Fungal bioremediation of the creosote-contaminated soil:
Influence of Pleurotus ostreatus and Irpex lacteus on polycyclic aromatic hydrocarbons removal and soil
microbial community composition in the laboratory-scale study. Chemosphere 2008, 73, 1518–1523. [CrossRef]
51. Lazcano, C.; Gómez-Brandón, M.; Revilla, P.; Domínguez, J. Short-term effects of organic and inorganic
fertilizers on soil microbial community structure and function. Biol. Fertil. Soils 2012, 49, 723–733. [CrossRef]
52. Lauber, C.L.; Hamady, M.; Knight, R.; Fierer, N. Pyrosequencing-based assessment of soil pH as a predictor
of soil bacterial community structure at the continental scale. Appl. Environ. Microbiol. 2009, 75, 5111–5120.
[CrossRef] [PubMed]
53. Rousk, J.; Baath, E.; Brookes, P.C.; Lauber, C.L.; Lozupone, C.; Caporaso, J.G. Soil bacterial and fungal
communities across a pH gradient in an arable soil. ISME J. 2010, 4, 1340–1351. [CrossRef] [PubMed]
© 2020 by the authors. Licensee MDPI, Basel, Switzerland. This article is an open access
article distributed under the terms and conditions of the Creative Commons Attribution
(CC BY) license (http://creativecommons.org/licenses/by/4.0/).You can also read