Dynamics of humus forms and soil characteristics along a forest altitudinal gradient in Hyrcanian forest - SISEF ...
←
→
Page content transcription
If your browser does not render page correctly, please read the page content below
iForest                                                                                                  Research Article
                                                                                                       doi: 10.3832/ifor3444-013
                                                                                                                vol. 14, pp. 26-33
         Biogeosciences and Forestry

Dynamics of humus forms and soil characteristics along a forest
altitudinal gradient in Hyrcanian forest

Mohammad Bayranvand (1),                          Humus forms are good indicators of environmental conditions and thus impor-
                                                  tant in forest ecological processes. Altitudinal gradients are considered as nat-
Moslem Akbarinia (1),                             ural laboratory for evaluating soil ecological processes and humus form distri-
Gholamreza Salehi Jouzani (2),                    bution. The objective of this study was to evaluate the macromorphology of
Javad Gharechahi (3),                             humus forms along an altitudinal gradient (0-2000 m a.s.l.) covered with plain
Giorgio Alberti (4)                               forest, mixed and pure forests and forest-grassland ecotone, in Alborz Moun-
                                                  tains in northern Iran. In total, 225 humus profiles were evaluated. Forest
                                                  stand variables including tree density, basal area, crown density, and height,
                                                  forest floor and soil physico-chemical properties along with biological features
                                                  were measured. We found that altitudinal gradients influence both humus
                                                  forms distribution and soil properties but with different mechanisms. While
                                                  soil properties (i.e., temperature, pH, CaCO3, soil N content, soil C/N and mi-
                                                  crobial biomass N) were significantly correlated with altitude, the forest floor
                                                  properties were more influenced by tree species composition. Particularly, the
                                                  abundance of Mull was decreased in plain mixed forests compared to mountain
                                                  pure forests, whereas the frequency of Amphi was increased. Moreover, Oligo-
                                                  mull and Leptoamphi were abundant in mixed beech forests, while Eumacro-
                                                  amphi, Eumesoamphi and Pachyamphi were only observed in pure beech for-
                                                  ests. Such a distribution influenced soil fertility where higher values of nitro-
                                                  gen (N), microbial biomass nitrogen (MBN) and pH were observed at lower alti-
                                                  tudes under mixed forests compared to pure forests at higher altitudes.

                                                  Keywords: Altitude Gradient, Plant-humus-soil Relationships, Humus Systems,
                                                  Soil Microbial Biomass

Introduction                                    soil fertility (Salmon 2018).                   of different humus forms. On the other
  Forest humus is an indicator of the exist-      The current classification systems en-        hand, altitude through changes in tempera-
ing environmental conditions (Ponge 2013),      abled to distinguish five humus systems         ture and precipitation, affects the distribu-
because it is the result of complex interac-    and sixteen humus forms in terrestrial eco-     tion of forest species, forest floor quality
tions between stand species composition         systems (Jabiol et al. 2013, Zanella et al.     and quantity (Bayranvand et al. 2017b), soil
(Labaz et al. 2014), soil properties (Ponge     2018). Humus forms can be directly identi-      characteristics (Ponge et al. 2011), micro-
et al. 2011), soil micro- and macro-organ-      fied in field without the need for expensive    organism types and activities (Zhang et al.
isms’ activities and environmental factors      laboratory tools (Zanella et al. 2018).         2013, Xu et al. 2015), thus contributing in
(Badía-Villas & Girona-García 2018). Since        According to Zanella et al. (2011), temper-   humus forms (Ascher et al. 2012, Salmon
humus forms show specific morphological         ature, precipitation and vegetation compo-      2018). Altitudinal gradients are considered
patterns (layering and structure – Jabiol et    sition are the three most important factors     as natural laboratories for evaluating soil
al. 2013), they are useful tool for assessing   affecting biological degradation of organic     ecological processes (Labaz et al. 2014, Bo-
the health status of forests and the overall    residues and contributing in the formation      jko & Kabala 2017). Understanding the
                                                                                                complex interactions between soil and
                                                                                                plant communities along altitude gradients
   (1) Faculty of Natural Resources and Marine Sciences, Tarbiat Modares University, 46417-     can be used for the prediction of soil micro-
76489, Noor, Mazandaran (Iran); (2) Microbial Biotechnology Department, Agricultural            bial activity and forest floor decomposition
Biotechnology Research Institute of Iran (ABRII), Agricultural Research, Education and Exten-   (Bojko & Kabala 2017, Xu et al. 2015).
sion Organization (AREEO), Fahmideh Blvd., P.O. Box:31535-1897, Karaj (Iran); (3) Human           The natural broadleaf forests in northern
Genetics Research Center, Baqiyatallah University of Medical Sciences, Tehran (Iran); (4) De-   Iran are similar to those in central Europe,
partment of Agri-food, Environmental and Animal Sciences, University of Udine, v. delle         northern Turkey and the Caucasus. In these
Scienze 206, 33100 Udine (Italy)                                                                forest ecosystems, composition of tree
                                                                                                species changes with elevation (Bayran-
@ Gholamreza Salehi Jouzani (gsalehi@abrii.ac.ir)                                               vand et al. 2017a). Due to their unique
                                                                                                topographical conditions compared to the
Received: Apr 09, 2020 - Accepted: Nov 02, 2020                                                 oldest forest in Asia, Alborz mountains of-
                                                                                                fers the potential to assess changes in for-
Citation: Bayranvand M, Akbarinia M, Salehi Jouzani G, Gharechahi J, Alberti G (2021).          est types and humus forms with altitude
Dynamics of humus forms and soil characteristics along a forest altitudinal gradient in         (Naqinezhad et al. 2013). So far, few stud-
Hyrcanian forest. iForest 14: 26-33. – doi: 10.3832/ifor3444-013 [online 2021-01-10]            ies investigated the pattern of humus
                                                                                                forms, forest floor features and soil micro-
Communicated by: Maurizio Ventura                                                               bial biomass along altitudinal gradients
                                                                                                (Bayranvand et al. 2017b, Waez-Mousavi

© SISEF https://iforest.sisef.org/                                   26                                                   iForest 14: 26-33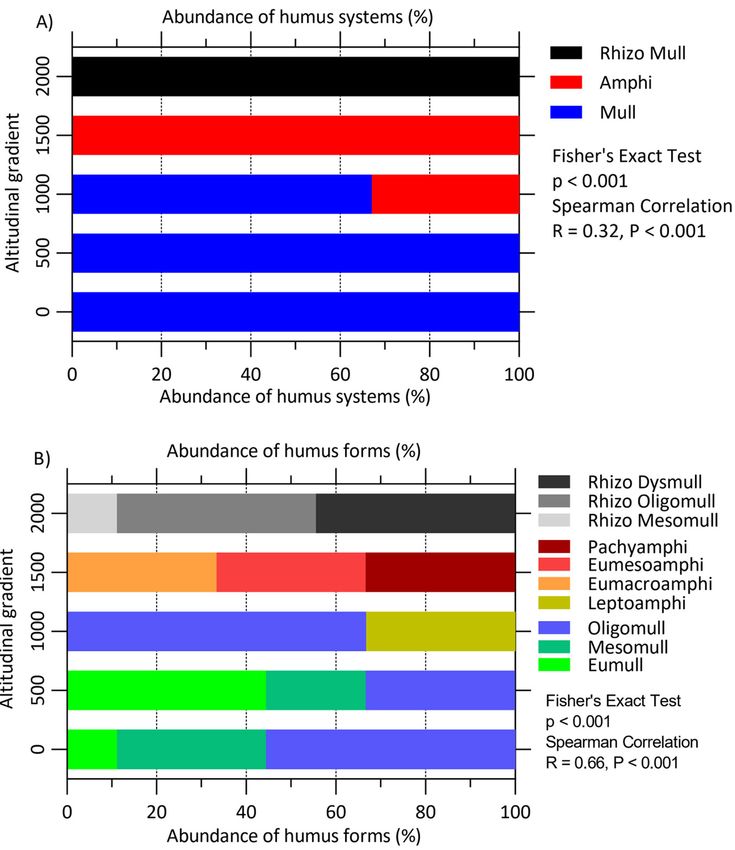
Bayranvand M et al. - iForest 14: 26-33

                                        2018).                                                 m a.s.l.): Beech (Fagus orientalis Lipsky),             Jurassic and lower Cretaceous period (Kha-
iForest – Biogeosciences and Forestry

                                          In this study, we described humus mor-               Ash (Fraxinus excelsior L.), Parrotia persica           leghi et al. 1997, IUSS Working Group 2015).
                                        phology, forest floor, soil quality, microbial         C. A. Meyer, Acer (Acer velutinum Boiss)
                                        biomass carbon (MBC) and nitrogen (MBN)                and Carpinus betulus; (3) middle mountain-              Experimental design, tree investigation,
                                        in five different forest types along an altitu-        ous mixed forests (MMMF – 1000 m a.s.l.):               humus identification, forest floor and
                                        dinal gradient from 0 to 2000 m a.s.l. (i.e.,          Beech (Fagus orientalis Lipsky), Ash (Fraxi-            soil sampling
                                        plain forest, low, medium and high moun-               nus excelsior L.), Parrotia persica C. A.                 At each altitude (0, 500, 1000, 1500 and
                                        tainous mixed and pure forests, and forest-            Meyer, Acer (Acer velutinum Boiss) and                  2000 m a.s.l.), three 1-ha plots with at least
                                        grassland ecotone). We hypothesized that:              Carpinus betulus; (4) high mountainous                  1500 m distance were delimited. Elevation
                                        (1) increased beech species abundance and              pure forests (HMPF – 1500 m a.s.l.): Fagus              at each plot was recorded using a Garmin™
                                        decreased soil temperature along altitudi-             orientalis Lipsky; (6) forest-grassland eco-            model GPSMAP® 60Cx (Olathe, KS, USA).
                                        nal gradient strongly affect the pattern of            tone (F-GE – 2000 m a.s.l.): Hawthorn (Cra-             Aspect values were assigned using angles
                                        humus forms and organic layer thickness;               taegus sp.), Pear (Pyrus communis L.), Ap-              from 0 to 360° given by a pocket compass.
                                        (2) forest floor and soil characteristics              ple (Malus communis L.), Barberry (Berberis             In each plot, three random subplots (400
                                        change with altitude and soil fertility; (3)           crataegina), Maple-AC (Acer campestre L.).              m2) were chosen for sampling. All living
                                        specific soil chemical and biological fea-               The mean annual temperature at PMF,                   trees were counted at each subplot. The di-
                                        tures correlate with humus forms and veg-              LMMF, MMMF, HMPF and F-GE are 19.2,                     ameter at breast-height (DBH, 1.3 m) and
                                        etation characteristics.                               16.3, 14, 11.6, and 8 °C, respectively. For ev-         total height (> 1.3 m) of all living trees were
                                                                                               ery 1000 m increase in altitude, an average             measured with a diameter tape and Im-
                                        Material and methods                                   3-5 °C decrease in temperature has been                 pulse® 200 Laser Hypsometer (Laser Tech-
                                                                                               recorded. The mean annual precipitations                nology Inc., Centennial, CO, USA), respec-
                                        Site description                                       are 898, 843, 805, 746 and 844 mm in PMF,               tively (Tab. 1).
                                          With an area of about 14,000 hectares,               LMMF, MMMF, HMPF and F-GE, respec-                        The experiment was conducted during
                                        the Vaz catchment forests are located in               tively (Karger et al. 2017). About 35-45% of            April 2018. Humus profiles (Organic: OL,
                                        the northern Alborz mountain, beside the               the rainfall occurs in autumn (from Sep-                OF, OH; and organic-mineral: AH) and diag-
                                        Caspian Sea, in northern Iran (36° 16′ N, 52°          tember to November), 18-35% in winter                   nostic horizons were described and sam-
                                        48′ E – Fig. S1 in Supplementary material).            (December to February), and the rest (10-               pled at the corners and at the center of
                                        The study area was located along an alti-              20%) in summer (June to August; Noushahr                each sub-plot using a metal frame (30×30
                                        tude gradient 0-2000 m a.s.l. Forest vege-             city meteorological station, 1977-2010 – Fig.           cm). The morphological characteristics of
                                        tation in this area largely depends on alti-           S2 in Supplementary material). Based on                 each humus profile were described accord-
                                        tude and therefore five different forest               World Reference Basis (WRB) and USDA                    ing to Zanella et al. (2018). The basilar ele-
                                        types could be distinguished (Khaleghi et              Soil Taxonomies, plain forest soils were                ments of the adopted humus classifications
                                        al. 1997): (1) plain mixed forests (PMF – 0 m          classified as Cambisols (Inceptisol), low               are reported in Tab. S1 (Supplementary ma-
                                        a.s.l.): Ironwood (Parrotia persica C.A. Mey-          and medium altitudes as Luvisols (Alfisols),            terial). Humus layer thickness (HLT) was
                                        er), Oak (Quercus castaneifolia C. A. M.) and          and higher altitudes as Phaeozems (Mol-                 also measured with a tape from the forest
                                        Hornbeam (Carpinus betulus L.); (2) low                lisols) and Cambisols, developed on dolo-               floor surface to the top of the mineral soil.
                                        mountainous mixed forests (LMMF – 500                  mite limestones belonging to the upper                  The earthworm ecological groups (i.e., Epi-

                                         Tab. 1 - Mean ± standard error (n=9) and Pearson’s correlation coefficients (R cor) of vegetation characteristics along the altitudinal
                                         gradient in Hyrcanian forests. (PMF): plain mixed forests; (LMMF): low mountainous mixed forests; (MMMF): middle mountainous
                                         mixed forests; (HMPF): high mountainous pure forests; (F-GE): forest-grassland ecotone. Different letters indicate significant differ-
                                         ences (p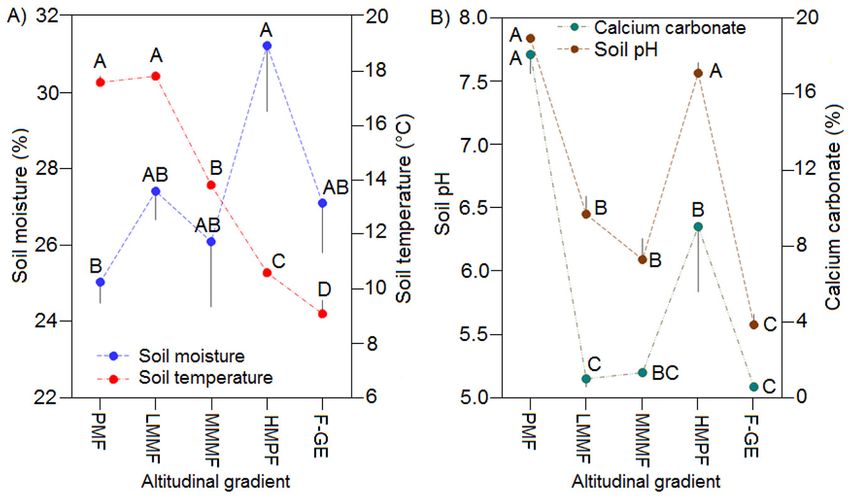
Humus and soil dynamics along a forest altitudinal gradient
geic, Anecic and Endogeic) were also iden-
iForest – Biogeosciences and Forestry
Tab. 2 - Correlation of vegetation, humus forms and soil features with PCA compo-
tified (Bohlen 2002). Forest floor samples
nents. (*): p < 0.05; (**): p < 0.01.
including OL and OF layers were finely
mixed before sampling. To remove soil, the
forest floor samples were soaked gently in Features PC1 PC2 Features PC1 PC2
tap water for a few seconds (this is not rec- Tree density -0.56 ** 0.25 Eumacroamphi -0.33 -0.20
ommended for samples dominated by OH Tree basal area 0.39 * -0.40 Eumesoamphi -0.35 * -0.37 *
layers) and then dried at 70 °C for 48 h.
Tree crown density 0.60 ** -0.67 ** Pachyamphi -0.38 * -0.25
Dried forest floor samples were finely
grounded/homogenized with an electric Mean tree height 0.34 * -0.76 ** FFC -0.32 -0.50 **
mixer and analyzed. OL -0.65 ** -0.63 ** FFN 0.16 0.07
Top mineral soil samples (depth 0-10 cm) OF -0.75 ** -0.32 FFC/N -0.24 -0.23
were collected after removal of the or-
ganic layers. Using a standard soil auger (5 OH -0.67 ** -0.50 ** SM -0.35 * -0.26
cm inner diameter). Soil temperature (ST) AH 0.57 ** -0.43 * ST 0.89 ** -0.25
was measured at a depth 0-10 cm with a Eumull 0.33 0.04 pH 0.23 -0.61**
portable temperature probe (model TA-
Mesomull 0.25 0.03 CaCO3 0.20 -0.32
288). Since no rainfall occurred during the
sampling time, temperature was quite con- Oligomull 0.54 ** -0.09 SOC -0.42 * -0.75 **
stant during the day. Rhizo Mesomull -0.12 0.25 SN 0.24 -0.55 **
To determine microbial biomass, the soil Rhizo Oligomull -0.24 0.54 ** SC/N -0.63 ** -0.23
samples were immediately transferred to
sterile bags, placed in a cooled and insu- Rhizo Dysmull -0.24 0.54 ** MBC -0.004 -0.47 **
lated container, transferred to the labora- Leptoamphi -0.04 -0.22 MBN 0.70 ** -0.02
tory and stored at 4 °C. Soil samples used
for physico-chemical analyses were air-
dried and passed through a 2-mm sieve. In meter (ThermoFischer Scientific, Waltham, and biological properties along the altitudi-
total, 225 samples were analyzed in this MS, USA). Calcium carbonate (CaCO3) con- nal gradient. Means were compared using
study (5 altitude levels × 3 plots × 3 sub- tent was determined by the neutralization Tukey HSD post-hoc test. Abundance of hu-
plots × 5 profiles). The soils and forest titration method. Soil organic carbon (SOC) mus systems and forms in relation to the
floors collected from five elevation level and soil nitrogen (SN) contents were de- altitudinal gradient was tested by Fisher’s
were mixed and the mean of the humus termined based on the modified Walkley- exact test. Pearson’s correlation analyses
layers and percentage of humus form were Black (Allison 1965) and semi Micro-Kjel- were performed to correlate the vegeta-
used to compute humus layer thickness dahl methods (Bremner & Mulvaney 1982), tion variables and forest floor and soil char-
and humus form classification, respective- respectively. The microbial biomass carbon acteristics across the altitudinal gradient.
ly. (MBC) and microbial biomass nitrogen For non-normally distributed data, the
(MBN) were assessed through the fumiga- Spearman’s correlation analysis was per-
Laboratory analysis of forest floor and tion-extraction method with a conversion formed. All statistical analyses were con-
soil physico-chemical and biological factor of 0.45 for microbial C and 0.54 for ducted using SPSS® v. 16 (IBM Corp., Ar-
properties microbial N (Brookes et al. 1985, Sparling et monk, NY, USA). Multivariate correlations
Forest floor carbon (FFC) and nitrogen al. 1998). were analyzed using factor analysis based
(FFN) contents were determined through on principal components analyses (PCA)
dry combustion and semi micro-Kjeldahl Statistical analysis performed by the software PC-Ord v. 5.0
techniques, respectively (Bremner & Mul- The normality of data was checked by the (McCune & Mefford 1999).
vaney 1982). Soil texture was determined Kolmogorov Smirnov test (P >0.05), and
using the Bouyoucos hydrometer method the homogeneity of variances was tested Results
(Bouyoucos 1962). Soil moisture (SM) was using the Levene’s test (P >0.05). One-way PCA revealed significant changes in all
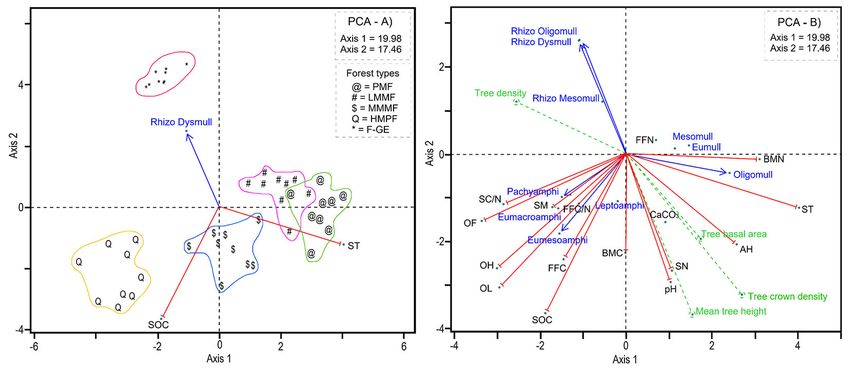
measured after drying the soil samples in analysis of variance (ANOVA) was per- studied soil and humus characteristics
an oven at 105 °C for 24 h. Soil pH was mea- formed to analyze differences in vegeta- along the altitudinal gradient (Tab. 2, Fig.
sured in a ratio of 1:2.5 (M/V) of soil/water tion properties, humus layer thickness 1A-B), with greater than 45 percent of vari-
using an Orion™ Analyzer Model 901 pH (HLT), forest floor, soil physical, chemical ations being explained. The left side of the
Fig. 1 - Principle compo-
nent analysis (PCA)
based on the correlation
matrix to identify the
relationships between
forest types, humus
forms, forest floor and
soil properties (A-B).
(PMF): plain mixed
forests; (LMMF): low
mountainous mixed
forests; (MMMF): middle
mountainous mixed
forests; (HMPF): high
mountainous pure
forests; (F-GE): forest-
grassland ecotone.
iForest 14: 26-33 28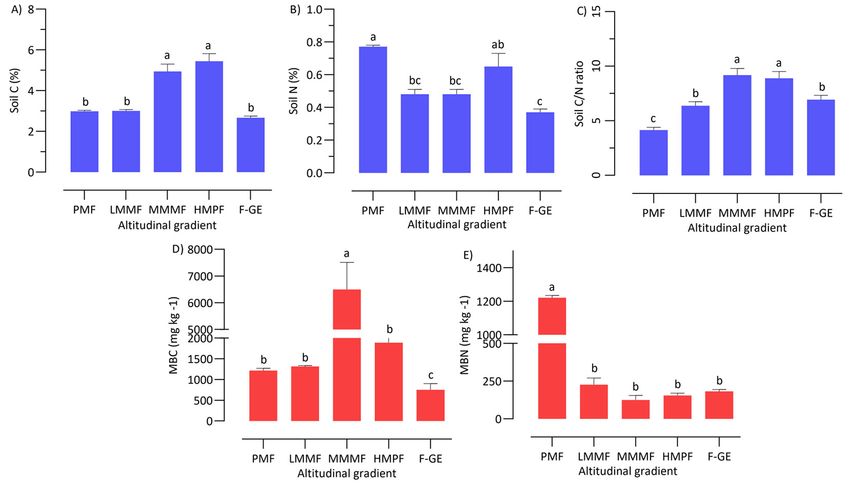
Bayranvand M et al. - iForest 14: 26-33
tionship with leptoamphi humus and MBC
iForest – Biogeosciences and Forestry
Fig. 2 - Abun- (Fig. 1B). In addition, the forest-grassland
dance of humus ecotone with Rhizo-Mull humus forms did
systems (A) and not show any relationship with soil proper-
forms (B) in rela- ties (Fig. 1B).
tion to altitudi- As expected, canopy composition, stand
nal gradients features, humus forms and their character-
(n=45). istics changed with altitude (Tab. 1, Tab. 2).
In the plain forest, ironwood was the domi-
nant species followed by oak and horn-
beam. However, ironwood density de-
creased with altitude and this species was
totally absent at altitudes above 1500 m
a.s.l. At intermediate altitudes (500 and
1000 m), beech, ash and maple were the
dominant species, while at higher altitude
(1500 m) only beech was present. Above
2000 m a.s.l., hawthorn was the most com-
mon species. Total tree density significantly
increased with altitude (R = 0.54, p < 0.01),
while basal area (R = -0.39, p < 0.01), crown
density (R = -0.79, p < 0.01) and mean tree
height (R = -0.52, p < 0.01) decreased.
Altitudinal gradient significantly affected
the abundance of the humus systems (p <
0.001) and humus forms (p < 0.001 – Fig.
2A). Mull was the dominant system below
1000 m a.s.l.; Amphi appeared at 1000 m
and dominated at 1500 m; Rhizo Mull was
dominant under F-GE at 2000 m a.s.l. Oligo-
mull was the most common form at 0 and
PC axis 1 reflects low quality of forest floor height), improved forest floor (i.e., N) and 1000 m and Eumull at 500 m (Fig. 2B). At
(i.e., high FFC, FFC/N and thickness), and soil characteristics (N content, MBN, pH higher altitudes, no dominant humus form
soil (i.e., higher values of SOC and C/N) and CaCO3). In these conditions, the fre- was detected. In fact, Eumacro, Eumeso
which resulted in the formation of Amphi quency of the mull humus forms was and Pachyamphi humus forms were equal-
humus forms under high mountainous higher (plain mixed and low mountainous ly represented at 1500 m, while at 2000 m
pure forests (Fig. 1B). The right side of PC mixed forests – Fig. 1B). Middle mountain- Rhizo Mesomull, Rhizo Oligomull and Rhizo
axis 1, instead, corresponds to conditions ous mixed forests showed intermediate Dysmull were equally abundant (Fig. 2B).
with higher forest productivity (tree basal conditions with regard to the forest floor The thickness of the organic layers includ-
area, tree crown density and mean tree and soil properties and thus a strong rela- ing OL, OF, OH significantly increased with
altitude (R = 0.36, p < 0.05; R = 0.53, p <
0.01; R = 0.36, p < 0.05; respectively),
Tab. 3 - One-way analysis of variance (ANOVA) and Pearson’s correlation coefficients whereas the organic-mineral thickness
(Rcor) of forest floor and soil characteristics along the altitudinal gradients. (*): p < (AH) decreased (R = -0.62, p < 0.01 – Tab. 3,
0.05; (**): p < 0.01. Fig. 3). The thickness of OL and OF at 1500
m was approximately 2.5 times greater
Humus and than that at the other altitudes (p < 0.001);
Variables Abbr. F test P value Rcor
soil properties the highest thickness of OH was recorded
Organic litter (cm) OL 81.86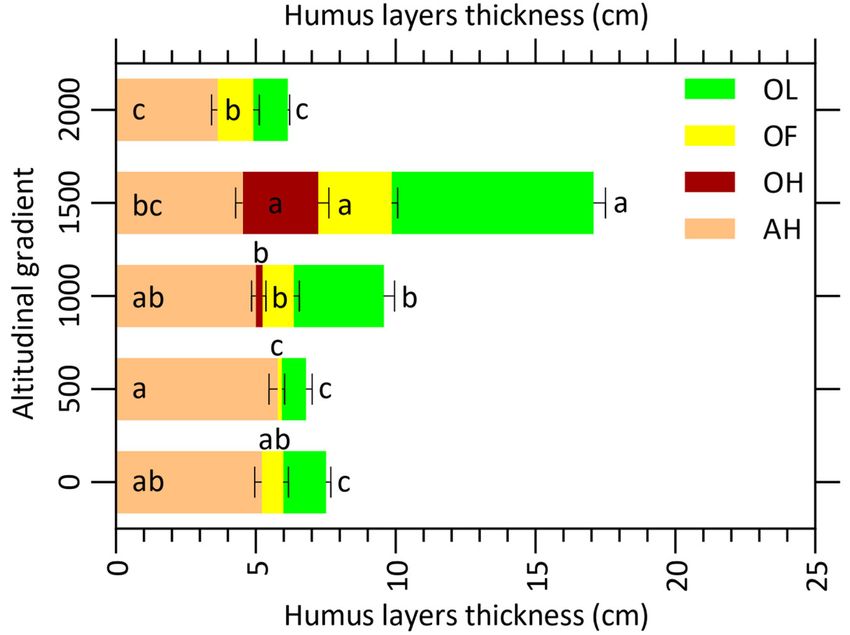
Humus and soil dynamics along a forest altitudinal gradient

est was recorded in high mountainous pure

                                                                                                                                               iForest – Biogeosciences and Forestry
                                                                                                                         Fig. 3 - Organic
forests (Fig. 5A, Tab. 3). On the contrary,
                                                                                                                         (OL, OF and OH)
soil pH (R= -0.51, p < 0.01), calcium carbon-
                                                                                                                         and organic-min-
ate (R = -0.45, p < 0.01), soil N (R = -0.39, p
                                                                                                                         eral (AH) humus
< 0.01) and microbial biomass nitrogen (R =
                                                                                                                         layers thickness
-0.70, p < 0.01) decreased with altitude,
                                                                                                                         along the altitu-
while soil C/N ratio increased (R = 0.53, p <
                                                                                                                         dinal gradient.
0.01). The highest soil pH and CaCO 3 con-
                                                                                                                         Error bars indi-
centration were observed in plain mixed
                                                                                                                         cate standard
forests and high mountainous pure forests
                                                                                                                         error (n = 45).
and the lowest in forest-grassland ecotone
(Fig. 5B). The highest concentrations of soil
C, C/N ratios and BMC values were mea-
sured under high and middle mountainous
forests, whereas plain mixed forests
showed the highest soil N concentrations
and BMN values (Fig. 6).

Discussion
  We showed that there exist significant as-
sociations between altitudinal gradient and
forest characteristics including tree compo-      published (Naqinezhad et al. 2013, Bayran-     creased with altitude, while Amphi forms
sition, stem density, tree height in Hyrca-       vand et al. 2018). The distribution of humus   increased. With respect to the forest type,
nian forest in northern Iran, consistently        forms also changed with altitudinal gradi-     our results showed that Oligomull and Lep-
with findings of other studies previously         ent. Particularly, Mull humus forms de-        toamphi were dominant in mixed beech

 Fig. 4 - Mean floor carbon (A), nitrogen (B), and C/N ratio (C) among the altitude levels. Different letters indicate significant differ -
 ences (p < 0.05) according to the ANOVA and Tukey HSD test. Error bars indicate standard error (n=9). (PMF): plain mixed forests;
 (LMMF): low mountainous mixed forests; (MMMF): middle mountainous mixed forests; (HMPF): high mountainous pure forests;
 (F-GE): forest-grassland ecotone.

     Fig. 5 - Mean soil mois-
     ture and soil tempera-
    ture (A), pH and CaCO3
  (B) among the altitudes.
  Different letters indicate
  significant differences (p
  < 0.05) based on ANOVA
        and Tukey HSD test.
   Error bars indicate stan-
   dard error (n=9). (PMF):
        plain mixed forests;
   (LMMF): low mountain-
          ous mixed forests;
   (MMMF): middle moun-
     tainous mixed forests;
   (HMPF): high mountain-
  ous pure forests; (F-GE):
       forest-grassland eco-
                        tone.

iForest 14: 26-33                                                                                                                        30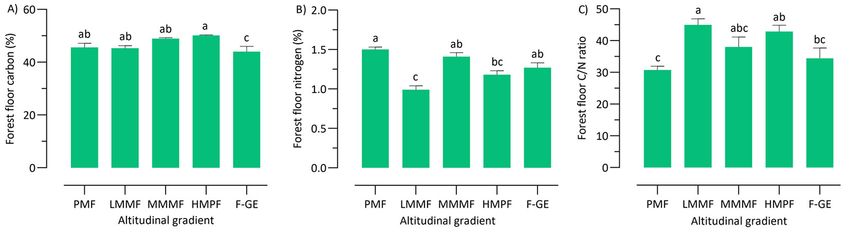
Bayranvand M et al. - iForest 14: 26-33
iForest – Biogeosciences and Forestry
Fig. 6 - Mean soil carbon
(A), nitrogen (B), C/N ratio
(C), BMC (D) and BMN (E)
along the altitude gradient.
Different letters indicate
significant differences (P <
0.05) according to the
ANOVA and Tukey HSD
test. Error bars indicate
standard error (n=9).
(PMF): plain mixed forests;
(LMMF): low mountainous
mixed forests; (MMMF):
middle mountainous mixed
forests; (HMPF): high
mountainous pure forests;
(F-GE): forest-grassland
ecotone.
forests, while in pure beech forests Eu- Amphi humus form under pure beech for- C, and N content), earthworm and micro-
macroamphi, Eumesoamphi and Pachyam- est (1500 m) could likely be due to high soil bial activity were mostly controlled by cli-
phi were the dominant forms. Previous pH (> 7.5) resulted from high CaCO 3concen- mate. Our results support the idea that soil
study by Waez-Mousavi (2018) also re- trations (Li et al. 2018). The CaCO3 concen- properties including temperature, pH,
ported that Mull and Amphi are the most tration has probably a positive impact on CaCO3, soil N content, soil C/N and micro-
dominant humus systems in the Hyrcanian the forest floor decomposition rate and bial biomass N are significantly correlated
forests. In mixed beech stands, Waez-Mou- soil microbial activity (Guo et al. 2019) and with altitude, while most forest floor prop-
savi & Habashi (2012) reported the domi- could likely facilitate the transition from erties are not directly influenced by tem-
nance of Mull and Amphi humus systems. Moder to Amphi form (Labaz et al. 2014, perature, but affected by tree species com-
Both environmental conditions and tree Bonifacio et al. 2018). position. In fact, litter quality influences
species composition influence humus for- Previous studies showed that climatic both decomposition rates and the dynamic
mation and its characteristics. A significant (moisture and temperature) and biotic fac- of nutrient mineralization (Lucas-Borja et
change in soil temperature, moisture and tors (species type and richness) are impor- al. 2019). Previous studies have argued that
species composition was noted in our alti- tant factors influencing humus accumula- higher forest floor N concentrations are as-
tudinal gradient. Previous study revealed tion (Zanella et al. 2011, Labaz et al. 2014, sociated with faster litter decomposition
that a decrease in mean temperature asso- Badía-Villas & Girona-García 2018). In our rates (Kooch & Bayranvand 2017, Lucas-
ciates with a decline in Mull humus form study, the thickness of OL, OF, OH layers Borja et al. 2019). A decrease in forest floor
and an increase in Amphi humus (Ponge et significantly were increased, while that of quality (high C content and high C/N ratio)
al. 2011). In agreement to our finding in AH was decreased. The more favorable was reported to associate with a higher hu-
plain mixed forest, Ponge et al. (2011) conditions for organic matter decomposi- mus layer thickness and a decreased de-
noted that Mull systems are more frequent tion in plain mixed forests (i.e., high tem- composition rate in beech dominated for-
at higher tree species diversity and under perature, good soil moisture and high litter ests at high altitudes (Bayranvand et al.
rich trophic conditions. In contrary, under quality) is likely the cause (Salmon 2018). 2017b). In fact, beech litter is known for
low tree species richness and in colder en- Similarly, Bonifacio et al. (2018) also having a high lignin/N ratio and a relatively
vironments, Moder and Amphi humus sys- showed that the OH layer thickness in low contents of basic cations and N (Boni-
tems with OF and OH layers are dominant beech forests with a low litter quality is facio et al. 2018). In agreement with our
(Badía-Villas & Girona-García 2018). Labaz higher than in hornbeam, maple and ash findings, low humus layer thickness is re-
et al. (2014) showed that Amphi humus forests (Labaz et al. 2014). Thus, the higher lated to high quality floors in maple, iron-
forms can be found in cold conditions OH layer thickness at 1500 m a.s.l. found in wood, alder and hornbeam (Kooch & Bay-
where organic matter decomposition is this study can be attributed to the low ranvand 2017, Bayranvand et al. 2017b).
slower. Previous study by Waez-Mousavi & temperature in this elevation level, which Forest floor C/N ratio and N content are
Habashi (2012) indicated that Mull humus slow down mineralization rates (Badía-Vil- the two most important factors influencing
forms are abundant under forest types las & Girona-García 2018), decrease litter litter decomposition and nutrient release
with higher floor quality and decomposi- quality under beech (Bayranvand et al. (Lucas-Borja et al. 2019).
tion rate, while Amphi and Moder humus 2017a) and higher soil moisture (Zanella et Badía-Villas & Girona-García (2018) re-
forms are observed under beech forest al. 2011). ported that forest floor N in mountain for-
type with low floor quality (high C and low The chemical composition of humus and est in Spain is decreased during shift from
N – Bayranvand et al. 2017a). Mull humus soil are the result of the interaction of Mull to Amphi forms with increasing eleva-
forms are biologically active (Endogeic and many factors including topography, cli- tion. Ponge et al. (2011) measured lower C
Anecic with high activity) with fine-granular mate, tree cover and soil microbial commu- content in Mull than in other humus forms.
structure, which have low SOC content nities (Ponge et al. 2011). Shedayi et al. It could be speculated that Mull forms de-
compared to humus forms with OF and OH (2016) showed that altitude has a low im- compose faster and introduce more N into
layers (Jabiol et al. 2013, Labaz et al. 2014). pact on soil organic carbon and nitrogen, the soil. Zanella et al. (2011) argued that
Moder forms are abundant in beech domi- while vegetation cover explains most of forest floor and soil C/N ratios in Mull are
nated forest with low soil pH (≈ 5.5), while the measured variations. Bayranvand et al. usually lower than in Amphi and the C/N is
Mull forms are absent in non-beech stands (2017a) reported that, although tree spe- an important indicator for the decomposi-
(Bayranvand et al. 2018). The increased cies affect soil chemical properties (i.e., pH, tion rate and nutrient cycling in the humus
31 iForest 14: 26-33Humus and soil dynamics along a forest altitudinal gradient
and soil. Forest floor nitrogen; FFC/N: Forest floor C/ 035
iForest – Biogeosciences and Forestry
Our data also showed a significant de- N; SM: Soil moisture; ST: Soil temperature; Bohlen PJ (2002). Earthworms. Oligochaeta: Ar-
crease in soil MBN under different canopy pH: Soil pH; CaCO 3: Calcium carbonate; chipheretima, Metapheretima, Planapheretima,
compositions along the elevation gradient. SOC: Soil organic carbon; SN: Soil nitrogen; Pleinogaster and Polypheretima. Encyclopedia
MBN was significantly higher in mixed for- SC/N: Soil C/N; MBC: Microbial biomass car- of Soil Science, Bulletin of the British Museum
est types (i.e., PMF) at the lowest elevation bon; MBN: Microbial biomass nitrogen. Natural History, Archbold Biological Station,
than in pure stands at the highest elevation Venus, FL, USA, pp. 1-128.
levels (i.e., HMPF). This may be the result Author contributions Bojko O, Kabala C (2017). Organic carbon pools
of a greater and a more diverse litter input MB and MA conceived and designed the in mountain soils - Sources of variability and
in stands with a higher species richness or experiment. MB performed the experi- predicted changes in relation to climate and
diversity (Wang & Wang 2011). Many inves- ment. MB, GA and GS-J carried out the sta- land use changes. Catena 149: 209-220. - doi:
tigations have also documented that soil tistical analysis. MB, JG, GA and GS-J con- 10.1016/j.catena.2016.09.022
microbial community structure is primarily tributed to the data analysis and data inter- Bonifacio E, D’Amico M, Catoni M, Stanchi S
driven by soil pH and C/N ratio as the alti- pretation. MB, JG, GS-J and GA wrote and (2018). Humus forms as a synthetic parameter
tude increases. Thus, higher levels of pH, edited the manuscript. for ecological investigations. Some examples in
such as those at low elevations, may be re- the Ligurian Alps (North-Western Italy). Applied
lated to increased microbial biomass and Acknowledgements Soil Ecology 123: 568-571. - doi: 10.1016/j.apsoil.
bacterial diversity (Xu et al. 2015). Higher This research was funded by a grant pro- 2017.04.008
levels of soil temperature and N content, vided by Tarbiat Modares University (TMU) Bouyoucos GJ (1962). Hydrometer method im-
such as those at low elevations, may con- and Iran National Science Foundation proved for making particle size analysis of soils.
tribute to a larger microbial biomass (Xu et (INSF). We would like to thank Mr. J. Es- Agronomy Journal 56: 464-465. - doi: 10.2134/ag
al. 2015, Bojko & Kabala 2017, Guo et al. lamdoust, A. Khodadust, MR Soleimani, E. ronj1962.00021962005400050028x
2019). Sharifi, M. Mohammadi, and A. Daryaei for Bremner JM, Mulvaney CS (1982). Nitrogen-to-
Beech litter quality, FFC accumulation and their assistance during field samplings. We tal. In: “Methods of Soil Analysis, Part 2 (2 nd
lower earthworm activity are main factors also thank M. Naeiji and M. Haghdoust for edn)” (Page AL, Miller RH, Keeney RR eds).
affecting soil quality in this forest system. their assistance during laboratory analysis American Society of Agronomy, Madison WI,
PMF was correlated with Mull humus and of the soil samples. The authors also ex- USA, pp. 595-624.
higher forest floor and soil quality (high press their sincere appreciation to Augusto Brookes PC, Landman A, Pruden G, Jenkinson DS
FFN and SN; low FFC and SN). In this condi- Zanella for helping with morphological (1985). Chloroform fumigation and the release
tion, tree species composition along with identification of humus forms and Björn of soil N: a rapid direct extraction method to
high biological and microbial activities (i.e., Berg for reviewing the manuscript. measure microbial biomass nitrogen in soil. Soil
high temperature and soil water content) Biology and Biochemistry 17: 837-842. - doi:
speed up organic matter decomposition References 10.1016/0038-0717(85)90144-0
(Zaiets & Poch 2016). Mull humus forms are Allison LE (1965). Organic carbon. In: “Methods IUSS Working Group (2015). World reference
nutrient rich systems with fast nutrient cy- of Soil Analysis American Society of Agronomy. base for soil resources 2014. International soil
cling (Andreatta et al. 2011) which are asso- Part 2” (Black CA ed). American Society of classification system. World Soil Resources Re-
ciated to high earthworm activity and mi- Agronomy, Soil Science Society of America, ports no. 106, Food and Agriculture Organiza-
crobial biomass. In hornbeam and maple Madison, WI, USA, pp. 1367-1378. - doi: 10.2134/ tion of the United Nations, Rome, Italy. - doi:
trees (MMMF) forest systems, higher for- agronmonogr9.2.c39 10.1017/S0014479706394902
est floor quality and improved soil fertility Andreatta A, Ciampalini R, Moretti P, Vingiani S, Guo A, Ding L, Tang Z, Zhao Z, Duan G (2019). Mi-
support larger biological activities than in Poggio G, Matteucci G, Tescari F, Carnicelli S crobial response to CaCO3 application in an acid
pure beech forests (Kooch & Bayranvand (2011). Forest humus forms as potential indica- soil in southern China. Journal of Environmen-
2017). tors of soil carbon storage in Mediterranean tal Sciences 79: 321-329. - doi: 10.1016/j.jes.2018.
environments. Biology and Fertility of Soils 47: 12.007
Conclusion 31-40. - doi: 10.1007/s00374-010-0499-z Jabiol B, Zanella A, Ponge JF, Sartori G, Englisch
Altitudinal gradient is a key factor deter- Ascher J, Sartori G, Graefe U, Thornton B, Cec- M, Van Delft B, De Waal R, Le Bayon RC (2013).
mining the distribution of humus forms. cherini MT, Pietramellara G, Egli M (2012). Are A proposal for including humus forms in the
Soil properties (temperature, pH, CaCO 3, N humus forms, mesofauna and microflora in World Reference Base for Soil Resources (WRB-
content, C/N and MBN) were significantly subalpine forest soils sensitive to thermal con- FAO). Geoderma 192: 286-294. - doi: 10.1016/j.
correlated with altitude, while forest floor ditions?. Biology and Fertility of Soils 48: 709- geoderma.2012.08.002
properties were more influenced by tree 725. - doi: 10.1007/s00374-012-0670-9 Karger DN, Conrad O, Böhner J, Kawohl T, Kreft
species composition. Our data suggest that Badía-Villas D, Girona-García A (2018). Soil humus H, Soria-Auza RW, Zimmermann NE, Linder HP,
the abundance of Mull forms decrease changes with elevation in Scots pine stands of Kessler M (2017). Climatologist at high resolu-
from plain mixed forests to high mountain the Moncayo Massif (NE Spain). Applied Soil tion for the Earth’s land surface areas. Scien-
pure forests, whereas the frequency of Ecology 123: 617-621. - doi: 10.1016/j.apsoil.2017. tific Data 4: 170122.
Amphi humus forms increase. On the other 07.017 Khaleghi P, Abasi H, Hosani S, Frohar M, Ghelich-
hand, Oligomull and Leptoamphi are more Bayranvand M, Kooch Y, Alberti G (2018). Classi- nian H (1997). Caspian forests profile, Vaz Re-
abundant in mixed beech forests, while Eu- fication of humus forms in Caspian Hyrcanian search Forest. Ministry of Jihad-e-Production,
macroamphi, Eumesoamphi and Pachyam- mixed forests ecoregion (Iran): comparison be- Department of Education and Research, Re-
phi are observed only in pure beech tween two classification methods. Catena 165: search Institute for Forests and Rangelands,
forests. In addition, plain mixed forests 390-397. - doi: 10.1016/j.catena.2018.02.021 Tehran, Iran, pp. 380.
typically have higher quality of both forest Bayranvand M, Kooch Y, Rey A (2017a). Earth- Kooch Y, Bayranvand M (2017). Composition of
floor (i.e., N) and soil (i.e., pH, CaCO3, soil N worm population and microbial activity tempo- tree species can mediate spatial variability of C
content, soil C/N and MBN) than high ral dynamics in a Caspian Hyrcanian mixed for- and N cycles in mixed beech forests. Forest
mountainous pure one, while middle mixed est. European Journal of Forest Research 136: Ecology and Management 401: 55-64. - doi:
forests show intermediate characteristics. 447-456. - doi: 10.1007/s10342-017-1044-5 10.1016/j.foreco.2017.07.001
Bayranvand M, Kooch Y, Hosseini SM, Alberti G Labaz B, Galka B, Bogacz A, Waroszewski J, Ka-
Abbreviations (2017b). Humus forms in relation to altitude bala C (2014). Factors influencing humus forms
OL: Organic litter; OF: Organic fragmenta- and forest type in the Northern mountainous and forest litter properties in the mid-moun-
tion; OH: Organic humus; AH: Organic-min- regions of Iran. Forest Ecology and Manage- tains under temperate climate of southwestern
eral layer; FFC: Forest floor carbon; FFN: ment 385: 78-86. - doi: 10.1016/j.foreco.2016.11. Poland. Geoderma 230: 265-273. - doi: 10.1016/j.
iForest 14: 26-33 32Bayranvand M et al. - iForest 14: 26-33
geoderma.2014.04.021 (1998). Hot-water-soluble C as a simple mea- Zhang B, Liang C, He H, Zhang X (2013). Varia-
iForest – Biogeosciences and Forestry
Li Z, Wei B, Wang X, Zhang Y, Zhang A (2018). Re- sure of labile soil organic matter: the relation- tions in soil microbial communities and residues
sponse of soil organic carbon fractions and CO 2 ship with microbial biomass C. Soil Biology and along an altitude gradient on the northern
emissions to exogenous composted manure Biochemistry 30: 1469-1472. - doi: 10.1016/S003 slope of Changbai Mountain, China. PLoS One
and calcium carbonate. Journal of Soils and 8-0717(98)00040-6 8: e66184. - doi: 10.1371/journal.pone.0066184
Sediments 18: 1832-1843. - doi: 10.1007/s11368- Waez-Mousavi SM (2018). Humus systems in the
018-1946-y Caspian Hyrcanian temperate forests. Applied Supplementary Material
Lucas-Borja ME, De Santiago JH, Yang Y, Shen Y, Soil Ecology 123: 664-667. - doi: 10.1016/j.apsoil.
Candel-Pérez D (2019). Nutrient, metal con- 2017.09.022 Fig. S1 - (a) The Central Caspian region of
tents and microbiological properties of litter Waez-Mousavi SM, Habashi H (2012). Evaluating northern Iran; (b) the study site at the Ex-
and soil along a tree age gradient in Mediter- humus forms variation in an unmanaged mixed perimental Forest Station (Vaz watershed).
ranean forest ecosystems. Science of the Total beech forest using two different classification
Environment 650: 749-758. - doi: 10.1016/j.scito methods. iForest - Biogeosciences and Forestry Fig. S2 - Mean monthly air temperature (°C)
tenv.2018.09.079 5: 272-275. - doi: 10.3832/ifor0632-005 and precipitation (mm) at the study site
McCune B, Mefford MJ (1999). PC-ORD for Win- Wang Q, Wang S (2011). Response of labile soil based on the Noushahr city metrological
dows: multivariate analysis of ecological data, organic matter to changes in forest vegetation station report.
version 4.01. MjM Software, Glenedon Beach, in subtropical regions. Applied Soil Ecology 47:
Oregon, USA. 210-216. - doi: 10.1016/j.apsoil.2010.12.004 Fig. S3 - Two examples of humus profiles at
Naqinezhad A, Zare-Maivan H, Gholizadeh H, Xu Z, Yu G, Zhang X, Ge J, He N, Wang Q, Wang D the sea level (0 m a.s.l. - PMF).
Hodgson JG (2013). Understory vegetation as (2015). The variations in soil microbial commu-
an indicator of soil characteristics in the Hyrca- nities, enzyme activities and their relationships Fig. S4 - Two examples of humus profiles at
nian area, N. Iran. Flora 208: 3-12. - doi: 10.1016/j. with soil organic matter decomposition along the 500 m a.s.l. (LMMF).
flora.2012.12.002 the northern slope of Changbai Mountain. Ap-
Ponge JF (2013). Plant-soil feedbacks mediated plied Soil Ecology 86: 19-29. - doi: 10.1016/j.ap Fig. S5 - Two examples of humus profiles at
by humus forms: a review. Soil Biology and Bio- soil.2014.09.015 the 1000 m a.s.l. (MMMF).
chemistry 57: 1048-1060. - doi: 10.1016/j.soilbio. Zaiets O, Poch RM (2016). Micromorphology of
2012.07.019 organic matter and humus in Mediterranean Fig. S6 - One example of humus profile at
Ponge JF, Jabiol B, Gégout JC (2011). Geology mountain soils. Geoderma 272: 83-92. - doi: the 1500 m a.s.l. (HMPF).
and climate conditions affect more humus 10.1016/j.geoderma.2016.03.006
forms than forest canopies at large scale in Zanella A, Jabiol B, Ponge JF, Sartori G, De Waal Fig. S7 - Two examples of humus profiles at
temperate forests. Geoderma 162: 187-195. - R, Van Delft B, Graefe U, Cools N, Katzensteiner the 2000 m a.s.l. (F-GE).
doi: 10.1016/j.geoderma.2011.02.003 K, Hager H, Englisch M (2011). A European mor-
Salmon S (2018). Changes in humus forms, soil pho-functional classification of humus forms. Tab. S1 - Humus systems (Mull, Rhizo Mull
invertebrate communities and soil functioning Geoderma 164: 138-14. - doi: 10.1016/j.geoderma and Amphi), Humus forms (Eumell, Meso-
with forest dynamics. Applied Soil Ecology 123: .2011.05.016 mull, Oligomull, Rhizo Mesomull, Rhizo
345-354. - doi: 10.1016/j.apsoil.2017.04.010 Zanella A, Ponge JF, Jabiol B, Sartori G, Kolb E, Oligomull and Rhizo Dysmull; Leptoamphi,
Shedayi AA, Xu M, Naseer I, Khan B (2016). Alti- Le Bayon RC, Gobat JM, Aubert M, De Waal R, Eumacroamphi and Eumesoamphi and
tudinal gradients of soil and vegetation carbon Van Delft B, Vacca A (2018). Humusica 1, article Pachyamphi) and their diagnosic horizons.
and nitrogen in a high-altitude nature reserve 5: Terrestrial humus systems and forms-Keys of
of Karakoram ranges. SpringerPlus 5: 320-334. - classification of humus systems and forms. Ap- Link: Bayranvand_3444@suppl001.pdf
doi: 10.1186/s40064-016-1935-9 plied Soil Ecology 122: 75-86. - doi: 10.1016/j.ap
Sparling G, Vojvodić-Vuković M, Schipper LA soil.2017.06.012
33 iForest 14: 26-33You can also read