Hepatitis C Direct Acting Antivirals and Ribavirin Modify Lipid but not Glucose Parameters - MDPI
←
→
Page content transcription
If your browser does not render page correctly, please read the page content below
cells
Article
Hepatitis C Direct Acting Antivirals and Ribavirin
Modify Lipid but not Glucose Parameters
Mary-Anne Doyle 1,2 , Chrissi Galanakis 2 , Erin Mulvihill 3,4 , Angela Crawley 2
and Curtis L. Cooper 2,5, *
 1    Division of Endocrinology & Metabolism, Department of Medicine, University of Ottawa,
      Ottawa, ON K1H 8L6, Canada; madoyle@ohri.ca
 2    Ottawa Hospital Research Institute, Ottawa, ON K1H 8L6, Canada; cgalanakis@ohri.ca (C.G.);
      acrawley@ohri.ca (A.C.); ccooper@toh.ca (C.L.C.)
 3    Department of Biochemistry, Microbiology and Immunology, University of Ottawa,
      Ottawa, ON K1H 8M5, Canada; emulvihi@uottawa.ca
 4    University of Ottawa Heart Institute, Ottawa, ON K1Y 4W7, Canada
 5    Division of Infectious Diseases, Department of Medicine, University of Ottawa,
      Ottawa, ON K1H 8L6, Canada
 *    Correspondence: ccooper@toh.ca; Tel.: +1-613-737-8924; Fax: +1-613-737-8164

 Received: 24 December 2018; Accepted: 12 March 2019; Published: 15 March 2019

 Abstract: Chronic hepatitis C (HCV) infection perturbs lipid and glucose metabolism. The influence of
 direct acting antiviral (DAA) treatment and ribavirin on these measures was evaluated. Furthermore,
 the effect of HCV cure on these parameters was assessed. Participants were allocated to one of three
 12-week treatment groups: non-cirrhotic genotype 1a-paritaprevir/ritonavir/ombitasvir/dasabuvir
 (PrOD) plus ribavirin; non-cirrhotic 1b-PrOD; compensated cirrhotic 1a or 1b-PrOD plus ribavirin.
 Fasting insulin, glucose, lipid and apolipoprotein measures were assessed at baseline, Treatment
 Weeks 4 and 12, and 12 and 24 weeks post-dosing. Twenty-three of 24 participants achieved
 SVR (PP= 23/24, 96% SVR). Overall, total cholesterol, low-density lipoprotein cholesterol (LDL-C),
 and triglyceride levels all increased in treatment and post-dosing. However, LDL-C levels decreased
 during treatment in ribavirin recipients. Fasting glucose, insulin, and HOMA-IR were unchanged
 during treatment and 12 weeks post-treatment. By 12 weeks post-treatment, controlled attenuation
 parameter (CAP) scores, a measure of steatosis, increased from baseline (mean 30.3 ± 63.5, p = 0.05).
 This regimen was safe and highly effective and did not influence glucose metabolism. Ribavirin
 exposure may mitigate some on-treatment lipid changes. Further mechanistic studies are needed
 to understand how ribavirin impacts lipid pathways, as there could be therapeutic implications.
 The metabolic pathophysiology of increased CAP score with HCV treatment requires explanation.

 Keywords: viral hepatitis; cirrhosis; antiviral therapy; insulin resistance; lipid metabolism

1. Introduction
     Chronic hepatitis C affects 2–3% of the world population and is a leading cause of cirrhosis,
hepatocellular carcinoma, and liver transplant [1]. More than 350,000 deaths per year are attributable
to hepatitis C (HCV)-related complications [1]. There is evidence that HCV perturbs the metabolic
milieu, which in turn influences the risk for complications and response to HCV antiviral treatment.
Insulin resistance and type 2 diabetes are associated with an increased risk of hepatocellular carcinoma
(HCC) [2], higher transplant complication rates [3], accelerated liver fibrosis [4], and possibly increased
morbidity from cardiovascular and metabolic complications [5]. Impaired insulin sensitivity is
associated with diminished antiviral treatment outcomes with interferon-based regimens [6,7].

Cells 2019, 8, 252; doi:10.3390/cells8030252                                      www.mdpi.com/journal/cells
Cells 2019, 8, 252 2 of 14
Achieving an HCV cure may influence glucose homeostasis. Observational studies have demonstrated
improved insulin sensitivity and reduced incidence of type 2 diabetes in patients who achieved sustained
virological response (SVR) following treatment with interferon and ribavirin [6,8–10]. Successful viral
clearance following treatment with telaprevir, interferon, and ribavirin was associated with lower
homeostatic model assessment-insulin resistance (HOMA-IR) in genotype 1 patients (HOMA-IR SVR:
0.61 vs. non-responders: 1.15, p < 0.05) [11].
HCV suppression and cure also influence lipid levels. The HCV life cycle is dependent on the
very-low-density lipoprotein (VLDL) pathway. Viral replication involves the formation of complexes
termed lipoviral particles resulting in decreased secretion of VLDL [12]. The assembly of these lipoviral
particles is believed to facilitate binding with low-density lipoprotein cholesterol (LDL-C) receptors
and is considered a mechanism by which HCV gains entry to the hepatocyte [13]. Numerous studies
have demonstrated lower total cholesterol, triglycerides (TG), high-density lipoprotein cholesterol
(HDL-C), and LDL-C levels in patients with chronic HCV infection [14–16]. Lower lipid levels correlate
with higher SVR with interferon-based HCV antiviral treatment [14–17]. Successful treatment of HCV
with interferon and ribavirin is also associated with the reversal of hypolipidemia, and in some cases,
lipid levels may increase to levels associated with increased cardiovascular risk [18,19].
Treatment of HCV has advanced dramatically in recent years with direct acting antivirals (DAAs)
resulting in shorter treatment duration, improved safety profile, higher tolerance, and higher SVR
rates [20–22]. The effects of DAA HCV medications while on treatment and SVR once cured on the
metabolic milieu are not well described. In one study of 40 HCV participants receiving 14 days of
monotherapy with the protease inhibitor danoprevir, declines in serum HCV RNA and HOMA-IR
correlated [23]. In contrast, Meissner et al. did not observe a change in HOMA-IR levels between
baseline and 24 weeks post-treatment in recipients of sofosbuvir and ribavirin [24]. In another study,
eradication of HCV with sofosbuvir was associated with a decline in HbA1c [25].
We evaluated the on-treatment effect of DAA HCV treatment and influence of achieving SVR
on measures of glucose and lipid homeostasis. Study participants received an HCV DAA regimen
consisting of an HCV protease inhibitor (paritaprevir boosted with ritonavir), an NS5a inhibitor
(Ombitasvir), and a polymerase inhibitor (Dasabuvir) (PrOD), with or without ribavirin. The role of
ribavirin was specifically addressed given the ongoing debate as to the pros and cons of this adjunct
medication in DAA regimens [26]. Cirrhosis was also considered in our analysis given pre-existing
evidence of perturbation of glucose and lipid metabolism in those with advanced liver disease.
2. Materials & Methods
Twenty-four HCV genotype 1a- or 1b-infected patients were included in this single-center,
open-label pilot study [ClinicalTrials.gov (Identifier: NCT02734173)]. Approval for this study was
obtained from The Ottawa Health Science Network Research Ethics Board (REB #2015-0305).
Participants were recruited from The Ottawa Hospital Viral Hepatitis Program (Ottawa, Canada)
between July 2015 and April 2016. All were 18 years or older, planned to initiate HCV antiviral
treatment, and provided signed informed consent to participate. Exclusion criteria included
decompensated liver disease, HOMA-IR < 2.0, HIV seropositivity, and chronic HBV infection defined
as hepatitis B surface antigen positivity. Use of immune-suppressing medications, active malignancy,
diabetes, use of lipid lowering medications, familial lipid disease, pregnancy, breastfeeding, and
ribavirin contraindication(s) were also exclusionary.
Participants who met the inclusion criteria were allocated to one of the following treatment groups
based on genotype and presence of cirrhosis: non-cirrhotic genotype 1a-infected participants receiving
PrOD plus ribavirin, non-cirrhotic genotype 1b-infected participants receiving PrOD, and compensated
cirrhotic genotype 1a or 1b-infected participants dosed with PrOD plus ribavirin. Ribavirin was dosed
by weight: 1000 mg if 70 kg or less and 1200 mg if greater, divided bid.
Participant demographics, HCV RNA level and genotype, mode of infection, length of time since
infection, alcohol consumption, smoking, and history of illicit drug use data was collected at baseline.Cells 2019, 8, 252 3 of 14
Blood samples were collected for HCV RNA analysis at baseline, Weeks 4 and 12, and 12 weeks and
24 weeks post-treatment.
Measures of fasting insulin, glucose, total cholesterol, HDL-C, LDL-C, TG, HbA1c, apoA1, apoA2,
apoB, apoC2, apoC3, and apoE were performed at baseline, Weeks 4 and 12, and 12 and 24 weeks
post-treatment. Patients were advised to fast prior to blood draws. HOMA-IR score was calculated as
per the following: (glucose × insulin)/22.5. IR was defined as having an HOMA-IR >2. A cut-off of
2 was selected, as this is a recognized standard [27]. Furthermore, our investigator group believed
that evaluating a study population with elevated HOMA-IR would be optimal to identify an HCV
treatment effect, if present.
Steatosis and liver fibrosis can result as a consequence of metabolic dysfunction. Liver stiffness
was determined by transient elastography (FibroScan® , Echosens SA, Paris, France) [28], performed at
baseline, Week 12, and 12 weeks post-dosing. A recording over 12.5 kPa defined cirrhosis. Controlled
attenuation parameter (CAP) was utilized as a measure of steatosis and/or inflammation within the
parenchyma of the liver.
Statistical Analysis
A danoprevir mono-therapy study identified a 1.6 +/− 1.1 decline in HOMA-IR over 14 days [23].
In HCV patients treated with interferon and ribavirin with or without metformin, a 21% decrease in
HOMA-IR in metformin recipients versus 10% in the control group was noted in the first 12 weeks
(absolute 1.0 mean change at 24 weeks post-HCV antiviral treatment) [29]. Based on these data, a crude
sample size of 8 per group provided 80% power to detect a mean difference in HOMA-IR scores of
1.0 assuming a two-sided comparison, a variance of 0.5, and an alpha of 0.05. This did not account for
analysis adjustments for potential confounders, as this was a pilot study.
Patient demographics, glucose, lipids, and apolipoprotein measures, grouped according to
treatment arm and differences between baseline characteristics, were evaluated using chi-square
and ANOVA at the p < 0.05 level. Fisher’s exact test was used for outcomes with fewer than 5 cases.
Changes from baseline in HOMA-IR, lipid, and apolipoprotein parameters at Weeks 4 and 12 as well
as 12 weeks post-treatment and 24 weeks post-treatment were assessed using linear mixed models
or generalized linear mixed models with a logit link. Models consisted of fixed effects for visit,
treatment group, and their interactions with time. Models of glucose measures were adjusted for
baseline BMI, and models of apolipoproteins were adjusted for baseline viral load. Visit was treated
as a categorical variable with baseline as the reference. Models included a random intercept for
participant or a repeated statement to control for the clustering effects of time. The estimated mean
at each study time point was also determined by the mixed models. Pairwise comparisons of the
estimated means within each group with respect to baseline were performed with least significant
difference tests in the mixed models. As the primary outcome, changes in HOMA-IR from baseline to
12 weeks post therapy were compared within treatment groups.
3. Results
3.1. Demographics and Baseline Characteristics
Twenty-four participants were enrolled in this study. Of 38 screen failures, 31 had HOMA-IR
resultsCells 2019, 8, 252 4 of 14
Cells 2019, 8, 252 4 of 16
3.2.HCV
3.2. HCVTreatment
Treatment Response
Response
Allparticipants
All participantscleared
clearedHCVHCVRNARNAbybyWeek Week4 4ofof treatment.Twenty-three
treatment. Twenty-threeofof2424participants
participants
achieved SVR12. One participant with detectable virus at the end of treatment was
achieved SVR12. One participant with detectable virus at the end of treatment was lost to follow-up lost to follow-up
priortotothe
prior the visit
visit occurring
occurring 1212 weeks
weeks post-treatment.
post-treatment. The
The SVR12
SVR12 was
was 100%
100% (8/8)with
(8/8) withribavirin-free
ribavirin-free
regimens and 15/16 (94%, PP = 15/16, 94%) in ribavirin-containing treatments
regimens and 15/16 (94%, PP = 15/16, 94%) in ribavirin-containing treatments (p = 0.47). SVR12 (p = 0.47). SVR12was
was
7/7 (100%; PP = 7/7, 100%) in cirrhotic participants and 16/17 (94%, PP = 16/17, 94%)
7/7 (100%; PP = 7/7, 100%) in cirrhotic participants and 16/17 (94%, PP = 16/17, 94%) in those without in those without
cirrhosis(p(p= =0.51).
cirrhosis 0.51).Ribavirin
Ribavirindosage
dosagewaswasreduced
reducedtoto600
600mgmgininthree
threepatients
patientsfollowing
followingtreatment
treatment
initiation. One patient had a serious adverse event unrelated to the study drug
initiation. One patient had a serious adverse event unrelated to the study drug and discontinued and discontinued
therapy
therapy at at
ninenine weeks
weeks to avoid
to avoid a drug–drug
a drug–drug interaction
interaction with colchicine
with colchicine for gout
for a severe a severe gout flare
flare resulting
resulting in hospitalization. No other serious adverse events were reported
in hospitalization. No other serious adverse events were reported during the study. during the study.
3.3.Metabolic
3.3. Metabolic Measures
Measures and and
HCVHCV Treatment—All
Treatment—All Patients
Patients
Themeans
The means of the
of the metabolic
metabolic measures
measures acrossacross the study
the study periodperiod are presented
are presented in Table 2inand
Table 2 and
changes
changes
from fromatbaseline
baseline each timeatpoint
each are
time point are
reported reported1–4.
in Figures in Figures
Changes1–4. wereChanges
observed were observed
for HbA1c andfor
HbA1c
lipid and lipid
measures measures
across across
the study the study
period (Tableperiod
2 and (Table 2 and
described described
below). below).
Overall, Overall,
glucose (p =glucose
0.11),
(p = 0.11),
insulin insulin
(p = 0.42), (p HOMA-IR
and = 0.42), and(pHOMA-IR
= 0.32) did (p
not= change
0.32) did nottime
over change over
(Table time (Table
2, Figure 2A–C).2,Individual
Figure 2A–
C). Individual
HOMA-IR HOMA-IR
trajectories over trajectories over time
time are presented in are presented
Figure 1. in Figure 1.
HOMA-IR
Figure 1. Homeostatic Model Assessment—Insulin Resistance (HOMA-IR) at each study time point
(baseline, Week 4 of treatment, end of treatment at Week 12, 12 weeks after treatment completion,
Figure 1. Homeostatic Model Assessment—Insulin Resistance (HOMA-IR) at each study time point
and 24 weeks after treatment completion) for each participant by treatment group (RBV+ = ribavirin
(baseline, Week 4 of treatment, end of treatment at Week 12, 12 weeks after treatment completion, and
containing hepatitis C (HCV) treatment in participants without cirrhosis, RBV− = ribavirin free
24 weeks after treatment completion) for each participant by treatment group (RBV+ = ribavirin
HCV treatment in participants without cirrhosis, RBV+F4+ = ribavirin containing HCV treatment in
containing hepatitis C (HCV) treatment in participants without cirrhosis, RBV− = ribavirin free HCV
participants with cirrhosis).
treatment in participants without cirrhosis, RBV+F4+ = ribavirin containing HCV treatment in
participants with cirrhosis).Cells 2019, 8, 252 5 of 14
Cells 2019, 8, 252 5 of 16
Changes
Figure 2.2. Changes
Figure in in glucose
glucose measures
measures overover
timetime
andand
meanmean changes
changes compared
compared to baseline.
to baseline. (A)
(A) HOMA-IR, (B) insulin, (C) glucose, and (D) HbA1c. The estimated mean and the mean change
HOMA-IR, (B) insulin, (C) glucose, and (D) HbA1c. The estimated mean and the mean change from
from baseline at each study time point is from a linear mixed model adjusted for group, and the
baseline at each study time point is from a linear mixed model adjusted for group, and the baseline
baseline BMI and their interaction with time is from a linear mixed model with a random effect for
BMI and their interaction with time is from a linear mixed model with a random effect for participant.
participant. HbA1c was adjusted for the effect of hemoglobin. All p-values were determined by the
HbA1c was adjusted for the effect of hemoglobin. All p-values were determined by the linear mixed
linear mixed model for the effect of time and group at each time point. Significant mean changes
model for the effect of time and group at each time point. Significant mean changes in the glucose
in the glucose measures compared to baseline at the p < 0.05 significance level were denoted by (*),
measures compared to baseline at the p < 0.05 significance level were denoted by (*), p < 0.01 by (**),
p < 0.01 by (**), and p < 0.001 by (***). Missing data: baseline: HbA1c (n = 1); Week 4 (W4): HbA1c
and p < 0.001 by (***). Missing data: baseline: HbA1c (n = 1); Week 4 (W4): HbA1c (n = 1); Week 12
(n = 1); Week 12 (W12): insulin/HOMA-IR (n = 1), HbA1c (n = 3); 12 weeks after treatment (W12PT):
(W12): insulin/HOMA-IR (n = 1), HbA1c (n = 3); 12 weeks after treatment (W12PT): glucose/HOMA-
glucose/HOMA-IR (n = 3), insulin (n = 2); HbA1c (n = 2); 24 weeks after treatment (W24PT): HOMA-IR
IR (n = 3), insulin (n = 2); HbA1c (n = 2); 24 weeks after treatment (W24PT): HOMA-IR (n = 7), insulin
(n = 7), insulin (n = 7), glucose (n = 4), HbA1c (n = 4).
(n = 7), glucose (n = 4), HbA1c (n = 4).Cells 2019, 8,
Cells 2019, 8, 252
252 66 of
of 14
16
Figure 3. Changes in lipid measures over time and mean changes compared to baseline. (A) Total
Figure 3. Changes
cholesterol, in lipid measures
(B) high-density lipoproteinover time and(HDL-C),
cholesterol mean changes comparedlipoprotein
(C) low-density to baseline.cholesterol
(A) Total
cholesterol, (B) high-density lipoprotein cholesterol (HDL-C), (C) low-density lipoprotein
(LDL-C), and (D) triglycerides (TG). The estimated mean and the mean change from baseline at each cholesterol
(LDL-C),
study timeand (D)istriglycerides
point from a linear (TG). Themodel
mixed estimated meanfor
adjusted and the mean
group change
and its from baseline
interaction with time at from
each
study time point is from a linear mixed model adjusted for group and its interaction
a linear mixed model with a random effect for participant. All p-values were determined by the linear with time from
a linearmodel
mixed mixed for
modelthe with
effecta of
random effect
time and for participant.
group at each time Allpoint.
p-values were determined
Significant by the in
mean changes linear
the
mixed model for the effect of time and group at each time point. Significant mean
glucose measures compared to baseline at the p < 0.05 significance level were denoted by (*), p < 0.01 changes in the
glucose measures compared to baseline at the p < 0.05 significance level were denoted
by (**), and p < 0.001 by (***). BL = Baseline; W4 = Week 4 of treatment; W12 = Week 12 of treatment; by (*), p < 0.01
by (**), and
W12PT = 12pweeks
< 0.001after
by (***). BL = Baseline;
treatment; W24PT =W4 24 =weeks
Weekafter
4 of treatment;
treatment. W12 = Week
Missing data:12W12PT
of treatment;
(n = 2)
W12PT
and = 12 (n
W24PT weeks after
= 4) for treatment;
total W24PT
cholesterol, = 24 weeksand
triglycerides, after treatment.
HDL-C; W12PTMissing
(n = 4)data:
and W12PT
W24PT (n (n == 2)
4)
andLDL-C.
for W24PT (n = 4) for total cholesterol, triglycerides, and HDL-C; W12PT (n = 4) and W24PT (n = 4)
for LDL-C.Cells 2019, 8, 252 7 of 14
Cells 2019, 8, 252 7 of 16
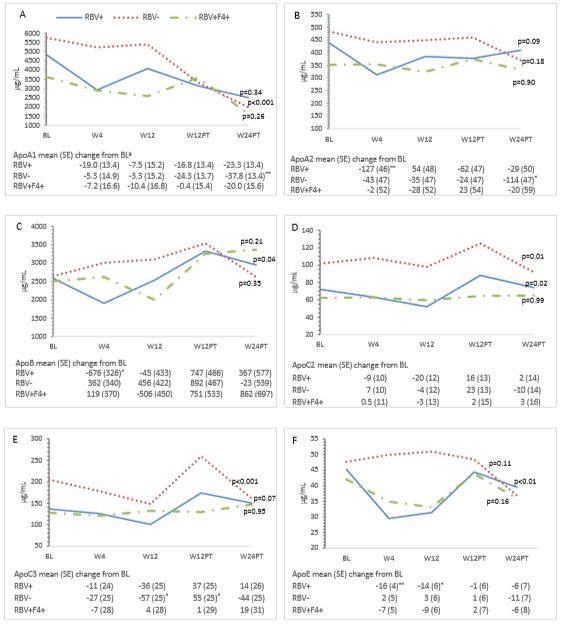
Figure 4. Changes in Apolipoproteins over time and mean changes compared to baseline. (A) apoA1,
Figure 4. Changes in Apolipoproteins over time and mean changes compared to baseline. (A) apoA1,
(B) apoA1, (C) apoB, (D) apoC2, (E) apoC3, and (F) apoE. The estimated mean and the mean change
(B) apoA1, (C) apoB, (D) apoC2, (E) apoC3, and (F) apoE. The estimated mean and the mean change
from baseline at each study time point is from the generalized linear mixed model adjusted for group,
from baseline at each study time point is from the generalized linear mixed model adjusted for group,
and baseline viral load and their interaction with time. All p-values were determined by the generalized
and baseline viral load and their interaction with time. All p-values were determined by the
linear mixed model for the effect of time and group at each time point. Significant mean changes in the
generalized linear mixed model for the effect of time and group at each time point. Significant mean
apolipoproteins compared to baseline at the p < 0.05 significance level were denoted by (*), p < 0.01 by
changes in the apolipoproteins compared to baseline at the p < 0.05 significance level were denoted
(**), and p < 0.001 by (***). ¥ Mean changes expressed as 102 . BL = Baseline; W4 = Week 4 of treatment;
by (*), p < 0.01 by (**), and p < 0.001 by (***). ¥ Mean changes expressed as 102. BL = Baseline; W4 =
W12 = Week 12 of treatment; W12PT = 12 weeks after treatment; W24PT = 24 weeks after treatment.
Week 4 of treatment; W12 = Week 12 of treatment; W12PT = 12 weeks after treatment; W24PT = 24
Missing data for all apolipoproteins apoA1–E at W12 (n = 1); W12PT (n = 2); W24PT (n = 4).
weeks after treatment. Missing data for all apolipoproteins apoA1–E at W12 (n = 1); W12PT (n = 2);
W24PT (n = 4).Cells 2019, 8, 252 8 of 14
Table 1. Patient characteristics at baseline.
All Patients RBV+ RBV− RBV+F4+
Characteristic (n = 24) (n = 9) (n = 8) (n = 7) p-Value **
n % n % n % n %
Age * 54 (11.6) - 53 (9.9) - 51 (12.7) - 59 (12.2) - 0.36
Male 17 71 7 79 5 63 5 71 0.79
Genotype
1a 13 54 9 100 - 4 57Weeks 4 and 12 in apoE in ribavirin recipients (Figures 4A, B and F).
3.5. Cirrhosis and Metabolic Measures
Participants with cirrhosis had higher baseline insulin and HOMA-IR than non-cirrhotic patients
Cells 2019,RBV-sparing
in the 8, 252 group (HOMA-IR mean difference 2.2, 95% CI 0.58–3.8, p = 0.01; insulin9mean of 14
difference 52.5, 95% CI 8.5–96.4, p = 0.02). These measures remained unchanged from baseline while
on treatment and 12 weeks following dosing in the overall study population as well as in cirrhotic
on treatment
and and 12 weeks
non-cirrhotic following
participants. dosing in the
Twenty-four overall
weeks study population
post-treatment, as well asinininsulin
an increase cirrhotic(mean
and
non-cirrhotic participants. Twenty-four weeks post-treatment, an increase
change 70.3, 95% CI 24.0–116.6) and HOMA-IR (mean change 2.9, 95% CI 1.2–4.7) was noted in in insulin (mean change
70.3, 95% CI
cirrhotic 24.0–116.6)which
participants, and HOMA-IR (mean change
was not observed 2.9, 95% CI
in non-cirrhotic 1.2–4.7) was
participants. Whennoted
theinresults
cirrhotic
of a
participants, which was not observed in non-cirrhotic participants. When the results of
single outlier were removed, this finding was no longer present (Figure 1). Participants with cirrhosis a single outlier
were
had removed, this finding
similar trajectories was noand
of HbA1c longer
lipidpresent
measures (Figure 1). Participants
compared to those inwith cirrhosis hadribavirin-
the non-cirrhotic similar
trajectories
containingoftreatment
HbA1c and lipid
group measures
(Figures 2D compared
and 3A–D). to those in the non-cirrhotic ribavirin-containing
treatment group (Figures 2D and 3A–D).
apoA1, apoA2, and apoE were lower at baseline in the cirrhotic participants compared with non-
apoA1,
cirrhotic apoA2, and
participants apoE were
(Figures 4A, B lower
and F).atThere
baseline
wereinnotheobserved
cirrhoticchanges
participants
from compared
baseline in with
mean
non-cirrhotic participants (Figure 4A,B,F). There were no observed
glucose and apolipoprotein measures among cirrhotic patients over the study period. changes from baseline in mean
glucose and apolipoprotein measures among cirrhotic patients over the study period.
3.6. Liver Assessment
3.6. Liver Assessment
Twelve weeks post-treatment, a mean increase from baseline in the controlled attenuation
Twelve (CAP)
parameter weekswas post-treatment,
observed (30.3 a mean
± 63.5,increase
p = 0.05)from baseline
(Figure 5). No in the controlled
differences in CAP attenuation
score were
parameter (CAP) was observed (30.3 ± 63.5, p
observed in the treatment group (p = 0.94). Overall mean liver stiffness scores did not changewere
= 0.05) (Figure 5). No differences in CAP score from
observed
baseline in theweeks
at 12 treatment group (p =(−0.61
post-treatment 0.94). ±Overall
5.9 kPA, mean liver stiffness
p = 0.64). scores were
No differences did not changeinfrom
observed liver
baseline
stiffnessatover
12 weeks
time bypost-treatment
treatment group(−0.61(p ± (datap =
5.9 kPA,
= 0.96) not0.64). No differences were observed in liver
shown).
stiffness over time by treatment group (p = 0.96) (data not shown).
Figure 5. Mean controlled attenuation parameter (CAP) score at each study time point (baseline, end
Figure 5. Mean controlled attenuation parameter (CAP) score at each study time point (baseline, end
of treatment at Week 12 (W12), 12 weeks after treatment (W12PT) completion) by treatment grouping
of treatment at Week 12 (W12), 12 weeks after treatment (W12PT) completion) by treatment grouping
(RBV+ = ribavirin containing HCV treatment in participants without cirrhosis; RBV− = ribavirin free
HCV treatment in participants without cirrhosis; RBV+F4+ = ribavirin containing HCV treatment in
participants with cirrhosis).
4. Discussion
An association between chronic HCV infection and impaired glucose and lipid metabolism
has been extensively described in the literature [14–16,30–33]. Although the exact mechanisms by
which HCV interferes with these metabolic pathways has not been fully established, there is evidence
to suggest that viral clearance achieved with interferon-based HCV treatment may perturb these
metabolic measures [8–10,18,19,25]. In contrast, there has been minimal evaluation of the metabolic
effects of interferon-free DAA treatment or the specific effects of ribavirin while in therapy or after SVR.
We present a prospective comprehensive analysis of metabolic findings of individuals undergoing
interferon-free, DAA treatment (with and without ribavirin) as well as the post-SVR outcomes of HCV
genotype 1 infection.Cells 2019, 8, 252 10 of 14
We observed no consistent on-treatment or post-SVR change in measures of glucose homeostasis.
HOMA-IR did not improve from baseline during the treatment phase or post-DAA dosing in the overall
study population or any subgroup (Table 2, Figures 1 and 2A). The latter is consistent with results from
a Messiner et al. study in which no difference in HOMA-IR between baseline, on-treatment and the
post-treatment phase were observed in patients treated with an IFN-free regimen [24]. This challenges
the hypothesis that HCV clearance may reduce insulin resistance and/or reduce the risk of developing
diabetes [8–10]. As suggested in Figure 1, it is possible that the complex interactions between liver
fibrosis status, HCV RNA clearance, and glucose-insulin homeostasis may result in heterogeneous
short- and long-term outcomes regarding diabetes risk.
Our evaluation suggests a correlation between the degree of liver fibrosis and insulin resistance
(see Figure 2 baseline results). Insulin resistance is a critical factor in promoting the progression of
hepatic fibrosis. This is thought to be mediated via the direct effect of insulin on hepatic stellate
cells [27]. Insulin resistance is a common and well-known feature of cirrhosis irrespective of etiology
and an important contributor to hepatogenous diabetes [34,35].
There was a difference in HbA1c measures based on ribavirin exposure. A decrease in HbA1c
levels was observed in ribavirin recipients during the treatment phase. As there were no differences
in fasting glucose or insulin levels at these time points, HbA1c may not provide a true reflection
of glycemic control in this group. Ribavirin reduces erythrocyte lifespan and in turn may lead to
falsely low HbA1c levels [36,37]. It is unclear if other studies have considered the ribavirin effects on
hemoglobin when describing improvements in HbA1c levels while on therapy [10,24,38,39]. One recent
evaluation specifically indicated that HbA1c was not measured in ribavirin-exposed participants for
a minimum of 3 months post-treatment due to the known hemolytic effects of this medication [25].
This group reported that HCV eradication with a sofosbuvir-based regimen resulted in a decrease in
HbA1c levels (pre-treatment 6.66 +/− 0.95 versus post-treatment 6.14 +/− 0.65, p < 0.005).
In addition to evaluating measures of glucose homeostasis, we also assessed the lipid profile.
As described previously, viral clearance was associated with increased on-treatment and post-treatment
total cholesterol, LDL-C, and TG levels (Table 2, Figure 3A,C,D) [18,19,24]. The presence of cirrhosis
did not affect lipid levels during or after treatment. Differences in the direction of lipid changes during
treatment were observed based on ribavirin exposure, suggesting a direct effect of this medication
on lipid homeostasis. Specifically, reduced total cholesterol, LDL-C, and decreased apoB levels were
noted in non-cirrhotic RBV recipients at Weeks 4 and 12 (Figure 3A,C and Figure 4C). Post-treatment,
this RBV-specific lipid effect was no longer observed. While the observed overall on-treatment and
post-SVR increase in total and LDL-C, as well as TG levels, are consistent with other studies, the marked
on-treatment effect of ribavirin on the lipid profile is novel. This warrants further evaluation given the
possible role in the management of dyslipidemia.
We conducted an intensive evaluation of apolipoproteins. The formation of HCV lipoviral
particles (LVP) occurs within the endoplasmic reticulum at interfaces between lipid droplets and is
closely intertwined with lipid and lipoprotein metabolism [40]. As such, apolipoproteins are essential
regulators of lipid metabolism and play an important role in the HCV life cycle [41]. apoB forms the
protein backbone for the formation of TG lipoproteins including chylomicrons and VLDL as well
as post-hydrolysis LDL. In contrast to apoB, other apolipoproteins including apoA1, apoC2, apoC3,
and apoE are easily disassociated and can be exchanged between different classes of lipoproteins and
the surface of HCV LVPs [41]. apoE association with HCV lipoviral particles enhances infectivity [13,
42–45]. We observed a decline in apoE during the 12-week treatment phase in ribavirin-exposed
participants. This was similarly described by Younossi et al. This further suggests a ribavirin-specific
effect on lipid homeostasis.
The downregulation of apoA1 has been associated with decreases in HCV RNA levels and as
such has been implicated in viral replication [46]. Our study demonstrated decreased apoA1 levels
in non-cirrhotic, RBV unexposed treatment recipients (Table 2, Figure 4A). This was in contrast to
Younossi et al. where HCV treatment did not influence apoA1 levels. Although associated with lowCells 2019, 8, 252 11 of 14
apoB levels, the role of apoB in HCV assembly is unclear [31,43,47,48]. apoB levels increased from
baseline to 24 weeks after treatment in patients treated with RBV irrespective of the degree of liver
fibrosis (Table 2, Figure 4C). This is in contrast to the study by Younossi et al. where treatment did
not influence apoB levels. apoC2, an activator, and apoC3, an inhibitor of lipoprotein lipase activity,
have been implicated in HCV infection via their modulation of the LVP catabolism. Lipoprotein lipase
activity has been shown to inversely correlate with HCV RNA levels [49–51], and low apoC2 levels
correlate with increased HCV infection and more advanced liver disease [50]. Consistent with other
studies, we demonstrated an increase in apoC2/C3 levels post-treatment in non-cirrhotic patients
irrespective of ribavirin exposure and provide further evidence that more advanced liver disease is
associated with low levels of these apolipoproteins pre- and post-treatment (Table 2, Figure 4D,E).
CAP score, a measure of liver steatosis, was noted to increase from baseline at the end of treatment
and again 12 weeks after treatment when SVR was achieved (Figure 5). This finding was consistent
irrespective of the presence or absence of cirrhosis or RBV exposure. The explanation of this finding
is unclear. The relationship between lipid profile perturbation and liver steatosis resulting from
HCV RNA clearance requires further evaluation. This increase in CAP score did not correlate with
the fibrosis score, which remained unchanged from baseline—at least during the short period of
post-treatment follow-up.
There are limitations requiring consideration in this exploratory study. As all but one participant
achieved a SVR12, it was not possible to compare metabolic outcomes between those cured and
treatment failures. This was a non-randomized, open-label study and as such is subject to selection
bias. Given the small sample size, it was not possible to adjust for all potential confounders, and the
potential for Type I and II statistical error is acknowledged. Our study was powered to detect
differences in HOMA-IR of 1.0. We were limited in detecting smaller changes in this primary outcome.
Some evaluations have suggested that the most marked improvements in insulin sensitivity and
glucose metabolism are achieved in patients with higher baseline HOMA-IR levels and established
diabetes, respectively [25,38,39]. Our study population was characterized by relatively low HOMA-IR
levels at baseline compared to these studies.
5. Conclusions
Exposure to DAA and ribavirin may influence lipid and apolipoprotein, but not glucose,
parameters during HCV treatment. Furthermore, an HCV cure with DAA treatment results in increased
lipid levels. Our study suggests that ribavirin exposure may play a role in mitigating some of the
on-treatment lipid changes observed as HCV is cleared while on HCV treatment. Hepatic steatosis
may also be affected by the clearance and cure of HCV.
Author Contributions: C.C. was the lead investigator on the project and responsible for conception design and
protocol development. M.-A.D. and A.C. contributed to study design and protocol development. The data analysis
was completed by C.G. and reviewed by M.-A.D., A.C., E.M., and C.C. M.-A.D. was responsible for writing the
initial draft of the manuscript. All authors were responsible for editing and approving the final manuscript.
Funding: This research was funded by Abbvie who is acknowledged for providing unrestricted funding and
medication for the conduct of this study. CLC has served as an advisor and speaker as well as received program
and research support from Abbvie, Gilead, and Merck. MAD has served as an advisor and speaker for Gilead.
Conflicts of Interest: The authors declare no conflict of interest.
List of Abbreviations
HCV Hepatitis C
RBV Ribavirin
PrOD Paritaprevir/ritonavir/ombitasvir/dasabuvir
CAP Controlled attenuation parameter
SVR Sustained virologic response
LDL-C Low-density lipoprotein cholesterol
HOMA-IR Homeostatic model assessment—insulin resistanceCells 2019, 8, 252 12 of 14
HCC Hepatocellular carcinoma
VLDL Very-low-density lipoprotein
TG Triglycerides
HDL-C High-density lipoprotein cholesterol
DAA Direct acting antivirals
RNA Ribonucleic acid
REB Research Ethics Board
kPa Kilopascal
BMI Body mass index
IFN Interferon
HbA1c Glycated hemoglobin
LVP Lipo-viral particles
References
1. Averhoff, F.M.; Glass, N.; Holtzman, D. Global burden of hepatitis C: Considerations for healthcare providers
in the United States. Clin. Infect. Dis. 2012, 55 (Suppl. 1), S10–S15. [CrossRef] [PubMed]
2. Hung, C.H.; Wang, J.H.; Hu, T.H.; Chen, C.H.; Chang, K.C.; Yen, Y.H.; Kuo, Y.H.; Tsai, M.C.; Lu, S.N.;
Lee, C.M. Insulin resistance is associated with hepatocellular carcinoma in chronic hepatitis C infection.
World J. Gastroenterol. 2010, 16, 2265–2271. [CrossRef] [PubMed]
3. Baid, S.; Cosimi, A.B.; Farrell, M.L.; Schoenfeld, D.A.; Feng, S.; Chung, R.T.; Tolkoff-Rubin, N.; Pascual, M.
Posttransplant diabetes mellitus in liver transplant recipients: Risk factors, temporal relationship with
hepatitis C virus allograft hepatitis, and impact on mortality. Transplantation 2001, 72, 1066–1072. [CrossRef]
4. Taura, N.; Ichikawa, T.; Hamasaki, K.; Nakao, K.; Nishimura, D.; Goto, T.; Fukuta, M.; Kawashimo, H.;
Fujimoto, M.; Kusumoto, K.; et al. Association between liver fibrosis and insulin sensitivity in chronic
hepatitis C patients. Am. J. Gastroenterol. 2006, 101, 2752–2759. [CrossRef]
5. Butt, A.A.; Xiaoqiang, W.; Budoff, M.; Leaf, D.; Kuller, L.H.; Justice, A.C. Hepatitis C virus infection and the
risk of coronary disease. Clin. Infect. Dis. 2009, 49, 225–232. [CrossRef] [PubMed]
6. Grasso, A.; Malfatti, F.; De Leo, P.; Martines, H.; Fabris, P.; Toscanini, F.; Anselmo, M.; Menardo, G. Insulin
resistance predicts rapid virological response in non-diabetic, non-cirrhotic genotype 1 HCV patients treated
with peginterferon alpha-2b plus ribavirin. J. Hepatol. 2009, 51, 984–990. [CrossRef] [PubMed]
7. Poustchi, H.; Negro, F.; Hui, J.; Cua, I.H.; Brandt, L.R.; Kench, J.G.; George, J. Insulin resistance and response
to therapy in patients infected with chronic hepatitis C virus genotypes 2 and 3. J. Hepatol. 2008, 48, 28–34.
[CrossRef] [PubMed]
8. Brandman, D.; Bacchetti, P.; Ayala, C.E.; Maher, J.J.; Khalili, M. Impact of insulin resistance on HCV treatment
response and impact of HCV treatment on insulin sensitivity using direct measurements of insulin action.
Diabetes Care 2012, 35, 1090–1094. [CrossRef] [PubMed]
9. Jung, H.J.; Kim, Y.S.; Kim, S.G.; Lee, Y.N.; Jeong, S.W.; Jang, J.Y.; Lee, S.H.; Kim, H.S.; Kim, B.S. The impact
of pegylated interferon and ribavirin combination treatment on lipid metabolism and insulin resistance in
chronic hepatitis C patients. Clin. Mol. Hepatol. 2014, 20, 38–46. [CrossRef] [PubMed]
10. Simo, R.; Lecube, A.; Genesca, J.; Esteban, J.I.; Hernandez, C. Sustained virological response correlates
with reduction in the incidence of glucose abnormalities in patients with chronic hepatitis C virus infection.
Diabetes Care 2006, 29, 2462–2466. [CrossRef]
11. Serfaty, L.; Forns, X.; Goeser, T.; Ferenci, P.; Nevens, F.; Carosi, G.; Drenth, J.P.; Lonjon-Domanec, I.; DeMasi, R.;
Picchio, G.; et al. Insulin resistance and response to telaprevir plus peginterferon alpha and ribavirin in
treatment-naive patients infected with HCV genotype 1. Gut 2012, 61, 1473–1480. [CrossRef]
12. Felmlee, D.J.; Hafirassou, M.L.; Lefevre, M.; Baumert, T.F.; Schuster, C. Hepatitis C virus, cholesterol and
lipoproteins—Impact for the viral life cycle and pathogenesis of liver disease. Viruses 2013, 5, 1292–1324.
[CrossRef] [PubMed]
13. Agnello, V.; Abel, G.; Elfahal, M.; Knight, G.B.; Zhang, Q.X. Hepatitis C virus and other flaviviridae viruses enter
cells via low density lipoprotein receptor. Proc. Natl. Acad. Sci. USA 1999, 96, 12766–12771. [CrossRef] [PubMed]
14. Dai, C.Y.; Chuang, W.L.; Ho, C.K.; Hsieh, M.Y.; Huang, J.F.; Lee, L.P.; Hou, N.J.; Lin, Z.Y.; Chen, S.C.;
Hsieh, M.Y.; et al. Associations between hepatitis C viremia and low serum triglyceride and cholesterol
levels: A community-based study. J. Hepatol. 2008, 49, 9–16. [CrossRef] [PubMed]Cells 2019, 8, 252 13 of 14
15. Petit, J.M.; Benichou, M.; Duvillard, L.; Jooste, V.; Bour, J.B.; Minello, A.; Verges, B.; Brun, J.M.; Gambert, P.;
Hillon, P. Hepatitis C virus-associated hypobetalipoproteinemia is correlated with plasma viral load, steatosis,
and liver fibrosis. Am. J. Gastroenterol. 2003, 98, 1150–1154. [PubMed]
16. Siagris, D.; Christofidou, M.; Theocharis, G.J.; Pagoni, N.; Papadimitriou, C.; Lekkou, A.; Thomopoulos, K.;
Starakis, I.; Tsamandas, A.C.; Labropoulou-Karatza, C. Serum lipid pattern in chronic hepatitis C: Histological
and virological correlations. J. Viral. Hepat. 2006, 13, 56–61. [CrossRef]
17. Economou, M.; Milionis, H.; Filis, S.; Baltayiannis, G.; Christou, L.; Elisaf, M.; Tsianos, E. Baseline cholesterol
is associated with the response to antiviral therapy in chronic hepatitis C. J. Gastroenterol. Hepatol. 2008, 23,
586–591. [CrossRef]
18. Corey, K.E.; Kane, E.; Munroe, C.; Barlow, L.L.; Zheng, H.; Chung, R.T. Hepatitis C virus infection and its clearance
alter circulating lipids: Implications for long-term follow-up. Hepatology 2009, 50, 1030–1037. [CrossRef]
19. Tada, S.; Saito, H.; Ebinuma, H.; Ojiro, K.; Yamagishi, Y.; Kumagai, N.; Inagaki, Y.; Masuda, T.; Nishida, J.;
Takahashi, M.; et al. Treatment of hepatitis C virus with peg-interferon and ribavirin combination therapy
significantly affects lipid metabolism. Hepatol. Res. 2009, 39, 195–199. [CrossRef]
20. Afdhal, N.; Zeuzem, S.; Kwo, P.; Chojkier, M.; Gitlin, N.; Puoti, M.; Romero-Gomez, M.; Zarski, J.P.;
Agarwal, K.; Buggisch, P.; et al. Ledipasvir and sofosbuvir for untreated HCV genotype 1 infection.
N. Engl. J. Med. 2014, 370, 1889–1898. [CrossRef] [PubMed]
21. Feld, J.J.; Jacobson, I.M.; Hezode, C.; Asselah, T.; Ruane, P.J.; Gruener, N.; Abergel, A.; Mangia, A.; Lai, C.L.;
Chan, H.L.; et al. Sofosbuvir and Velpatasvir for HCV Genotype 1, 2, 4, 5, and 6 Infection. N. Engl. J. Med.
2015, 373, 2599–2607. [CrossRef] [PubMed]
22. Feld, J.J.; Kowdley, K.V.; Coakley, E.; Sigal, S.; Nelson, D.R.; Crawford, D.; Weiland, O.; Aguilar, H.;
Xiong, J.; Pilot-Matias, T.; et al. Treatment of HCV with ABT-450/r-ombitasvir and dasabuvir with ribavirin.
N. Engl. J. Med. 2014, 370, 1594–1603. [CrossRef] [PubMed]
23. Moucari, R.; Forestier, N.; Larrey, D.; Guyader, D.; Couzigou, P.; Benhamou, Y.; Voitot, H.; Vidaud, M.;
Seiwert, S.; Bradford, B.; et al. Danoprevir, an HCV NS3/4A protease inhibitor, improves insulin sensitivity
in patients with genotype 1 chronic hepatitis C. Gut 2010, 59, 1694–1698. [CrossRef]
24. Meissner, E.G.; Lee, Y.J.; Osinusi, A.; Sims, Z.; Qin, J.; Sturdevant, D.; McHutchison, J.; Subramanian, M.;
Sampson, M.; Naggie, S.; et al. Effect of sofosbuvir and ribavirin treatment on peripheral and hepatic lipid
metabolism in chronic hepatitis C virus, genotype 1-infected patients. Hepatology 2015, 61, 790–801. [CrossRef]
[PubMed]
25. Morales, A.L.; Junga, Z.; Singla, M.B.; Sjogren, M.; Torres, D. Hepatitis C eradication with sofosbuvir leads to
significant metabolic changes. World J. Hepatol. 2016, 8, 1557–1563. [CrossRef]
26. Mathur, P.; Kottilil, S.; Wilson, E. Use of Ribavirin for Hepatitis C Treatment in the Modern Direct-acting
Antiviral Era. J. Clin. Transl. Hepatol. 2018, 6, 431–437. [CrossRef] [PubMed]
27. Hull, M.W.; Rollet, K.; Moodie, E.E.; Walmsley, S.; Cox, J.; Potter, M.; Cooper, C.; Pick, N.; Saeed, S.;
Klein, M.B.; et al. Insulin resistance is associated with progression to hepatic fibrosis in a cohort of
HIV/hepatitis C virus-coinfected patients. Aids 2012, 26, 1789–1794. [CrossRef] [PubMed]
28. Lucidarme, D.; Foucher, J.; Le Bail, B.; Vergniol, J.; Castera, L.; Duburque, C.; Forzy, G.; Filoche, B.;
Couzigou, P.; de Ledinghen, V. Factors of accuracy of transient elastography (fibroscan) for the diagnosis of
liver fibrosis in chronic hepatitis C. Hepatology 2009, 49, 1083–1089. [CrossRef]
29. Yu, J.W.; Sun, L.J.; Zhao, Y.H.; Kang, P.; Yan, B.Z. The effect of metformin on the efficacy of antiviral therapy in
patients with genotype 1 chronic hepatitis C and insulin resistance. Int. J. Infect. Dis. 2012, 16, e436–e441. [CrossRef]
30. Allison, M.E.; Wreghitt, T.; Palmer, C.R.; Alexander, G.J. Evidence for a link between hepatitis C virus
infection and diabetes mellitus in a cirrhotic population. J. Hepatol. 1994, 21, 1135–1139. [CrossRef]
31. Huang, J.F.; Dai, C.Y.; Hwang, S.J.; Ho, C.K.; Hsiao, P.J.; Hsieh, M.Y.; Lee, L.P.; Lin, Z.Y.; Chen, S.C.; Hsieh, M.Y.;
et al. Hepatitis C viremia increases the association with type 2 diabetes mellitus in a hepatitis B and C endemic
area: An epidemiological link with virological implication. Am. J. Gastroenterol. 2007, 102, 1237–1243. [CrossRef]
[PubMed]
32. Kawaguchi, T.; Yoshida, T.; Harada, M.; Hisamoto, T.; Nagao, Y.; Ide, T.; Taniguchi, E.; Kumemura, H.;
Hanada, S.; Maeyama, M.; et al. Hepatitis C virus down-regulates insulin receptor substrates 1 and 2 through
up-regulation of suppressor of cytokine signaling 3. Am. J. Pathol. 2004, 165, 1499–1508. [CrossRef]
33. White, D.L.; Ratziu, V.; El-Serag, H.B. Hepatitis C infection and risk of diabetes: A systematic review and
meta-analysis. J. Hepatol. 2008, 49, 831–844. [CrossRef]Cells 2019, 8, 252 14 of 14
34. Del Vecchio Blanco, C.; Gentile, S.; Marmo, R.; Carbone, L.; Coltorti, M. Alterations of glucose metabolism in
chronic liver disease. Diabetes Res. Clin. Pract. 1990, 8, 29–36. [CrossRef]
35. Muller, M.J.; Pirlich, M.; Balks, H.J.; Selberg, O. Glucose intolerance in liver cirrhosis: Role of hepatic and
non-hepatic influences. Eur. J. Clin. Chem. Clin. Biochem. 1994, 32, 749–758. [CrossRef] [PubMed]
36. De Franceschi, L.; Fattovich, G.; Turrini, F.; Ayi, K.; Brugnara, C.; Manzato, F.; Noventa, F.; Stanzial, A.M.;
Solero, P.; Corrocher, R. Hemolytic anemia induced by ribavirin therapy in patients with chronic hepatitis C
virus infection: Role of membrane oxidative damage. Hepatology 2000, 31, 997–1004. [CrossRef] [PubMed]
37. Robertson, M. Artificially low HbA1c associated with treatment with ribavirin. BMJ 2008, 336, 505. [CrossRef]
[PubMed]
38. Hum, J.; Jou, J.H.; Green, P.K.; Berry, K.; Lundblad, J.; Hettinger, B.D.; Chang, M.; Ioannou, G.N. Improvement
in Glycemic Control of Type 2 Diabetes After Successful Treatment of Hepatitis C Virus. Diabetes Care 2017,
40, 1173–1180. [CrossRef] [PubMed]
39. Pavone, P.; Tieghi, T.; d’Ettorre, G.; Lichtner, M.; Marocco, R.; Mezzaroma, I.; Passavanti, G.; Vittozzi, P.;
Mastroianni, C.M.; Vullo, V. Rapid decline of fasting glucose in HCV diabetic patients treated with
direct-acting antiviral agents. Clin. Microbiol. Infect. 2016, 22, 462e1-3. [CrossRef]
40. Fukuhara, T.; Ono, C.; Puig-Basagoiti, F.; Matsuura, Y. Roles of Lipoproteins and Apolipoproteins in Particle
Formation of Hepatitis C Virus. Trends Microbiol. 2015, 23, 618–629. [CrossRef] [PubMed]
41. Crouchet, E.; Baumert, T.F.; Schuster, C. Hepatitis C virus-apolipoprotein interactions: Molecular mechanisms
and clinical impact. Expert Rev. Proteom. 2017, 14, 593–606. [CrossRef] [PubMed]
42. Jiang, J.; Cun, W.; Wu, X.; Shi, Q.; Tang, H.; Luo, G. Hepatitis C virus attachment mediated by apolipoprotein
E binding to cell surface heparan sulfate. J. Virol. 2012, 86, 7256–7267. [CrossRef] [PubMed]
43. Jiang, J.; Luo, G. Apolipoprotein E but not B is required for the formation of infectious hepatitis C virus
particles. J. Virol. 2009, 83, 12680–12691. [CrossRef] [PubMed]
44. Owen, D.M.; Huang, H.; Ye, J.; Gale, M., Jr. Apolipoprotein E on hepatitis C virion facilitates infection
through interaction with low-density lipoprotein receptor. Virology 2009, 394, 99–108. [CrossRef] [PubMed]
45. Yang, Z.; Wang, X.; Chi, X.; Zhao, F.; Guo, J.; Ma, P.; Zhong, J.; Niu, J.; Pan, X.; Long, G. Neglected but Important
Role of Apolipoprotein E Exchange in Hepatitis C Virus Infection. J. Virol. 2016, 90, 9632–9643. [CrossRef]
46. Mancone, C.; Steindler, C.; Santangelo, L.; Simonte, G.; Vlassi, C.; Longo, M.A.; D’Offizi, G.; Di Giacomo, C.;
Pucillo, L.P.; Amicone, L.; et al. Hepatitis C virus production requires apolipoprotein A-I and affects its
association with nascent low-density lipoproteins. Gut 2011, 60, 378–386. [CrossRef]
47. Icard, V.; Diaz, O.; Scholtes, C.; Perrin-Cocon, L.; Ramiere, C.; Bartenschlager, R.; Penin, F.; Lotteau, V.;
Andre, P. Secretion of hepatitis C virus envelope glycoproteins depends on assembly of apolipoprotein B
positive lipoproteins. PLoS ONE 2009, 4, e4233. [CrossRef]
48. Serfaty, L.; Andreani, T.; Giral, P.; Carbonell, N.; Chazouilleres, O.; Poupon, R. Hepatitis C virus induced
hypobetalipoproteinemia: A possible mechanism for steatosis in chronic hepatitis C. J. Hepatol. 2001, 34,
428–434. [CrossRef]
49. Maillard, P.; Walic, M.; Meuleman, P.; Roohvand, F.; Huby, T.; Le Goff, W.; Leroux-Roels, G.; Pecheur, E.I.;
Budkowska, A. Lipoprotein lipase inhibits hepatitis C virus (HCV) infection by blocking virus cell entry.
PLoS ONE 2011, 6, e26637. [CrossRef] [PubMed]
50. Seki, N.; Sugita, T.; Aida, Y.; Itagaki, M.; Ishiguro, H.; Sutoh, S.; Abe, H.; Tsubota, A.; Matsushima, M.;
Aizawa, Y. Assessment of the features of serum apolipoprotein profiles in chronic HCV infection: Difference
between HCV genotypes 1b and 2. Hepatol. Int. 2014, 8, 550–559. [CrossRef]
51. Sun, H.Y.; Lin, C.C.; Lee, J.C.; Wang, S.W.; Cheng, P.N.; Wu, I.C.; Chang, T.T.; Lai, M.D.; Shieh, D.B.;
Young, K.C. Very low-density lipoprotein/lipo-viro particles reverse lipoprotein lipase-mediated inhibition
of hepatitis C virus infection via apolipoprotein C-III. Gut 2013, 62, 1193–1203. [CrossRef] [PubMed]
© 2019 by the authors. Licensee MDPI, Basel, Switzerland. This article is an open access
article distributed under the terms and conditions of the Creative Commons Attribution
(CC BY) license (http://creativecommons.org/licenses/by/4.0/).You can also read