Experimental Investigation of Air Quality in a Subway Station with Fully Enclosed Platform Screen Doors - MDPI
←
→
Page content transcription
If your browser does not render page correctly, please read the page content below
International Journal of
           Environmental Research
           and Public Health

Article
Experimental Investigation of Air Quality in
a Subway Station with Fully Enclosed
Platform Screen Doors
Liping Pang 1,2 , Chenyuan Yang 1 , Xiaodong Cao 1, *, Qing Tian 3 and Bo Li 3
 1    School of Aeronautic Science and Engineering, Beihang University, Beijing 100191, China;
      pangliping@buaa.edu.cn (L.P.); m15235135340@163.com (C.Y.)
 2    School of Aero-Engine, Shenyang Aerospace University, Shenyang 110136, China
 3    School of Information Science and Technology, North China University of Technology, Beijing 100144, China;
      tianqing@ncut.edu.cn (Q.T.); 18811756298@163.com (B.L.)
 *    Correspondence: caoxiaodong@buaa.edu.cn; Tel.: +86-188-0019-6168

 Received: 2 June 2020; Accepted: 15 July 2020; Published: 19 July 2020

 Abstract: In this study, the indoor air quality (IAQ) was investigated in a subway station with
 fully enclosed platform screen doors in Beijing, China. Eight indoor air pollutants, including
 PM2.5 , PM10 , SO2 (sulfur dioxide), NO2 (nitrogen dioxide), NH3 (ammonia), CO (carbon monoxide),
 CH2 O (formaldehyde) and TVOC (total volatile organic compound), were measured for six consecutive
 days in October 2019. The results indicated that the IAQ in the subway station was basically stable at
 good levels for most times during the whole measurement period. All eight indoor air pollutants were
 far below their corresponding maximum allowable concentrations, except for the PM2.5 concentrations,
 which occasionally exceeded the concentration limits. The concentrations of indoor air pollutants in the
 subway station were basically within the corresponding standards. The correlation analyses showed
 that outdoor air pollutants have important influences on indoor air pollutants. The concentrations
 of PM10 , PM2.5 , SO2 , NO2 and CO in the subway station were positively correlated with their
 corresponding outdoor concentrations. PM10 was statistically significantly correlated with the
 passenger flow and train frequency, but the other air pollutants were less impacted by the passenger
 flow and train frequency.

 Keywords: indoor air quality; subway station; airborne pollutants; I/O ratio

1. Introduction
     The subway system is convenient and efficient and plays an important role in relieving the
burdens of superficial traffic congestion. Meanwhile, the electric power system has been adopted in
the subway and has improved the air quality of the city [1–3]. However, the internal environment
of a subway station platform is relatively confined, which can easily cause various types of trace
air pollutants to accumulate, which will lead to potential health risks [4,5]. Epidemiological and
toxicological studies show that the concentration of particulate matter, NO2 and SO2 , can affect the
cardiovascular, pulmonary functions and respiratory system [6–8]. Short-term exposure to PM2.5
increases the risk for hospital admission for cardiovascular and respiratory diseases [9]. Long term
exposure to PM2.5 increases respiratory disease, chronic lung disease, and mortality [10]. Inhalable
CH2 O can exacerbate asthma symptoms and act as a human carcinogen [11,12]. Long-term exposure to
TVOC can easily result in childhood leukemia [13]. CO is an inorganic compound that can bind with
hemoglobin and reduce the oxygen carrying capacity of red blood cells. More than that, exposure to
CO may result in vision loss and diabetes [14,15]. NH3 has toxic effects on the central nervous system
of the human body, which can lead to behavioral disorders [16]. Consequently, it is of great significance

Int. J. Environ. Res. Public Health 2020, 17, 5213; doi:10.3390/ijerph17145213      www.mdpi.com/journal/ijerph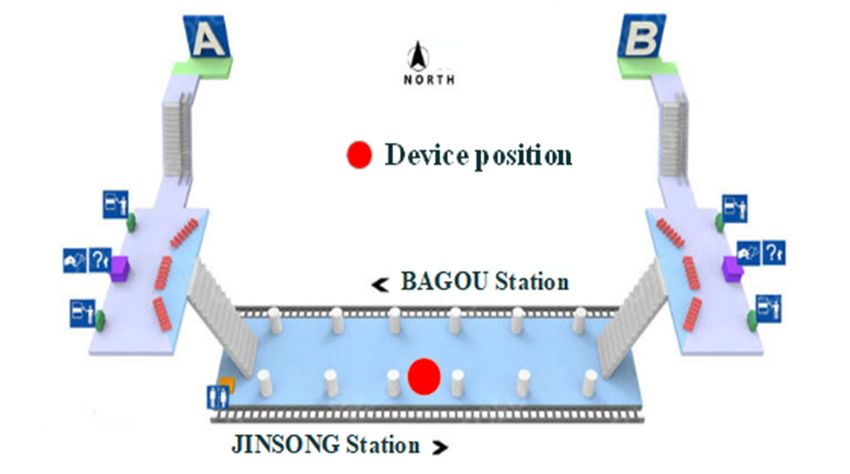
Int. J. Environ. Res. Public Health 2020, 17, 5213 2 of 15
to investigate the indoor air quality (IAQ) of subway stations, to reduce the potential health risks to
commuters, via evaluating the concentrations of above-mentioned airborne pollutants.
In recent years, many previous researchers have investigated the IAQ of subway stations in many
countries [17–36]. Song et al. [22] reported that the concentration ranges of PM10 and PM2.5 were
112–159 µg/m3 and 52–75 µg/m3 , respectively, on a Beijing subway platform, and these concentrations
were lower than the corresponding outdoor concentrations. Moreover, the authors indicated that the
outdoor environment and the service time of the subway had significant effects on the concentrations
of airborne particulate matter. The IAQ test results of Martins et al. [26] showed that the concentrations
of airborne particulate matter on the platform were approximate 1.3–1.5 times higher than those in
the outdoor environment at Barcelona subway station. They confirmed that the concentrations of
airborne particulate matter on the platform were mainly correlated with seasonal differences, the design
of the station and tunnels, the train frequency, the passenger flows and the change of ventilation
system. Park et al. [21] tested Seoul, Korea subway stations, and showed that average concentrations
of CH2 O and TVOC were 15.4 µg/m3 and 156.5 µg/m3 , respectively. Through correlation analysis and
comparison, they indicated that CH2 O and TVOC were weakly related to the depth of subway station
and the season. Another study in Seoul, Korea subway station found that the NO2 concentrations
were significantly lower than the outdoor concentrations. Although a correlation analysis confirmed
that the NO2 concentration was related to passenger flow and construction year, these factors may not
directly affect the NO2 concentration [18]. According to Moreno et al. [27], narrow platforms served
by single-track tunnels were heavily dependent on the forced tunnel ventilation and cannot rely on
the train piston effect alone to reduce platform PM concentrations. In contrast, PM levels in subway
stations with spacious double-track tunnels were not greatly affected when the tunnel ventilation was
switched off. Simultaneously, their test results for indoor and outdoor concentrations showed that the
CO concentrations in the Barcelona metro were very low.
During the daily operation of trains, a certain amount of airborne particulate matter is generated
from the friction between the railway and the wheel brake system [26]. In addition, the piston effect
produced by the movement of the trains also brings outdoor pollutants into the platform, which affects
the air quality of the subway platform [32]. In recent years, screen doors have been installed in many
subway platforms. Fully enclosed platforms can separate the platform and the tunnel. This can
isolate the heat dissipated by trains from the platform and improve the air quality inside the subway
platform [37–45]. In this study, a total of eight indoor air pollutants were measured for six consecutive
days and analyzed to evaluate the integrated indoor air quality level on a subway platform with fully
enclosed platform screen doors. The research could provide a reference for the IAQ of a subway station
and its influencing factors.
2. Method
2.1. Field Study
Eight air pollutants in a subway station platform were measured from 7:00 to 23:00 daily for
6 days, from 22 to 27, October 2019. CPR-KA, an integrated environmental monitor, was used to
monitor airborne pollutant concentrations inside a subway station in Beijing, China. Its pump suction
rate was 300 mL/min, and its sampling period was 2 min. The measurement range and precision of
CRP-KA are shown in Table 1.
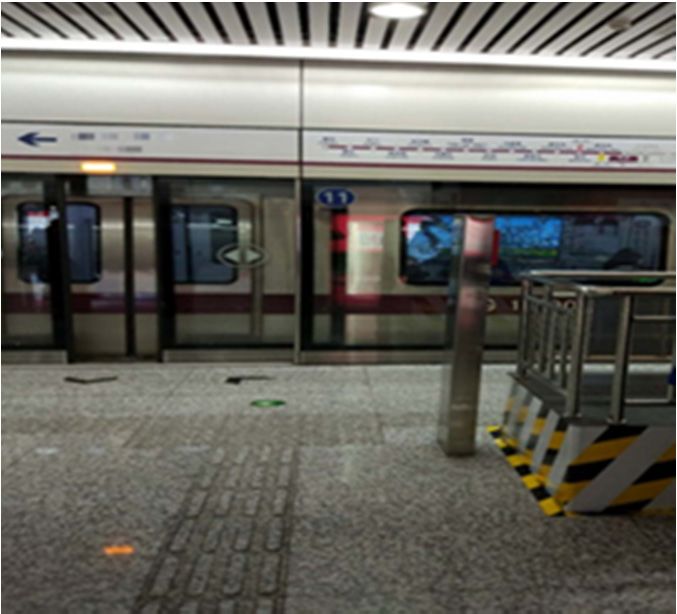
The measured subway station was a non-transfer station with fully enclosed platform screen
doors. It is an underground station with two tracks in a single tunnel, which adopts a separated
island platform design pattern with length and width of 120 m and 14 m, respectively (Figure 1a).
The environmental monitor was located at a height of 1.2 m in the middle of the platform, as shown in
Figure 1b. The design parameters of the heating, ventilation and air-conditioning (HVAC) system were
as follows:
Int. J. Environ. Res. Public Health 2020, 17, 5213                                                                        3 of 15
Int. J. Environ. Res. Public Health 2020, x, x                                                                            3 of 16

                                                     ◦ and the range of relative humidity was 40–70% in the
     (1)(1)
         TheThe  dry-bulb
               dry-bulb      temperature
                          temperature    waswas2828
                                                  ℃C  and the range of relative humidity was 40–70% in the
  station  platform   for summer    rated  conditions.
station platform for summer rated conditions.
                                                    × 10  4 3m3 /h and the fresh air rate was 1.08 ×41043 m3 /h.
     (2)(2)
         TheThe  total
              total    ventilation
                     ventilation    rate
                                  rate   was
                                       was     5.78
                                            5.78  × 10 4 m   /h and the fresh air rate was 1.08 × 10 m /h.
     TheThe  passenger
           passenger      flow
                       flow     and
                              and    arrival
                                   arrival    frequency
                                           frequency     ofof   train
                                                             train    were
                                                                    were   automatically
                                                                         automatically     recorded
                                                                                        recorded   byby
                                                                                                      thethe  subway
                                                                                                           subway
  control   centre.  The  daily  outdoor   air pollutant    data,  including
control centre. The daily outdoor air pollutant data, including PM2.52.5      PM    , PM    , CO, NO  , SO
                                                                                  , PM10,10CO, NO2, 2SO2 and2 and the
                                                                                                                the
  outdoor atmospheric
outdoor      atmospheric environment
                               environmentquality     index,index,
                                                 quality         were retrieved from the website
                                                                        were retrieved        from http://beijingair.
                                                                                                    the website
  sinaapp.com/.     The  data  sampling  frequency     was    1 h.
http://beijingair.sinaapp.com/. The data sampling frequency was 1 h.

                  (a) Measured position on platform                               (b) Platform with full-height screen doors

        Figure
      Figure     1. Measured
              1. Measured     position
                           position andand  platform.
                                        platform.      (a) Measured
                                                  (a) Measured       position
                                                               position       on platform,
                                                                        on platform,        (b) Platform
                                                                                     (b) Platform         with
                                                                                                   with full-
        full-height screen
      height screen doors. doors.

                                  Table 1. Measurement range and precision of CPR-KA.
                                Table 1. Measurement range and precision of CPR-KA.
                         Indoor Air Pollutants     Measurement Range              Precision
              Indoor Air Pollutants                             Measurement Range                             Precision
                      NH3        NH3                             0–300–30
                                                                       ppm ppm                    1 ppb      1 ppb
                     TVOC       TVOC                             0–100–10
                                                                       ppm ppm                    1 ppb      1 ppb
                       CO        CO                              0–500–50
                                                                       ppm ppm                    1 ppb      1 ppb
                     CH2O       CH2 O                            0–100–10
                                                                       ppm ppm                    1 ppb      1 ppb
                      NO2        NO2                              0–2 0–2
                                                                       ppm ppm                   0.1 ppb    0.1 ppb
                      SO2        SO2                              0–2 0–2
                                                                       ppm ppm                   0.1 ppb    0.1 ppb
                      PM10      PM10                            0–0.50–0.5
                                                                      mg/m   3 3
                                                                           mg/m               0.001 mg/m30.001 mg/m3
                     PM2.5      PM2.5                                0–0.5   3
                                                                           mg/m
                                                                0–0.5 mg/m 3                  0.001 mg/m30.001 mg/m3

2.2. Data
  2.2.    Analysis
       Data Analysis
      Statistical analysis
         Statistical        was
                     analysis    performed
                               was performed using  SPSS
                                                using SPSS 25.00 (Armonk,
                                                             25.00 (Armonk,   NY,
                                                                                NY,USA:
                                                                                    USA:IBM
                                                                                          IBMCorp.) Spearman’s
                                                                                               Corp.)  Spearman’s
correlation   analyses   were  used  to examine   the relationships    between   indoor air
  correlation analyses were used to examine the relationships between indoor air pollutants pollutants and their
                                                                                                         and  their
factors,  including   the corresponding    outdoor  concentrations,     the train frequency, and  the
  factors, including the corresponding outdoor concentrations, the train frequency, and the passenger passenger
flow.
  flow. Differences
          Differences were
                       were considered
                              consideredsignificant
                                          significantwhen
                                                      whenp p<
Int. J. Environ. Res. Public Health 2020, x, x 4 of 16
Int. J. Environ. Res. Public
TableHealth 2020, 17, 5213standard of integrated article air quality index (AQI).
2. Classification 4 of 15
Integrated
Air Level Implication
AQI Table 2. Classification standard of integrated article air quality index (AQI).
0–0.5 Good Air quality is satisfactory.
Integrated AQI Air Level Implication
Air quality is acceptable. There may be some risks for unusually sensitive
0.5–1.0 Acceptable
0–0.5 Good groups.
Air quality is satisfactory.
0.5–1.0 Acceptable Air
Onequality is acceptable.
air pollutant exceedsThere may value.
its limit be some risks are
There for unusually sensitive
potential health groups.
risks for
1.0–1.5 Slight One air pollutant exceeds its limit value. There are potential health risks for the
1.0–1.5 Slight the susceptive groups.
susceptive groups.
1.5–2.0 Moderate Two or three air pollutants exceed their limit values. There are health risks.
1.5–2.0 Moderate Two or three air pollutants exceed their limit values. There are health risks.
Morethan
More thanthree
threeair
airpollutants
pollutants exceed
exceed their
their limit
limit values.
values.
>2.0
>2.0 Heavy
Heavy Thereare
There areserious
serioushealth
healthrisks.
risks.
According to some indoor air quality standards [48–51], the maximum permissible
concentrations of air pollutants are listed in Table 3.
According to some indoor air quality standards [48–51], the maximum permissible concentrations
of air pollutants are listed in Table 3.
Table 3. Maximum permissible concentrations of indoor air pollutants.
Table 3. MaximumConcentration
Air Pollutants permissible concentrations of indoorTime-Average
Limit References air pollutants.
CO 10 mg/m3 [48–50] 1 h average
Air Pollutants Concentration Limit References Time-Average
CH2O 0.12 mg/m3 [48] n/a
CO TVOC 10 mg/m 3 [48–50] 1 h average
0.6 mg/m3 [50] 8 h average
3 3
CH2 O SO2 0.12 0.5
mg/mmg/m [48]
[50] 1 h average n/a
TVOC NH3 0.6 mg/m 3 [50] 8 h average
0.2 mg/m3 [50] 1 h average
SO2 0.5 0.24
mg/m 3 [50] 1 h average
NO2 mg/m3 [50] 1 h average
NH3 PM10 3 [50]
0.2 0.25
mg/m mg/m3 [48,49] n/a 1 h average
NO2 PM2.5 0.24 mg/m 3 [50] 1 h average
75 μg/m3 [51] 24 h average
PM10 0.25 mg/m3 [48,49] n/a
PM2.5 75 µg/m3 [51] 24 h average
3. Results
3. Results
3.1. Passenger Flow and Train Frequency
The passenger
3.1. Passenger flow
Flow and and
Train train frequency are shown in Figure 2. Day 1 to day 4 represent the
Frequency
weekdays of Tuesday to Friday, and day 5 to day 6 represent the weekend days of Saturday and
The passenger flow and train frequency are shown in Figure 2. Day 1 to day 4 represent the
Sunday. As shown in Figure 2, the train frequency and passenger flow on the weekdays were
weekdays of Tuesday to Friday, and day 5 to day 6 represent the weekend days of Saturday and Sunday.
obviously higher than those on the weekends during the peak hours. The passenger flow peaks in
As shown in Figure 2, the train frequency and passenger flow on the weekdays were obviously higher
the subway station were at 8:00–9:00 and 18:00–9:00 on weekdays. The average passenger number
than those on the weekends during the peak hours. The passenger flow peaks in the subway station
was 67,126 per hour. The passenger traffic was much busier during the morning peak. There was no
were at 8:00–9:00 and 18:00–9:00 on weekdays. The average passenger number was 67,126 per hour.
clear difference in train frequency and passenger flow during the off-peak hours between weekdays
The passenger traffic was much busier during the morning peak. There was no clear difference in train
and the weekend.
frequency and passenger flow during the off-peak hours between weekdays and the weekend.
14000 day 1 day 2
12000 day 3 day 4
day 5 day 6
passenger flow
(passengers/h)
10000
8000
6000
4000
2000
0
7 8 9 1011121314151617181920212223
Time(h)
(a) Train frequency (b) Passenger flow
Figure 2.
Figure 2. Variations
Variationsofofdaily
dailytrain
train frequency
frequency and
and passenger
passenger flow.
flow. (a) Train
(a) Train frequency.
frequency. (b) Passenger
(b) Passenger flow.
flow.
3.2. Air Pollutant Concentrations
3.2. Air Pollutant
Figure 3 andConcentrations
Table 4 illustrate the variations of indoor air pollutant concentrations in the subway
station. The variations of indoor NH3 concentrations ranged from 0.012 mg/m3 to 0.014 mg/m3 ,Int. J. Environ. Res. Public Health 2020, 17, 5213 5 of 15
as shown in Figure 3a. The indoor NH3 concentrations were basically stable at a low level, and did not
exceed the maximum permissible concentration of 0.2 mg/m3 . Figure 3b shows that the concentrations
of indoor CH2 O were from 0.008 mg/m3 to 0.079 mg/m3 . Most of the concentrations were below
0.08 mg/m3 and did not exceed the maximum permissible concentration of 0.12 mg/m3 . Figure 3c depicts
the concentrations of indoor TVOC remaining in the range between 0.374 mg/m3 and 0.423 mg/m3 .
The TVOC concentrations kept quite consistent during the test period and did not exceed the maximum
permissible concentration of 0.6 mg/m3 .
The indoor NO2 concentrations changed notably with time from 0.006 mg/m3 to 0.127 mg/m3 ,
as shown in Figure 3d, but they remained below the maximum permissible concentration of 0.24 mg/m3 .
The indoor NO2 concentrations increased markedly from 17:00 and reached their peaks at 20:00–21:00,
except for on day 3.
In Figure 3e, the indoor SO2 concentrations fluctuated in the range between 0.001 mg/m3 to
0.007 mg/m3 and remained below the maximum permissible concentration of 0.5 mg/m3 . The indoor
SO2 concentrations rose from 11:00 to their peak values at approximately 16:00, and then decreased.
The daily trends were similar throughout the whole test period.
Figure 3f shows that the variations of indoor CO concentrations were from 0.046 mg/m3 to
0.111 mg/m3 . These were below the maximum permissible concentrations during the test period.
From day 1 to day 3, the indoor CO concentrations fluctuated with time. However, the peak values
appeared at different times. From day 4 to day 6, the indoor CO concentrations did not obviously
fluctuate with time. Hence, the indoor CO concentrations were less impacted by the changes of train
frequency and passenger flow.
The concentration ranges of indoor PM2.5 and PM10 were from 0.006 mg/m3 to 0.196 mg/m3
and from 0.008 mg/m3 to 0.237 mg/m3 , respectively, as shown in Figure 3g,h. The indoor PM10
concentrations did not exceed the maximum permissible concentration of 0.25 mg/m3 . The average
indoor PM2.5 concentrations also remained below the maximum permissible concentration of 75 µg/m3 ,
except for on day 2. Except for that on day 3, the peaks of indoor PM concentrations occurred between
19:00 and 21:00. Although their concentrations fluctuated with time, their change trends were different
from the
Int. J.trends
Environ.of
Res.passenger flowx, and
Public Health 2020, x train frequency. 6 of 16
0.015 0.1
CH2O concentration
NH3 concentration
0.014 0.08
(mg/m3)
(mg/m3)
0.013 0.06
0.012 0.04
0.011 0.02
0.01 0
7 8 9 1011121314151617181920212223 7 8 9 1011121314151617181920212223
Time(h) Time(h)
(a) NH3 (b) CH2O
0.46 0.12
TVOC concentration
NO 2 concentration
0.44 0.1
0.42 0.08
(mg/m3)
(mg/m3)
0.4 0.06
0.38 0.04
0.36 0.02
0.34 0
7 8 9 1011121314151617181920212223 7 8 9 10 11 12 13 14 15 16 17 18 19 20 21 22 23
Time(h) Time(h)
(c) TVOC (d) NO2
0.007 Figure 3. Cont. 0.12
0.006 0.11
S O 2 concentration
CO concentration
0.005 0.1
0.09
(mg/m3)
(mg/m3)
0.004
0.08
0.003
0.07
0.002 0.06
0.001 0.050.4 0.06
(mg
NO 2 con
(m
TVOC co
0.38 0.04
0.36 0.02
0.34 0
7 8 9 1011121314151617181920212223 7 8 9 10 11 12 13 14 15 16 17 18 19 20 21 22 23
Time(h) Time(h)
Int. J. Environ. Res. Public Health 2020, 17, 5213 6 of 15
(c) TVOC (d) NO2
0.007 0.12
0.006 0.11
S O 2 concentration
CO concentration
0.005 0.1
0.09
(mg/m3)
(mg/m3)
0.004
0.08
0.003
0.07
0.002 0.06
0.001 0.05
0 0.04
7 8 9 1011121314151617181920212223 7 8 9 1011121314151617181920212223
Time(h) Time(h)
(e) SO2 (f) CO
0.25 0.25
PM10 concentration
PM2.5 concentration
0.2 0.2
(mg/m3)
(mg/m3)
0.15 0.15
0.1 0.1
0.05 0.05
0 0
7 8 9 1011 12 13 1415 16 17 1819 20 21 2223 7 8 9 10 11 12 13 14 15 16 17 18 19 20 21 22 23
Time(h) Time(h)
(g) PM2.5 (h) PM10
FigureFigure 3. Variations
3. Variations of indoor
of indoor airair pollutantconcentrations
pollutant concentrations ininthe
thesubway station.
subway (a) NH
station. (b) CH
(a)3,NH 2O,
3 , (b) CH2 O,
(c) TVOC, (d) NO 2, (e) SO2, (f) CO, (g) PM2.5, (h) PM10.
(c) TVOC, (d) NO2 , (e) SO2 , (f) CO, (g) PM2.5 , (h) PM10 .
Int. J. Environ. Res. Public Health 2020, x, x 7 of 16
Table 4. Indoor
Table airair
4. Indoor pollutant
pollutantconcentrations
concentrations ininthe
the subway
subway station.
station.
Concentration
Min Max Mean ± SD Maximum
Mean ± SD Maximum
(Mg/M3)Permissible
Pollutants Pollutants
Min (Mg/M 3) 3
(Mg/M ) Max (Mg/M
(Mg/M 3) 3 ) (Mg/M3) 3 Permissible
NH3 0.012 0.014 (Mg/M
0.012 ± 0.0004 ) Concentration
0.200 (Mg/M3 )
NH3 CH2O 0.012
0.008 0.014
0.079 0.012
0.035 ± 0.0004
± 0.0161 0.1200.200
CH2 OTVOC 0.008
0.374 0.079
0.423 0.035
0.405 ± 0.0161
± 0.0092 0.6000.120
TVOC NO2 0.374
0.006 0.423
0.127 0.405 ± 0.0092
0.034 ± 0.026 0.2400.600
NO2 SO2 0.006
0.001 0.127
0.007 0.034 ± 0.026
0.003 ± 0.0012 0.5000.240
SO2 CO 0.001
0.046 0.007
0.111 0.003 ± 0.0012
0.059 ± 0.0144 10.0000.500
CO 0.046 0.111 0.059 ± 0.0144 10.000
PM10 0.008 0.237 0.061 ± 0.044 0.250
PM10 0.008 0.237 0.061 ± 0.044 0.250
PM2.5 0.006 0.196 0.048 ± 0.036 0.075
PM2.5 0.006 0.196 0.048 ± 0.036 0.075
3.3. AQI
3.3. AQI
Figure 4 shows variations of indoor AQI during the days of investigation. Most of the days,
Figure 4 shows variations of indoor AQI during the days of investigation. Most of the days, except
except for day 2, showed values below 0.5 and remained at a good level. The change range of AQI on
for day 2, showed values below 0.5 and remained at a good level. The change range of AQI on day 2
day 2 was approximately 0.6–0.7. The AQI level during day 2 was at an acceptable level which was
was approximately 0.6–0.7. The AQI level during day 2 was at an acceptable level which was affected
affected by the serious outdoor air pollution.
by the serious outdoor air pollution.
0.8
0.7
0.6 day 1
0.5 day 2
AQI
0.4 day 3
0.3 day 4
0.2 day 5
0.1 day 6
0
7 8 9 10 11 12 13 14 15 16 17 18 19 20 21 22 23
Time(h)
Variationsof
Figure4.4.Variations
Figure ofindoor
indoorAQI
AQIin
inthe
thesubway
subwaystation.
station.
4. Discussion
4.1. Variations of Indoor Air PollutantsInt. J. Environ. Res. Public Health 2020, 17, 5213 7 of 15
4. Discussion
4.1. Variations of Indoor Air Pollutants
The NH3 was mostly generated indoors, such as from the toilets on the platform [52]. The indoor
NH3 has been well diluted by the HVAC system to maintain a low level far below the concentration
limit. The indoor CH2 O mainly accumulated from the emissions of building materials, furniture and
various adhesive coatings [53]. The change of indoor CH2 O concentrations could be related to indoor
temperature. Higher indoor temperature can be helpful for the release of more CH2 O from the building
finishing materials [54]. This might explain the increase of CH2 O concentrations which occurred at the
morning or evening peaks. The TVOC concentrations remained stable during the test period, because
the TVOC mostly came from the building material emissions [55]. In sum, the concentrations of NH3
and TVOC (including CH2 O) were mostly generated indoors and kept relatively stable during the test
period by the ventilation of the HVAC system.
Figure 5 shows the variations of outdoor air pollutant concentrations during the measurement.
It can be seen that the daily variations of indoor NO2 , SO2 , CO, PM2.5 and PM10 concentrations
were quite consistent with the corresponding variations of outdoor concentrations. The indoor NO2 ,
SO2 and CO mainly came from the exhaust of motor vehicles introduced through the HVAC system
and subway entrances [56]. Similarly, a large portion of indoor PM10 and PM 2.5 came from the road
re-suspension dust and vehicular emissions [57], which were also brought in by the ventilation of
HVAC system or directly through the entrances. Meanwhile, most of vehicle exhausts were found to
be composed of fine aerosol lower than 2.5 µm. Thus, the daily change trends of indoor PM2.5 and
PM10 were well correlated (Figure 3g,h), which was consistent with the findings of Park et al. [58]
Consequently, the indoor NO2 , SO2 , CO, PM2.5 , PM10 concentrations basically fluctuated with their
corresponding outdoor concentrations. Meanwhile, their indoor concentrations were basically lower
than the outdoor concentrations due to the filtration and dilution by the ventilation of HVAC system.
In general, the peaks of indoor concentrations of these five pollutants mainly occurred during
the morning or evening rush hours. Therefore, highly congested traffic situations during the peak
hours may exacerbate the IAQ of subway station under the ground vehicle road. There were bus stops
located next to the subway station entrance so that passengers connect conveniently, which could also
contribute to the variations of the pollutants.
4.2. Comparison with Previous Studies
Table 5 shows the indoor air pollutant concentrations from other references. As shown in Table 5,
the studies used for the comparison were mostly conducted in the summer and transitional season,
with HVAC systems in operation. In our study, the measurement campaign was performed in late
October (transitional season), when the weather in Beijing was mild, but the HVAC system of the
subway station was still operating in cooling mode due to the high passenger flow. The average
passenger numbers given in the few studies were also comparable to the average passenger flow of
the subway station investigated in our study. Most of the previous studies shown in Table 5 have
investigated multiple subway stations, but the stations size and ventilation system parameters could
not be compared, due to a lack of relevant information in these studies.
The average indoor NH3 concentration of 0.012 mg/m3 in our study was relatively low, compared
with the NH3 concentration given in the references [59]. The average indoor CH2 O and TVOC
concentrations were 0.035 mg/m3 and 0.405 mg/m3 , which were much higher than the concentrations
on the Seoul subway platforms [21] and the Taipei subway platform [60]. They also indicated that the
indoor TVOC (including CH2 O) concentrations had no correlation with the number of passengers,
but had a weak correlation with the depth of the platform. This support our findings that the indoor
TVOC (including CH2 O) concentrations could be primarily attributed to the emissions of interior
building materials. The higher TVOC concentrations measured in our study were probably caused by
the emissions of detrimental decoration materials.Int. J. Environ. Res. Public Health 2020, x, x 8 of 16
Int. J. Environ. Res. Public Health 2020, x, x 8 of 16
Consequently, the indoor NO2, SO2, CO, PM2.5, PM10 concentrations basically fluctuated with their
correspondingthe
Consequently, outdoor
indoor concentrations.
NO2, SO2, CO,Meanwhile,
PM2.5, PM10their indoor concentrations
concentrations were basically
basically fluctuated with lower
their
than the outdoor
corresponding concentrations
outdoor due to Meanwhile,
concentrations. the filtrationtheir
and dilution by the ventilation
indoor concentrations wereofbasically
HVAC system.
lower
Int. J. Environ. Res. Public Health 2020, 17, 5213
In general,
than the outdoor the peaks of indoor
concentrations due toconcentrations of these
the filtration and fiveby
dilution pollutants mainlyofoccurred
the ventilation during 8 of 15
HVAC system.
the morning or the
In general, evening
peaksrush hours.concentrations
of indoor Therefore, highly congested
of these traffic situations
five pollutants during the
mainly occurred peak
during
hours
the may exacerbate
morning or eveningthe IAQ
rush of subway
hours. station
Therefore, under
highly the ground
congested vehicle
traffic road.during
situations There were bus
the peak
Thehours
average
stops located
may NO 2 concentration
next to the
exacerbate IAQ of in
the subway our study
station
subway stationwas
entrance slightly
so that
under lower
passengers
the ground than road.
connect
vehicle the average
conveniently,concentration
There were which
bus
on the Seoul
stops subway
couldlocated platforms
also contribute
next to the
to the [18]. The
variations
subway I/O
of
station theratios of
so NO
pollutants.
entrance in our study
that2passengers wereconveniently,
connect also quite similar
which to the
I/O ratios of 0.59–0.74,
could as indicated
also contribute in the
to the variations of reference [18]. The higher outdoor concentrations of NO2
the pollutants.
could be attributed to the diesel exhaust fumes from motor vehicles on the roads in urban areas.
0.140 0.014
0.120 0.012
0.014
2 concentration
0.140
O 2 concentration
0.100
0.120 0.01
0.012
2 concentration
S O 2Sconcentration
) 3)
) 3)
0.080
0.100 0.008
0.01
(mg/m
(mg/m
0.060
3
0.080
3
0.006
0.008
(mg/m
(mg/m
0.040
0.060 0.004
0.006
NO NO
0.020
0.040 0.002
0.004
0.000
0.020
7 8 9 1011121314151617181920212223 0.0020
0.000 7 8 9 101112 13 14 15 16 17 1819202122 23
Time(h)
7 8 9 1011121314151617181920212223 0 Time(h)
7 8 9 101112 13 14 15 16 17 1819202122 23
Time(h) Time(h)
(a) NO2 (b) SO2
(a) NO2 (b) SO2
0.2
3.5 2.5 concentration
0.2
3.53
concentration
0.15
PMconcentration
2.5
3
concentration
) 3)
) 3)
0.15
2.52
(mg/m
(mg/m
0.1
1.5
3
3
2
(mg/m
(mg/m
0.1
1.51 0.05
CO CO
0.5
1
PM2.5
0.05
0.50 0
0 7 8 9 1011121314151617181920212223 0
7 8 9 10 11 12 13 14 15 16 17 18 19 20 21 22 23
Time(h)
7 8 9 1011121314151617181920212223 Time(h)
7 8 9 10 11 12 13 14 15 16 17 18 19 20 21 22 23
Time(h) Time(h)
(c) CO (d) PM2.5
(c) CO (d) PM2.5
0.2
10 concentration
0.2
0.15
concentration
) 3)
0.15
(mg/m
0.1
3
(mg/m
0.1
0.05
PM
0.05
PM10
0
7 8 9 10 11 12 13 14 15 16 17 18 19 20 21 22 23
0 Time(h)
7 8 9 10 11 12 13 14 15 16 17 18 19 20 21 22 23
Time(h)
(e) PM10
(e) PM10
Variations
Figure 5.Figure of outdoor
5. Variations air pollutant
of outdoor concentrations
air pollutant duringthe
concentrations during the measurement.
measurement. (a)2, (b)
(a) NO NOSO2 , 2,(b) SO2 ,
(c) CO, (d)
(c) PM (d)
CO,5.2.5
Figure , (e) PM
PM2.5,
Variations (e)10
ofPM.outdoor
10. air pollutant concentrations during the measurement. (a) NO2, (b) SO2,
(c) CO, (d) PM2.5, (e) PM10.
The4.2.
average SO2with
Comparison concentration in our study was 0.003 mg/m3 , which was much lower than the
Previous Studies
4.2. Comparison
concentrations withinPrevious
reported Studies
the Guangzhou subway stations [61]. The average indoor CO concentration
of 0.059 mg/m3 was much lower the average concentration reported in the Taipei subway stations [60],
but quite comparable with the average concentration in the Nanjing subway stations [62]. There was no
indoor source for CO and SO2 in the subway station, therefore the indoor CO and SO2 basically came
from the contaminated ambient air being brought down from street level. The relatively low indoor
CO and SO2 concentrations in the Beijing subway station indicated a good ventilation performance by
the HVAC system.
The average PM10 concentration of 0.061 mg/m3 was lower than the concentrations reported in
the subway stations in Taipei [60], Nanjing [62] and Seoul [63]. The average PM2.5 concentration was
0.048 mg/m3 , which was also lower than the concentrations reported in the references [60] and [58].
The lower PM concentrations observed in our study could be attributed to both the platform screenInt. J. Environ. Res. Public Health 2020, 17, 5213 9 of 15
doors and the good ventilation performance of the HVAC system. There is a certain amount of PM
generated from the train operation [26]. Several researchers have indicated that the fully enclosed
platform screen doors could help prevent the PM generated by the train operation from entering the
platform [26,41]. In addition, the screen doors could also prevent a portion of outdoor air pollutants
from entering the platform through the piston wind in the tunnel [42]. Nevertheless, the indoor space
of the station would be decreased by installing the fully enclosed screen doors, which might result in a
slight increase of other indoor air pollutant concentrations.
It is worth noting that the majority of indoor PM was still introduced from outdoors through the
HVAC system and station entrances, which could not be prevented by screen doors. As shown in
Table 5, high PM10 concentrations were observed in the Nanjing subway stations [62], which could be
attributed to the ventilation method they used in the transitional season. During the time of sampling,
they used natural ventilation systems instead of HVAC systems, which no doubt fully reduced both
the ventilation rates and filtration efficiency. Similarly, the high PM10 concentrations reported in the
Seoul subway stations were also caused by insufficient air circulation and improper ventilation [56].
In their study, the PM10 concentrations on platforms were even obviously higher than those outdoors,
because the ventilation was insufficient to remove the accumulated particles brought in from outdoors.
Therefore, the proper operation of the HVAC system was also crucial to control the concentrations of
indoor PM and other pollutants to maintain them at acceptable levels.
Table 5. Indoor air pollutants concentrations measured in subway stations in previous studies.
Average
Average
Pollutant City Reference Platform Type Season Passenger
Concentration
Per Hour
NH3 119.63 ± 3.06 µg/m3 Kunming [59] Fully enclosed platform n/a n/a
CH2 O 15.4 ± 7.2 µg/m3 Seoul [21] Fully enclosed platform Summer 45,115
Both fully and semi
CH2 O 0.017 ± 0.016 mg/m3 Taipei [60] Summer n/a
enclosed platforms
Both fully and semi
TVOC 0.064 ± 0.035 ppm Taipei [60] Summer n/a
enclosed platforms
TVOC 156.5 ± 78.2 µg/m3 Seoul [21] Fully enclosed platform Summer 45,115
NO2 0.053 ± 0.008 mg/m3 Seoul [18] Fully enclosed platform Summer 37,908
SO2 0.13 ± 0.01 mg/m3 Guangzhou [61] Fully enclosed platform Summer n/a
Both fully and semi
CO 2.825 ± 0.69 mg/m3 Taipei [60] Summer n/a
enclosed platforms
Transitional
CO 0.3 ± 0.2 mg/m3 Nanjing [62] Fully enclosed platform n/a
season
Transitional
PM10 0.185 ± 0.128 mg/m3 Nanjing [62] Fully enclosed platform n/a
season
PM10 90.7 ± 9.9 µg/m3 Seoul [63] Fully enclosed platform Summer 57,251
Both fully and semi
PM10 80.9 ± 34.9 µg/m3 Taipei [60] Summer n/a
enclosed platforms
PM2.5 105.4 ± 14.4 µg/m3 Seoul [58] n/a Winter n/a
Both fully and semi
PM2.5 56.2 ± 33.1 µg/m3 Taipei [60] Summer n/a
enclosed platforms
4.3. I/O Ratios
Figure 6 shows the indoor and outdoor (I/O) ratios of PM2.5 , PM10 , SO2 , NO2 and CO concentrations.
The indoor PM concentrations in the subway station fluctuated with the variations of the corresponding
outdoor concentrations, as shown in Figure 6a,b. It was reported that some particles would be generated
in the subway, due to the friction between the track and the wheel [26]. In addition, when the passenger
flows were large, the airborne particulate matter from the floor would be re-suspended, due to the
passenger movement around the subway platform [58]. Hence, increased passenger flow may cause an
increase in the particle concentration in the subway platform. The I/O ratios of PM2.5 and PM10 were
within the ranges of 0.77–2.34 and 0.57–1.58, respectively. During most of that time, the indoor PM
concentrations were smaller than the outdoor concentrations, which indicated that the fully enclosedInt. J. Environ. Res. Public Health 2020, 17, 5213 10 of 15
platform screen doors could prevent the generation of pollutants from the train running [64]. Thus,
the PM in the subway station mainly came from the outdoor environment through the HVAC system
and the entrances. On days 3 and 4, the indoor PM concentrations were higher than the outdoor
concentrations, which might have been affected by the concentrations of the previous day. The air
conditioning system was switched off after the last train every day, possibly resulting in the accumulation
of indoor air pollutants on the platform. Therefore, the average indoor air pollutants’ concentrations
could
Int. be affected
J. Environ. by the
Res. Public high
Health concentration
2020, x, x in the previous day, such as the day 2 in this study.
11 of 16
indoor indoor
0.99 0.99 1.08 2.34 0.78 0.77 0.57 0.81 1.03 1.58 0.57 0.64
outdoor outdoor
(a) PM2.5 (b) PM10
indoor indoor
0.76 0.83 1.18 1.18 0.66 0.66 0.50 0.81 0.76 0.51 0.45 0.58
outdoor outdoor
(c) SO2 (d) NO2
indoor
0.06 0.06 0.07 0.12 0.09 0.07
outdoor
(e) CO
Figure 6. Comparison between the indoor and outdoor air pollutant concentrations. (a) PM2.5, (b) PM10,
Figure 6. Comparison between the indoor and outdoor air pollutant concentrations. (a) PM2.5 , (b) PM10 ,
(c) SO2, (d) NO2, (e) CO.
(c) SO2 , (d) NO2 , (e) CO.
4.4. Influencing Factors
Table 6 lists the correlation analysis between indoor air pollutants and their influencing factors,
including the corresponding outdoor concentrations, train frequency and passenger flow.Int. J. Environ. Res. Public Health 2020, 17, 5213 11 of 15
SO2 is the combustion product of coal or oil, and is mainly associated with industrial sources [65].
There was no SO2 production source in the subway station. Indoor SO2 was mainly affected by the
outdoor SO2 through the ventilation. As shown in Figure 6c, the indoor SO2 concentrations were
mainly consistent with the outdoor SO2 concentration. The I/O ratios of SO2 were in the range between
0.44 to 2.15. Similar to the indoor PM concentrations, the indoor SO2 concentrations were also higher
than the outdoor concentrations on days 3 and 4.
The indoor NO2 concentrations were lower than the outdoor NO2 concentrations, and the I/O
ratios were from 0.45 to 0.81, as shown in Figure 6d. It is generally believed that the NO2 is mainly
caused by the emission of outdoor road diesel vehicles [66]. The indoor NO2 concentrations were
influenced by the outdoor NO2 concentrations.
The indoor CO concentrations were much lower than the outdoor CO concentrations, and the
I/O ratios were from 0.06 to 0.12, as shown in Figure 6e. CO is produced by incomplete combustion.
The indoor CO concentrations are at relatively low levels, because there is no chemical combustion or
smoking in the subway station. Hence, the indoor CO might come from the traffic-contaminated air
from outdoors [29].
4.4. Influencing Factors
Table 6 lists the correlation analysis between indoor air pollutants and their influencing factors,
including the corresponding outdoor concentrations, train frequency and passenger flow. Furthermore,
the correlations between the indoor AQI and the outdoor atmospheric environment quality index,
train frequency and passenger flow were also analyzed.
The results showed that the indoor PM10 concentrations were statistically significantly correlated
with the outdoor PM10 concentration (r = 0.858, p< 0.01), the passenger flow (r = 0.201, p < 0.05) and
the train frequency (r = 0.209, p < 0.05). Other air pollutant concentrations were strongly correlated
with their corresponding outdoor concentrations, but less impacted by the passenger flows and train
frequency. The AQI also had a significant correlation with the outdoor atmospheric environment
quality index (r = 0.649, p < 0.01). Hence, the outdoor air pollutants had significant contributions to
the indoor concentrations through the HVAC system. The variations of indoor concentrations of SO2 ,
CO, NO2 , PM10 and PM2.5 were most likely related to their corresponding outdoor concentrations.
According to the correlation analysis, the indoor PM2.5 concentrations and gaseous pollutants
were only correlated to the outdoor environment. In contrast, the indoor PM10 concentrations were
not only affected by the outdoor environment, but also related to the passenger flow and the train
frequency. Martins et al. [26] indicated that the PM2.5 concentrations in subway platforms with screen
doors were lower than those in open subway stations. Therefore, the fully enclosed platform screen
doors can better prevent the fine particles produced by the trains from moving to the platform.
Table 6. Correlation coefficients between indoor pollutants and influencing factors.
Indoor Air Pollutants and AQI
Factors
PM2.5 PM10 SO2 NO2 CO NH3 TVOC CH2 O AQI
Corresponding
0.951 ** 0.858 ** 0.732 ** 0.868 ** 0.915 ** n/a n/a n/a 0.649 **
outdoor values
Passenger flows 0.190 0.201 * –0.129 0.125 0.149 0.128 −0.012 0.184 0.164
Train frequency 0.198 0.209 * −0.136 0.143 0.170 0.098 −0.068 0.199 0.164
** p < 0.01, * p < 0.05.
5. Conclusions
In this study, eight airborne pollutants in a subway station with fully enclosed screen doors were
consecutively measured for six days in Beijing, China. The IAQ performance of the station has been
evaluated comprehensively, and compared with previous studies. The potential influencing factors of
IAQ were also discussed. Future studies were recommended to investigate more subway stations withInt. J. Environ. Res. Public Health 2020, 17, 5213 12 of 15
different station sizes, passenger flows, platform types and ventilation systems, meanwhile covering
more outdoor climate conditions. The main conclusions of this study are summarized as follows:
(1) The concentrations of indoor air pollutants on the subway platform were basically within the
corresponding standards. The AQI were at good and acceptable levels during the whole measurement.
(2) The concentrations of NH3 and TVOC (including CH2 O) were kept relatively stable during the
test period, because they were mostly generated from indoor emission sources and were well diluted
by the ventilation of HVAC system.
(3) The concentrations of indoor PM10 , PM2.5 , SO2 , NO2 and CO were positively correlated
with their corresponding outdoor concentrations. The daily variations of these indoor air pollutant
concentrations were also influenced by the corresponding variations of outdoor concentrations to a
large extent. The indoor concentrations were generally lower than the outdoor concentrations, due to
the filtration and dilution by the HVAC system.
(4) Except for the indoor PM10 , the other indoor pollutants and the overall air quality had no
statistically significant correlation with the passenger flow and the train frequency. Therefore, the fully
enclosed platform screen doors can effectively prevent the fine particles produced by the train operation
from moving into the platform area. However, it is worth noting that the indoor pollutants were still
mostly introduced from outdoors through the HVAC system and subway entrances, as indicated by
the correlation analyses, which could not be prevented by screen doors. The proper operation of HVAC
system was also crucial to control the indoor pollutant concentrations at acceptable levels.
Author Contributions: L.P. led the data analysis and drafted the manuscript. C.Y., X.C., Q.T. and B.L. participated
in the study design and field study. C.Y. and X.C. participated in interpretation of the data and assisted in the
drafting of the manuscript. They conceived the study and contributed a lot to improve the manuscript quality.
All authors contributed to, read and approved the final manuscript. All authors have read and agreed to the
published version of the manuscript.
Funding: This research was funded by the Liao Ning Revitalization Talents Program (XLYC1802092) and the
Youth top-notch talent support program of Beihang University (YWF-20-BJ-J-1008).
Acknowledgments: We thank the anonymous peer-reviewers for their excellent comments that have enhanced
the manuscript.
Conflicts of Interest: The authors declare no conflict of interest.
References
1. Zheng, S.; Zhang, X.; Sun, W.; Wang, J. The effect of a new subway line on local air quality: A case study in
Changsha. Transp. Res. Part 2019, 68, 26–38. [CrossRef]
2. Da Silva, C.B.P.; Saldiva, P.H.N.; Amato-Lourenço, L.F.; Rodrigues-Silva, F.; Miraglia, S.G.E.K. Evaluation of
the air quality benefits of the subway system in Sao Paulo, Brazil. J. Environ. Manag. 2012, 101, 191–196.
[CrossRef] [PubMed]
3. Wang, Y.; Li, X. STESS: Subway thermal environment simulation software. Sustain. Cities Soc. 2018, 38,
98–108. [CrossRef]
4. Kim, G.S.; Son, Y.S.; Lee, J.H.; Kim, I.W.; Kim, J.C.; Oh, J.T.; Kim, H. Air pollution monitoring and control
system for subway stations using environmental sensors. J. Sens. 2016, 2016. [CrossRef]
5. Xu, B.; Hao, J. Air quality inside subway subway indoor environment worldwide: A review. Environ. Int.
2017, 107, 33–46. [CrossRef]
6. Chow, J.C.; Watson, J.G.; Mauderly, J.L.; Costa, D.L.; Wyzga, R.E.; Vedal, S.; Hidy, G.M.; Altshuler, S.L.;
Marrack, D.; Heuss, J.M.; et al. Health effects of fine particulate air pollution: Lines that connect. Air Repair
2006, 56, 1368–1380.
7. Valavanidis, A.; Fiotakis, K.; Vlachogianni, T. Airborne particulate matter and human health: Toxicological
assessment and importance of size and composition of particles for oxidative damage and carcinogenic
mechanisms. J. Environ. Sci. Health Part 2008, 26, 339–362. [CrossRef]
8. Dominici, F.; Peng, R.D.; Bell, M.L.; Pham, L.; McDermott, A.; Zeger, S.L.; Samet, J.M. Fine particulate air
pollution and hospital admission for cardiovascular and respiratory diseases. JAMA 2006, 295, 1127–1134.
[CrossRef]Int. J. Environ. Res. Public Health 2020, 17, 5213 13 of 15
9. Meng, X.; Wang, C.C.; Cao, D.C.; Wong, C.M.; Kan, H.D. Short-term effect of ambient air pollution on COPD
mortality in four Chinese cities. Atmos. Environ. 2013, 77, 149–154. [CrossRef]
10. Pun, V.C.; Kazemiparkouhi, F.; Manjourides, J.; Suh, H.H. Long-term PM2.5 exposure and respiratory, cancer,
and cardiovascular mortality in older us adults. Am. J. Epidemiol. 2017, 186, 961–969. [CrossRef]
11. Casset, A.; Marchand, C.; le Calvé, S.; Mirabel, P.; de Blay, F. Human exposure chamber for known
formaldehyde levels: Generation and validation. Indoor Built Environ. 2005, 14, 173–182. [CrossRef]
12. IARC. Working Group on the Evaluation of Carcinogenic Risks to Humans, Lyon, France. Formaldehyde,
2-butoxyethanol and 1-tert-butoxypropan-2-ol. Iarc. Monogr. Eval. Carcinog. Risks Hum. 2006, 88, 1–478.
13. Zhou, Y.; Zhang, S.; Li, Z.; Zhu, J.; Bi, Y.; Bai, Y.; Wang, H. Maternal benzene exposure during pregnancy and
risk of childhood acute lymphoblastic leukemia: A meta-analysis of epidemiologic studies. PLoS ONE 2014,
9, e110466. [CrossRef] [PubMed]
14. Golhosseini, M.J.; Kakooei, H.; Shahtaheri, J.; Azam, K. Trend of exposure to carbon monoxide in Tehran taxi
drivers during one year. J. Sch. Public Health Inst. Public Health Res. 2015, 13, 57–68.
15. Naghizadeh, A.; Sharifzadeh, G.; Khavari, M. Measurement of CO concentrations in indoor and atmospheric
ambient air of Birjand (September 2012 to March 2013). J. Birjand Univ. Med. Sci. 2015, 22, 266–273.
16. Duan, Y.; Wu, X.; Liang, S.; Jin, F. Elevated blood ammonia level is a potential biological risk factor of
behavioral disorders in prisoners. Behav. Neurol. 2015, 2015, 797862. [CrossRef]
17. Hwang, S.H.; Park, W.M. Radon and PM10 concentrations in underground parking lots and subway stations
with health risks in South Korea. Environ. Sci. Res. 2018, 25, 35242–35248. [CrossRef]
18. Hwang, S.H.; Park, J.B.; Park, W.M. Radon and NO2 levels and related environmental factors in 100
underground subway platforms over two-year period. J. Environ. Radioact. 2018, 181, 102–108. [CrossRef]
19. Kwon, S.B.; Cho, Y.; Park, D.; Park, E.Y. Study on the indoor air quality of Seoul metropolitan subway during
the rush hour. Indoor Built Environ. 2008, 17, 361–369. [CrossRef]
20. Lee, K.B.; Kim, J.S.; Bae, S.J.; Kim, S.D. Research study on indoor air quality (iaq) inside of the subway cabin
in Seoul metropolitan city. J. Korean Soc. Atmos. Environ. 2014, 30, 175–187. [CrossRef]
21. Park, W.M.; Park, J.B.; Roh, J.; Hwang, S.H. Levels of formaldehyde and TVOCs and influential factors of 100
underground station environments from 2013 to 2015. Hum. Ecol. Risk Assess. Int. J. 2018, 24, 1030–1042.
[CrossRef]
22. Pan, S.; Du, S.; Wang, X.; Zhang, X.; Xia, L.; Liu, J.; Pei, F.; Wei, Y. Analysis and interpretation of the particulate
matter (PM10 and PM2.5 ) concentrations at the subway stations in Beijing, China. Sustain. Cities Soc. 2019, 45,
366–377. [CrossRef]
23. Guan, B.; Zhang, T.; Liu, X. Performance investigation of outdoor air supply and indoor environment related
to energy consumption in two subway stations. Sustain. Cities Soc. 2018, 41, 513–524. [CrossRef]
24. Van Drooge, B.L.; Prats, R.M.; Reche, C.; Minguillón, M.; Querol, X.; Grimalt, J.O.; Moreno, T. Origin of
polycyclic aromatic hydrocarbons and other organic pollutants in the air particles of subway stations in
Barcelona. Sci. Total Environ. 2018, 642, 148–154. [CrossRef] [PubMed]
25. Querol, X.; Moreno, T.; Karanasiou, A.; Reche, C.; Alastuey, A.; Viana, M.; Font, O.; Gil, J.; de Miguel, E.;
Capdevila, M. Variability of levels and composition of PM10 and PM2.5 in the Barcelona metro system.
Atmos. Chem. Phys. 2012, 12, 5055–5076. [CrossRef]
26. Martins, V.; Moreno, T.; Minguilln, M.C.; Amato, F.; de Miguel, E.; Capdevila, M.; Querol, X. Exposure to
airborne particulate matter in the subway system. Sci. Total Environ. 2015, 511, 711–722. [CrossRef]
27. Moreno, T.; Perez, N.; Reche, C.; Martins, V.; de Miguel, E.; Capdevila, M.; Centelles, S.; Minguillon, M.C.;
Amato, F.; Alastuey, A.; et al. Subway platform air quality: Assessing the influences of tunnel ventilation,
train piston effect and station design. Atmos. Environ. 2014, 92, 461–468. [CrossRef]
28. Mammi-Galani, E.; Eleftheriadis, K.; Mendes, L.; Lazaridis, M. Exposure and dose to particulate matter
inside the subway system of Athens, Greece. Air Qual. Atmos. Health. 2017, 10, 1015–1028. [CrossRef]
29. Assimakopoulos, M.N.; Dounis, A.; Spanou, A.; Santamouris, M. Indoor air quality in a metropolitan area
metro using fuzzy logic assessment system. Sci. Total Environ. 2013, 449, 461–469. [CrossRef]
30. Grass, D.S.; Ross, J.M.; Family, F.; Barbour, J.; James, S.H.; Coulibaly, D.; Hernandez, J.; Chen, Y.; Slavkovich, V.;
Li, Y.; et al. Airborne particulate metals in the New York city subway: A pilot study to assess the potential
for health impacts. Environ. Res. 2010, 110, 1–11. [CrossRef]
31. Kam, W.; Cheung, K.; Daher, N.; Sioutas, C. Particulate matter (PM) concentrations in underground and
ground-level rail systems of the Los Angeles Metro. Atmos. Environ. 2011, 45, 1506–1516. [CrossRef]Int. J. Environ. Res. Public Health 2020, 17, 5213 14 of 15
32. Wang, J.J.; Zhao, L.J.; Zhu, D.L.; Gao, H.O.; Xie, Y.J.; Li, H.Y.; Xu, X.; Wang, H.B. Characteristics of particulate
matter (PM) concentrations influenced by piston wind and train door opening in the Shanghai subway
system. Transp. Res. Part D Transp. Environ. 2016, 47, 77–88. [CrossRef]
33. Tokarek, S.; Bernis, A. An example of particle concentration reduction in Parisian subway stations by
electrostatic precipitation. Environ. Technol. 2006, 27, 1279–1287. [CrossRef] [PubMed]
34. Colombi, C.; Angius, S.; Gianelle, V.; Lazzarini, M. Particulate matter concentrations, physical characteristics
and elemental composition in the Milan underground transport system. Atmos. Environ. 2013, 70, 166–178.
[CrossRef]
35. Tan, S.H.; Roth, M.; Velasco, E. Particle exposure and inhaled dose during commuting in Singapore. Atmos.
Environ. 2017, 170, 245–258. [CrossRef]
36. Smith, J.D.; Barratt, B.M.; Fuller, G.W.; Kelly, F.J.; Loxham, M.; Nicolosi, E.; Priest man, M.; Temper, A.H.;
Green, D.C. PM2.5 on the London underground. Environ. Int. 2020, 134, 105118. [CrossRef] [PubMed]
37. Guan, B.; Liu, X.; Zhang, T.; Xia, J. Energy consumption of subway stations in China: Data and influencing
factors. Sustain. Cities Soc. 2018, 43, 451–461. [CrossRef]
38. Cao, R.-G.; You, S.-J.; Dong, S.-Y. Energy consumption analysis and reconstruction of subway platform screen
doors in northern cities for energy-saving. J. Chongqing Univ. 2009, 32, 218–222.
39. Roh, J.S.; Ryou, H.S.; Park, W.H.; Jang, Y.J. CFD simulation and assessment of life safety in a subway train
fire. Tunn. Undergr. Space Technol. Inc. Trenchless Technol. Res. 2008, 24, 447–453. [CrossRef]
40. Roh, J.S.; Ryou, H.S.; Yoon, S.W. The effect of PSD on life safety in subway station fire. J. Mech. Sci. Technol.
2010, 24, 937–942. [CrossRef]
41. Kim, K.; Ho, D.X.; Jeon, J.; Kim, J. A noticeable shift in particulate matter levels after platform screen door
installation in a Korean subway station. Atmos. Environ. 2012, 49, 219–223. [CrossRef]
42. Han, H.; Lee, J.Y.; Jang, K.J. Effect of platform screen doors on the indoor air environment of an underground
subway station. Indoor Built Environ. 2015, 24, 672–681. [CrossRef]
43. Kim, M.J.; Kim, Y.S.; Ataei, A.; Kim, J.T.; Lim, J.J. Statistical evaluation of indoor air quality changes after
installation of the PSD system in Seoul’s subway. Indoor Built Environ. 2011, 20, 361–369.
44. Son, Y.S.; Salama, A.; Jeong, H.S.; Kim, S.; Jeong, J.H.; Lee, J.; Sunwoo, Y.; Kim, J.-C. The effect of platform
screen doors on PM10 levels in a subway station and a trial to reduce PM10 in tunnels. Asian J. Atmos.
Environ. 2013, 7, 38–47. [CrossRef]
45. Lee, T.J.; Jeon, J.S.; Kim, S.D.; Kim, D.S. A comparative study on PM10 source contributions in a Seoul
subwaypolitan subway station before/after installing platform screen doors. J. Korean Soc. Atmos. Environ.
2010, 26, 543–553. [CrossRef]
46. Hazarika, J. SPSS as a means for scientific analysis in social science research. Int. J. Innov. Technol. Explor.
Eng. 2019, 8, 2043–2045.
47. Xin, L.; Jianping, S.; Xiwe, W.; Zhongqi, W. Study on the index mode of indoor air quality evaluation. Environ.
Prot. Sci. 2007, 06, 6–7.
48. State Bureau of Technical Supervision. Hygienic Standard for Waiting Room of Public Transit Means,
GB9672-1996. Available online: http://g.wanfangdata.com.cn/details/detail.do?_type=standards&id=
GB9672-1996 (accessed on 17 July 2020).
49. Railway Passenger Train Hygiene and Testing Technique Provision, TB/T 1932-2014. Available online:
http://g.wanfangdata.com.cn/details/detail.do?_type=standards&id=TB/T1932-2014 (accessed on 17 July
2020).
50. Ministry of health; State Environmental Protection Administration. Indoor Air Quality Standard,
GBT18883-2002. Available online: http://g.wanfangdata.com.cn/details/detail.do?_type=standards&id=GB/
T18883-2002 (accessed on 17 July 2020).
51. Ambient Air Quality Standards, GB3095-2012. Available online: http://g.wanfangdata.com.cn/details/detail.
do?_type=standards&id=GB3095-2012 (accessed on 17 July 2020).
52. Salthammer, T. Formaldehyde sources, formaldehyde concentrations and air exchange rates in European
housings. Build. Environ. 2019, 150, 219–232. [CrossRef]
53. Liu, L.; Yu, X.; Dong, X.; Wang, Q.; Wang, Y.; Huang, J. The Research on Formaldehyde Concentration
Distribution in New Decorated Residential Buildings. In Proceedings of the 10th International Symposium
on Heating, Ventilation and Air Conditioning, Jinan, China, 19–22 October 2017; pp. 1535–1541.Int. J. Environ. Res. Public Health 2020, 17, 5213 15 of 15
54. Mo, W.; Zhang, X.; Wang, P.; Gu, A. Evaluation of pollution level of volatile organic compounds in subway
station by VEF value. Environ. Occup. Med. 2004, 4, 284–287.
55. Heydarizadeh, A.; Kahforoushan, D. Estimation of real-world traffic emissions for CO, SO2 , and NO2
through measurements in urban tunnels in Tehran, Iran. Environ. Sci. Pollut. Res. Int. 2019, 26, 26577–26592.
[CrossRef]
56. Deepak, S.; Jaya, D. Seasonal variations in mass concentrations of PM10 and PM2.5 at traffic intersection and
residential sites in Raipur city. Res. J. Chem. Environ. 2018, 22, 25–31.
57. Kalaiarasan, G.; Balakrishnan, R.M.; Sethunath, N.A.; Manoharan, S. Source apportionment studies on
particulate matter (PM10 and PM2.5 ) in ambient air of urban Mangalore, India. J. Environ. Manag. 2018, 217,
815–824. [CrossRef]
58. Park, D.; Ha, K. Characteristics of PM10 , PM2.5 , CO2 and CO monitored in interiors and platforms of subway
train in Seoul, Korea. Environ. Int. 2008, 34, 629–634. [CrossRef]
59. Han, X.; Chen, Y.; Deng, H.; Shi, J.; Lu, X.; Du, G. Detection and analysis of ambient air quality of Kunming
Metro. J. Yunnan Univ. 2017, 39, 1023–1029.
60. Chen, Y.; Sung, F.; Chen, M.; Mao, I.; Lu, C. Indoor air quality in the metro system in north Taiwan. Int. J.
Environ. Res. Public Health 2016, 13, 1200. [CrossRef] [PubMed]
61. Sili, J. Investigation and analysis of SO2 and NO2 at stations before and after operation of the first section of
Guangzhou metro line 2. J. Guangdong Pharm. Univ. 2004, 20, 165–166.
62. Mao, P.; Li, J.; Xiong, L.; Wang, R.; Wang, X.; Tan, Y.; Li, H. Characterization of urban subway microenvironment
exposure—A case of Nanjing in China. Int. J. Environ. Res. Public Health 2019, 16, 625. [CrossRef]
63. Hwang, S.H.; Park, W.M.; Park, J.B.; Nam, T. Characteristics of PM10 , and CO2 , concentrations on 100
underground subway station platforms in 2014 and 2015. Atmos. Environ. 2007, 167, 143–149. [CrossRef]
64. Son, Y.-S.; Jeon, J.-S.; Lee, H.J.; Ryu, I.-C.; Kim, J.-C. Installation of platform screen doors and their impact on
indoor air quality: Seoul subway trains. J. Air Waste Manag. Ass. 2014, 64, 1054–1061. [CrossRef]
65. Ielpo, P.; Mangia, C.; Marra, G.P.; Comite, V.; Rizza, U.; Uricchio, V.F.; Fermo, P. Outdoor spatial distribution
and indoor levels of NO2 and SO2 in a high environmental risk site of the south Italy. Sci. Total Environ.
2019, 648, 787–797. [CrossRef]
66. Sanger-Katz, M.; Schwartz, J. Assessing the possible health effects from volkswagen’s diesel deception. N. Y.
Times 2015, 165, B1–B2.
© 2020 by the authors. Licensee MDPI, Basel, Switzerland. This article is an open access
article distributed under the terms and conditions of the Creative Commons Attribution
(CC BY) license (http://creativecommons.org/licenses/by/4.0/).You can also read