Concepts and Rationale for Regional Nitrogen Rate Guidelines for Corn
←
→
Page content transcription
If your browser does not render page correctly, please read the page content below
Concepts and Rationale for Regional
Nitrogen Rate Guidelines for Corn

                    Authors
                    John Sawyer, Iowa State University
                    Emerson Nafziger, University of Illinois
                    Gyles Randall, University of Minnesota
                    Larry Bundy, University of Wisconsin–Madison
                    George Rehm, University of Minnesota
                    Brad Joern, Purdue University

                    Contributors
                    Carrie Laboski, University of Wisconsin–Madison
                    Robert Hoeft, University of Illinois
                    Robert Mullen, The Ohio State University
                    Randy Killorn, Iowa State University
                    Sylvie Brouder, Purdue University

                                                               PM 2015 April 2006
Concepts and Rationale for Regional Nitrogen Rate
Guidelines for Corn

Contents
List of Tables .............................................................................................................................................. 3

List of Figures............................................................................................................................................. 4

Introduction ............................................................................................................................................... 5

Nitrogen and Corn Use .......................................................................................................................... 6–8
Brad Joern, Purdue University
John Sawyer, Iowa State University

Why Evaluate Corn Nitrogen Recommendation Systems? .................................................................. 9–11
Larry Bundy, University of Wisconsin–Madison

Factors That Affect Suggested Fertilizer Nitrogen Rates ......................................................................... 12
George Rehm, University of Minnesota

Risks Associated with Nitrogen Rate Decisions ................................................................................ 13–14
Gyles Randall, University of Minnesota
Regional Approach to Corn Nitrogen Rate Guidelines ...................................................................... 15–24
John Sawyer, Iowa State University
Emerson Nafziger, University of Illinois

Summary .................................................................................................................................................. 25

References ................................................................................................................................................ 26

Questions? ................................................................................................................................................ 27

2                                                              Concepts and Rationale for Regional Nitrogen Rate Guidelines for Corn
List of Tables
Table 1. Corn grain yield at the zero N rate as a fraction of yield at the EONR (0.10 price ratio)......................7

Table 2. Five-year average corn yield with CC, economic return to fertilizer N,
and nitrate-N concentration in soil water at 7.5 ft in November at the end
of the study on a silt loam soil in southeastern Minnesota .................................................................................14

Table 3. Three-year average corn yield, economic return to fertilizer N, and nitrate-N concentration
in subsurface tile drainage water for a SC rotation in Minnesota........................................................................14

Table 4. For SC, the MRTN and profitable N rate range within $1.00/acre of the maximum return
for several N:corn grain price ratios (nonresponsive sites not included) ...........................................................19

Table 5. For CC, the MRTN and profitable N rate range within $1.00/acre of the maximum return
for several N:corn grain price ratios (nonresponsive sites not included) ...........................................................20

Table 6. Example N rate fertilization guidelines for SC and CC in Iowa based
on N:corn grain price ratios and economic return calculated by the MRTN approach ......................................21

Contents                                                                                                                                    3
List of Figures
Figure 1. Corn aboveground dry matter accumulation and N uptake for a 204 bu/acre corn crop ....................6

Figure 2. Corn aboveground N uptake and partitioning between plant components .........................................7

Figure 3. Aboveground plant N uptake from soil and applied fertilizer N (100 lb N/acre)
at three corn growth stages in a SC rotation on a silt loam soil in south-central Illinois .....................................8

Figure 4. Example of the relationship between corn grain yield and EONR found
in states across the Corn Belt................................................................................................................................10

Figure 5. Types of responses found in N rate trials, with site examples showing corn yield increase
with N application (EONR indicated at 0.10 price ratio)....................................................................................10

Figure 6. Frequency distribution of EONR (0.10 price ratio) for SC sites in Iowa............................................17

Figure 7. Variation in EONR (0.10 price ratio) and corn yield in different years for SC and CC
at the same site location, Ames, Iowa ..................................................................................................................17

Figure 8. Corn grain yield and fertilizer economic components of calculated net return across N rates,
example SC site with MRTN indicated at 0.10 price ratio (N price $0.22/lb N and corn price $2.20/bu) ........18

Figure 9. Regional N rate database map indicating the geographic distribution of N response trial sites ........18

Figure 10. For SC, net return to N and effect of fertilizer N:corn grain price ratio ...........................................21

Figure 11. For CC, net return to N and effect of fertilizer N:corn grain price ratio ..........................................22

Figure 12. For SC, the percent of maximum yield across N rates ......................................................................23

Figure 13. For CC, the percent of maximum yield across N rates .....................................................................24

4                                                              Concepts and Rationale for Regional Nitrogen Rate Guidelines for Corn
Introduction                                                               Definitions
Nitrogen (N) is typically one of the   levels. An outcome of those         CC—Corn following corn.
largest corn fertilization expenses.   discussions was an effort with      EONR—Economic optimum
Nitrogen application is critical       the objectives to:                  N rate; the point where the last
because it significantly improves                                           increment of N returns a grain
corn yield in many crop rotations.     ▪ develop N rate guidelines that    yield increase large enough to
When choosing N rates, producers       could be applicable on a regional   pay for that N.
need to carefully consider both        basis and                           MRTN—Maximum return to
achieving most profitable                                                   N; N rate where the economic
economic return and advancing          ▪ identify the most profitable       net return to N application
environmental stewardship.             fertilizer N rates for corn         is greatest.
                                       production across the Corn Belt.    Maximum Yield—The yield
In 2004, university agronomists
                                                                           where application of more N
from the Corn Belt states began        This publication provides an        does not result in yield increase.
discussions regarding N rate use       overview of corn N fertilization
                                                                           Net Return—The value of corn
for corn production. The reasons       in regard to rate of application,
                                                                           grain produced minus the N
for the discussions centered on        investigates concepts for
                                                                           fertilization cost.
apparent differences in methods        determining economic application
for determining N rates across         rates, and describes a suggested    N Factor—The lb N per bu of
states, misperceptions regarding                                           corn; derived by dividing the
                                       regional approach for developing
N rate guidelines, and concerns                                            optimum N rate by grain yield.
                                       corn N rate guidelines directly
about application rates as corn        from recent research data.          Price Ratio—The ratio of N
yields have climbed to historic                                            fertilizer price to corn grain
                                                                           price ($/lb:$/bu).
                                                                           SC—Corn following soybean.
                                                                           Site—The land area occupied
                                                                           by an N rate trial; either
                                                                           replicated small plots in a
                                                                           specific field area or replicated
                                                                           field-length strips.
                                                                           Site N Responsiveness—The
                                                                           corn grain yield increase with
                                                                           N application; nonresponsive
                                                                           indicates no yield increase
                                                                           with N application while high
                                                                           response indicates large yield
                                                                           increase from N application.
                                                                           Yield Return—The value of
                                                                           corn grain produced due to
                                                                           N application.

Introduction                                                                                                    5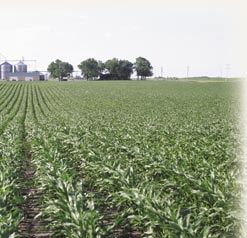
Nitrogen and Corn Use
Brad Joern, Purdue University, and John Sawyer, Iowa State University

Corn is truly an amazing plant. Only 15 to 20 lb                                            25000                                                                                 Kernel
                                                                                                          Aboveground Dry Matter               Late silk                        black layer   300
                                                                                                                                                                        Dent
dry matter/acre is planted in the spring as seed,                                                         N Uptake
                                                                                                                                           Tassel          Blister

                                                          Aboveground Dry Matter, lb/acre
and in only four months, these seeds build an                                               20000                                                                                             250

                                                                                                                                                                                                    Total N Uptake, lb N/acre
                                                                                                                          Shoulder high
energy-capturing factory that produces nearly                                                                                                                                                 200
                                                                                            15000
20,000 pounds of dry matter/acre and generates                                                                                                                  Grain portion = 9650 lb
                                                                                                                Nine-leaf stage
                                                                                                                                                                 46% of total weight          150
500 to 1,000 new seeds for each seed that was                                               10000

planted. While approximately 95 percent of this                                                         Four-leaf stage
                                                                                                                                                                                              100

dry weight is in the form of carbon, hydrogen, and                                           5000
                                                                                                                                                                                              50

oxygen that come from air and water, 14 other
                                                                                                0                                                                                            0
essential mineral elements are needed in adequate                                                   0         20          40          60            80           100           120        140
                                                                                                                                  Days after planting
supply to keep the corn factory up and running
                                                          Figure 1. Corn aboveground dry matter accumulation and
throughout the life cycle of the plant. Among these       N uptake for a 204 bu/acre corn crop (Mengel, 1995).
14 mineral elements, N is generally the most limiting
nutrient for corn production in the Corn Belt. This       While the growth and development of the
section describes how N accumulates during the            aboveground portion of a corn plant is easily
growth and development of the corn plant and              observed, it is the fibrous root system that transports
examines sources of N available for corn uptake.          from soil the water and the vast majority of mineral
                                                          nutrients needed to complete the plant life cycle.
                                                          The total length of the corn root system can reach
                                                          30,000–40,000 miles/acre. From planting through
                                                          the blister kernel stage, root growth roughly parallels
                                                          the growth of the aboveground portion. From that
                                                          point on, roots begin to die off as the plant redirects
                                                          nutrients and carbohydrates to developing kernels.

                                                          Corn accumulates only about 1 lb N/acre by the
                                                          four-leaf growth stage. During the next six weeks of
                                                          growth prior to tasseling, N accumulation approaches
Corn Growth, Development,
                                                          60 to 70 percent of total N uptake (approximately
and Nitrogen Accumulation
                                                          200 lb N/acre for a high-yielding corn crop). Nitrogen
From emergence, it takes until about the four-
                                                          accumulation slows dramatically between silking and
leaf stage of growth for a corn plant to double its
                                                          kernel blister and then increases again until the dent
dry weight. During the next five to six weeks of
                                                          stage, as nutrients and carbohydrates are translocated
growth prior to tasseling, 9,000 to 10,000 lb/acre
                                                          from other parts of the plant to developing kernels
of aboveground dry matter can be generated by
                                                          during the final stages of grain fill. A maximum
a high-yielding corn crop. Between tasseling and
                                                          accumulation of approximately 275 lb N/acre is
physiological maturity, aboveground dry weight will
                                                          reached by physiological maturity for high-yielding
double again (to a total of about 20,000 lb/acre), with
                                                          corn. About half or more of this N will be in grain
roughly half of this aboveground weight in harvested
                                                          (Figures 1 and 2).
grain (Figure 1).

6                                            Concepts and Rationale for Regional Nitrogen Rate Guidelines for Corn
160
Although precipitation may supply 5 to 20 lb N/acre
140
Grain annually and small amounts of N can be released
Reproductive
120 Stalk from clay minerals, crop residues and soil organic
Total N Uptake, lb/acre
Leaf
100 matter are the major contributors of nonfertilizer
80 N (Figure 3). Recently applied organic materials,
60 including previous crop residues, make up the pool
40 of organic N most available to microorganisms.
20 Microbial conversion of this organic N to plant-
0 available N, a process called N mineralization,
15- 29- 12- 26- 10- 24- 7- 21- 4- 18- 2-
May May Jun Jun Jul Jul Aug Aug Sep Sep Oct can supply substantial amounts of N to a growing
Date
corn crop. In high-yielding corn, approximately
Figure 2. Corn aboveground N uptake and partitioning between
plant components. (Data from Jim Schepers, USDA-ARS,
125 lb N/acre may remain in the 10,000 lb plant
Lincoln, Nebraska [personal communication]). residue (including roots) that is not removed during
harvest. This material has a high carbon to N ratio,
Nonfertilizer Sources of Nitrogen and until the carbon is processed by microorganisms,
If no N fertilizer or manure is applied to corn, yields N in plant residue will not be released in mineral
will be low unless the soil already contains a high forms (ammonium and nitrate) that plants can
level of plant-available N. Without fertilizer N, corn use. The length of time required for crop residue N
yields in productive soils average about 55 percent to become available to corn depends on how fast
of optimum yield in continuous corn (CC) and microorganisms can break the residue down. Warm,
about 70 percent of optimum yield in a soybean-corn moist, aerated, near-neutral pH soil conditions favor
(SC) rotation (Table 1). If no fertilizer or manure breakdown. When the previous crop is soybean, less
is applied for several years and plant-available N crop residue remains after harvest, and because it has
becomes depleted, corn yield will average only 50 to a lower carbon to N ratio, it is more easily degraded
60 bu/acre in CC and 100 to 110 bu/acre in SC. So by microorganisms than corn residue. These are
where does N that the plant takes up come from if we major reasons why Corn Belt states have lower
are not providing any fertilizer? corn N rate recommendations when soybean is the
previous crop. Soil organic matter is more difficult
Table 1. Corn grain yield at the zero N rate as a fraction of for microorganisms to degrade than crop residue,
yield at the EONR (0.10 price ratio). with approximately 2 to 4 percent of soil organic
State CC SC matter broken down by microorganisms each year
compared to 50 percent or more for recently added
----------------% ------------
Illinois 54 64 organic materials.
Iowa 45 75
Minnesota 60 76
Wisconsin 71 77
Mean* 56 70
*Total of 271 CC and 427 SC sites
Nitrogen and Corn Use 7100
N per acre is required to supply the additional
Soil 110 lb supplemental N/acre needed by the crop.
80 Fertilizer This example represents what may happen under
N Uptake, lb N/acre
good growing conditions on some soils.
60
40 If there are adverse conditions that negatively affect
organic matter breakdown, then soil N supply
20
is likely to be reduced. If organic matter
0 mineralization in the above example is reduced by
V8 VT Harvest
just 25 percent, 30 lb/acre less N will be available
Growth Stage
from the soil and an additional 50 lb of N (230 lb
Figure 3. Aboveground plant N uptake from soil and applied
fertilizer N (100 lb N/acre) at three corn growth stages in a SC total) would need to be supplied as fertilizer. Excess
rotation on a silt loam soil in south-central Illinois. Fertilizer moisture also can increase soil nitrate losses, which
depleted in 15N was applied in order to track N in the plant
derived from the soil or fertilizer. will further increase fertilizer N needs. Under more
ideal conditions, increased organic matter breakdown
Role of Organic Matter can increase soil N supply. If organic matter
mineralization in the example is increased by
and Crop Residues
25 percent, then more N becomes plant available
The important role of organic matter breakdown
(200 lb N/acre including precipitation) and less
to plant N availability can be illustrated with an
fertilizer N will need to be applied (125 lb N/acre)
example. Assume that a soil has 3.5 percent organic
to grow the 200 bu/acre corn crop.
matter (3,500 lb N/acre) and that 100 lb N/acre
is left in the field as crop residue. If 50 percent of
Organic matter mineralization varies across the
the crop residue N is released as crop-available N
Corn Belt. Moreover, within each state, there are
(50 lb N/acre), 3 percent of the soil organic matter
differences among soils and within soils across
N is released (105 lb N/acre), and 10 lb N/acre
years; the differences may vary due to current and
is deposited via precipitation, then a total of
previous crop and nutrient management practices
165 lb N/acre may be available to the crop from
and local environmental conditions during a growing
sources other than fertilizer. If grain yield is
season. This makes prediction of soil N contributions
about 200 bu/acre, with total crop N uptake of
difficult. For these reasons, organic matter content of
275 lb N/acre, then the crop will need 110 lb N/acre
mineral soils is often not incorporated into fertilizer
of supplemental N to obtain that yield. However,
N recommendation systems. Rather, soil organic N
only about 55 to 65 percent of applied fertilizer N
contributions are accounted for through such factors
is taken up by a corn crop. Approximately 20 to
as crop rotation and soil N testing. The uncertainty of
25 percent of applied fertilizer N will be incorporated
N availability from nonfertilizer N, coupled with the
into soil organic matter, with the other 15 to
high cost of N fertilizers and the need for increased
20 percent lost via denitrification, nitrate leaching,
environmental stewardship, necessitates evaluation
ammonia volatilization, or uptake by weeds. If
of N fertilizer recommendation strategies.
60 percent of applied N is taken up by the crop,
then an application of about 180 lb fertilizer
8 Concepts and Rationale for Regional Nitrogen Rate Guidelines for CornWhy Evaluate Corn Nitrogen Recommendation Systems?
Larry Bundy, University of Wisconsin–Madison
soil productivity and the geographic location of the
soil. In Wisconsin, recommendations were based on
relative soil yield potential determined from soil
type information and producer management level
(Walsh and Schulte, 1970). These recommendations
were also adjusted for manure and previous crop
N contributions.
Currently, yield-based N recommendations are used
in most Corn Belt states. The widespread interest in
and adoption of yield goal-based N recommendations
in much of the United States was stimulated by
Nitrogen recommendations provided by land Stanford’s classic paper (Stanford, 1973). That work
grant universities and extension services are described a mass balance approach for assessing
receiving increasing scrutiny due to continuing corn N fertilizer needs by considering N uptake at a
concerns about the effects of agricultural N specific dry matter yield level and N contributions
use on water quality. Specifically, N losses from from nonfertilizer sources. Stanford’s approach was
agricultural systems have been identified as likely probably intended to provide an assessment of total
contributors to elevated groundwater nitrate crop N requirement rather than a process for making
concentrations and to Gulf of Mexico hypoxia. In N recommendations. However, it identified corn
addition, university N recommendations are being N requirements on a per-unit-of-yield basis,
widely used as the technical criteria for nutrient and it was widely adopted for making yield-based
management regulatory policy. These policies often N recommendations. The typical yield-based
view university recommendations as a vehicle for approach is to multiply a yield goal value by a
achieving environmental objectives, while the basis lb N/bu factor (often 1.2 lb N/bu) to obtain a fertilizer
for developing the recommendations is usually N recommendation that can be adjusted for N
economic. These issues, along with the need to contributions from other sources, such as manure,
provide producers with reasonable economic previous legume crops, soil nitrate, and soil organic
returns from N use in crop production, emphasize N mineralization.
the importance for reliable, science-based N
recommendations. This section will explore several Recently, the yield-based approach to N
concepts regarding N recommendation systems. recommendations has been questioned for the
following reasons:
Historically, corn N recommendations were
based on soil-specific criteria and/or on crop ▪ poor relationship between recommendations and
management variables such as rotation and manure the economic optimum N rate (EONR) observed in
application. For example, N recommendations N rate response trials (Figure 4),
for CC in Iowa (Voss, 1969) varied depending on
Why Evaluate Corn Nitrogen Recommendation Systems? 9▪ uncertainty about how yield goals should be Iowa - SC Sites
300
determined,
Yield at EONR, bu/acre
▪ the assumption that N use efficiency is constant 200
across sites and years, and
100
▪ use of inadequate or inappropriate adjustments for
nonfertilizer N sources.
0
While there should not necessarily be an expectation 0 50 100 150 200 250
EONR, lb N/acre
for a yield-based rate recommendation to precisely
Figure 4. Example of the relationship between corn grain yield
match each site EONR, lack of such a relationship and EONR found in states across the Corn Belt. The graph is
does raise questions about the approach. Poor for SC sites in Iowa (0.10 price ratio). Points on the left axis
represent sites where there was no response to N fertilizer rate.
performance of yield-based recommendations
becomes particularly apparent when observed crop
N fertilization needs at current high corn yield 250
levels are substantially less than the yield-based N
recommendations (Figure 4). That is, high corn 200
Corn Yield, bu/acre
yields are not indicative of high N fertilization need.
150
The lack of relationship between EONR and yield Clay 03
Boone-SN 02
100
occurs for both CC and SC, and is found in states Harrison 03
Johnson 03
across the Corn Belt. While plant N requirement EONR
50
does increase with greater plant biomass production 0 50 100 150 200
(and higher grain yield), variation in soil N supply N Rate, lb N/acre
disrupts the direct relationship between yield and Figure 5. Types of responses found in N rate trials, with site
examples showing corn yield increase with N application
fertilization need. The soil N supply (as measured (EONR indicated at 0.10 price ratio).
by the fraction of yield when no N is applied)
varies among sites and can be quite large (Table 1).
Alternatives to yield-based N recommendations are
These variations have an important influence on
in use in several states, and additional alternatives
the magnitude of yield increase from N application
are explored in this publication. Nitrogen
(N response), shape of the response curve, and
recommendations in Iowa are based on cropping
EONR (Figure 5). Another issue with the yield-based
system and results of a soil nitrate test (Blackmer
approach is use of a lb N/bu factor derived from
et al., 1997). In Wisconsin, N recommendations
CC for calculating N fertilization rates for SC.
were revised in 1990 using a soil-specific approach
Instead of using an N factor derived from CC, a
based on the results of numerous N response
direct determination of optimal N rate should be
trials conducted on the major soils used for corn
made for corn in each rotation. This approach
production. These recommendations recognize that
eliminates the need to estimate N factors and
corn yields can vary substantially from year to year
rotation credits and removes the confounding of
on a given soil, and are consistent with results of N
yields with different rotations.
rate response trials that showed that EONR does vary,
10 Concepts and Rationale for Regional Nitrogen Rate Guidelines for Cornbut not with the yield attained. Both the rationale and investigation of this question using long-term data
approach used in developing the recommendations from two Iowa cropping systems studies allowed
are described by Vanotti and Bundy (1994a; 1994b). comparison of optimum N rates observed in a recent
10- to 12-year period with those from the preceding
Obviously, average corn yields and yield potential of 10 to 12 years. These data showed that optimum N
today’s corn hybrids are greater than those seen in rates increased over time at one site and decreased
previous decades. It is not clear, however, that these at the other site. Again, the results provide no clear
higher yields translate into higher rates of N needed indication of a change in N rates over time. Potential
to optimize yields. Corn yield response data were reasons for similar or decreasing optimum N rates
examined from about 20 site-years in Wisconsin that where yields have increased substantially include
were separated by 10 to 12 years in time. The results more efficient utilization of available N by the crop
showed no clear indication that current optimum N and increased soil N supplying capability.
rates are higher than those of 10 years ago. Further
Why Evaluate Corn Nitrogen Recommendation Systems? 11Factors That Affect Suggested Fertilizer Nitrogen Rates
George Rehm, University of Minnesota
It would be highly desirable to have one N fertilizer
rate to fit all production situations throughout the
Corn Belt; however, the ability to change suggested
rates to fit various production environments is
well justified. Timing of application, climate,
crop rotation, tillage system, and soil productivity
are among major factors that can change rate
suggestions. This section will explore factors that
may affect N rates.
While N is mobile in soils and can be lost, there
still can be flexibility in management practices till, and reduced-tillage management can delay
for fertilizer N. With appropriate consideration or reduce residue breakdown, or mineralization,
for soil texture and potential for losses, N can be thereby reducing the N supplied from crop residue.
applied either before planting, sidedress, or as a split A reduction in N supply from the soil system
preplant-sidedress treatment. Nitrogen is used more translates to the need for a higher rate of fertilizer
efficiently if applied during the growing season prior N. In general, different N rate suggestions may be
to the time of maximum uptake rate, as compared expected when no-till or limited tillage planting
to application before the crop is planted. There have systems are used.
been numerous studies to evaluate the effect of
application timing on grain yield and N uptake. The Finally, the productive potential of soils across a
results frequently lead to the conclusion that the rate landscape is not uniform. Soils where productivity is
suggested for optimum yield should not be adjusted limited frequently require higher rates of fertilizer N
for time of application. This could change as future to reach optimum yield. These limits to productivity
N rate suggestions become more precise. could be due to differences in soil texture, drainage,
subsoil restrictions to root growth, or other factors.
The influence of legumes in rotation on N Conversely, lower rates of fertilizer N may be needed
fertilization requirements is widely recognized; to reach optimum yield on highly productive soils.
the reduction in N fertilization rate when corn The N that is not supplied by fertilizer mostly
follows annual legumes (soybean) is less than when originates from the mineralization of soil organic
following perennials (alfalfa, clovers). Although matter, which tends to be high in productive soils.
rotation differences can also vary depending on The environmental conditions that contribute to
local situations, it is important that legume effects high yields also help release N from soil organic
be considered. matter. There might be other specific factors that can
affect rate suggestions for fertilizer N use on corn in
Because soil temperature has a substantial effect on particular locations. These factors should be included
N transformations in soils, the influence of tillage in N rate guidelines when indicated by results from N
system is important as well. Reduced early-season response trials.
soil temperatures frequently observed in no-till, strip-
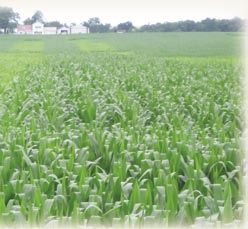
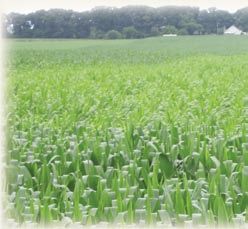
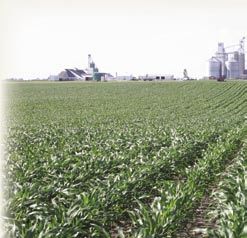
12 Concepts and Rationale for Regional Nitrogen Rate Guidelines for CornRisks Associated with Nitrogen Rate Decisions Gyles Randall, University of Minnesota Applying the proper rate of N for a crop is a major management decision corn producers make. Using too little N for a highly responsive crop such as corn results in lower yields, poorer grain quality, and reduced profits. When too much N is applied, corn yield and quality are generally not decreased, but profit is reduced and negative environmental consequences are likely to occur. This section will assess the risks associated with over- or underapplying N. Besides economic and environmental consequences described above, other psychological and social factors including perceptions by landlords and neighbors, tradition, and comfort level of the producer and fertilizer supplier also may play a role in determining the rate of N used by an individual producer. The green coloration, light or dark, of a corn field throughout the growing season may affect neighbors’ and landlords’ perception of a corn producer’s production ability. Thus, dark green corn is usually associated with excellent management and serves as a visual illustration of success and pride for the Tradition is another factor affecting a producer’s producer. Corn that shows light green to yellow N rate decision. If a producer has been applying colors early in the season may suggest improper a specific N rate for the last several years and has N timing or placement. However, corn that begins become satisfied with this rate, it is likely they will to show a general light green color or N deficiency continue applying that same rate unless results from symptoms on the lower leaves late in the growing comparison trials on their farm suggest adjusting season suggests to most observers that an inadequate the N rate, or they are convinced by other research rate of N was used. In these cases, grain yields and that their N rate may be too high. That is, the profitability are assumed to have been limited. For producer has developed a high comfort level with landlords, less than uniformly dark green corn may his/her traditional N rate even though it may be too suggest considering a different renter for next year. high for maximum profit. In addition, the fertilizer Overapplying N to keep the plant dark green until supplier, who strives for season-long dark green corn maturity is the simplest way to prevent this risk. and is dedicated to protecting producers from yield However, research shows that some yellowing of corn loss, also has a greater comfort level with applying late in the season usually results in greatest economic traditional N rates. return and minimal nitrate carryover for potential loss to ground and surface water resources. Risks Associated with Nitrogen Rate Decisions 13
However, many studies have shown that the                          drainage (Table 3). Economic return to the fertilizer
amount of nitrate leached toward groundwater or                    was optimized at the 160-lb N rate ($74/acre)
subsurface drainage water increases as the rate of                 when applied in the fall, and at the 120-lb N rate
applied N increases. The research has also shown                   ($100/acre) when preplant applied in the spring.
that profitability decreases once the EONR has been                 Moreover, nitrate-N concentrations in the tile
exceeded. A five-year CC study conducted on a                       drainage were 28 percent greater for the 160 than for
silt loam soil in southeastern Minnesota provides a                the 120-lb N rate. These data suggest the importance
vivid example of how profitability and protecting                   of selecting both the proper N rate and time of N
the environment can be balanced by using the                       application when maximizing profitability and
proper N rate (Table 2). In this study, economic                   minimizing nitrate loss to the environment, thus
return to fertilizer N was greatest at the 150-lb N                reducing risk for both the producer and society.
rate. Exceeding this N rate by 75 pounds reduced
profitability by $27/acre and almost doubled the                      Table 2. Five-year average corn yield with CC, economic
nitrate-N concentration in water percolating through                 return to fertilizer N, and nitrate-N concentration in soil
the soil below the root zone at the end of five years.                water at 7.5 ft in November at the end of the study on a silt
The EONR at this site was determined to be                           loam soil in southeastern Minnesota.

140 lb N/acre. The nitrate-N concentration in the                                                                     Nitrate-N
leachate would likely have been about 15 mg/L                        Annual       Grain     Economic* Return        in Soil Water
                                                                     N Rate       Yield       to Fertilizer N          at 7.5 ft
with a 140 lb N/acre rate.
                                                                     lb/acre     bu/acre           $/acre                 mg/L

A three-year SC rotation study on a glacial till soil                    0          82              —                       2
in south-central Minnesota, clearly demonstrates                        75         141               95                     4
                                                                       150         168              130                    17
the influence of N rate as anhydrous ammonia on
                                                                       225         164              103                    32
corn yield, profitability, and nitrate loss to subsurface
                                                                     *Corn = $2.00/bu; N = $0.25/lb; application = $4.00/acre

 Table 3. Three-year average corn yield, economic return to fertilizer N, and nitrate-N concentration in subsurface tile
 drainage water for a SC rotation in Minnesota.
            Annual N Treatment                         Grain               Economic* Return               Nitrate-N Concentration
     Rate          Time        N-Serve                 Yield                 to Fertilizer N                    in Tile Water
 lb/acre                                              bu/acre                    $/acre                            mg/L
       0           —               —                    106                        —                              ND**
      80           Fall            Yes                  135                         26                             16
     120           Fall            Yes                  160                         66                             18
     160           Fall            Yes                  169                         74                             23
     120          Spring           No                   175                        100                             ND
  *Corn = $2.00/bu; fall N = $0.25/lb; spring N = $0.28/lb; N-serve = $8.00/A; application = $4.00/acre
 **ND = not determined

14                                                  Concepts and Rationale for Regional Nitrogen Rate Guidelines for Corn
Regional Approach to Corn Nitrogen Rate Guidelines
John Sawyer, Iowa State University, and Emerson Nafziger, University of Illinois
Measurement of grain yield response in N rate trials not necessarily to develop the same suggested N
has been the historical basis for determination of rates across states or regions. Since corn production
corn N fertilization requirements. Analysis and crosses state lines, regional guidelines could be more
economic interpretation of response trial data meaningful. However, similar guidelines will result
provide the foundation for guidance on profitable only if data from response trials are in sufficient
N application rates. This general approach continues agreement and indicate that similar approaches
today. Research trials provide information about past are appropriate.
and current responses, while guidelines developed
from such responses direct action into the future. Analysis of Data
The value of N rate trials is to provide the from Nitrogen Response Trials
information required for assisting rate decisions The overall goal of conducting N rate trials is to find
at some level of future response expectation. the point where the value from grain yield increase
One example is different N rate recommendations by adding more N just matches the cost of that
with various previous crops. For instance, corn N added N. This is the EONR. For a typical corn yield
fertilization need is smaller when corn follows forage response curve to different N rates, the curve rises
legumes or soybean than when corn follows corn. slower and slower as N rate increases until it reaches
Guidance for N rates has previously been developed a plateau with no more yield response to increasing
through research and scientific judgment within N. Typically, the EONR is less than the N rate at
state boundaries, with land grant universities or which yield levels off or reaches a maximum. How
extension services publishing suggestions for corn far less than the maximum depends on the cost of N
N fertilization. and the price of corn grain; the more expensive N is,
the more yield it takes to pay for the last pound of
This section will analyze recent N response trials N, and so the lower the EONR. When the corn price
from several states, with the goal of developing a increases, the EONR increases because the value of
regional approach to N rate guidelines. The goal is the corn pays for a higher rate of N.
Regional Approach to Corn Nitrogen Rate Guidelines 15Nitrogen responses vary widely across fields and 6. Calculations are straightforward and likely
years, and are affected by factors such as soil type economic outcomes at different N rates can be easily
and weather. How can a set of varying responses determined with different N and corn prices.
be turned into N rate recommendations? Several
methods can be used to evaluate N response data, These advantages help bridge the gap between
and many will provide similar results. The method research and practical N rate guidelines.
selected, along with the associated N rate guidance,
should be one that utilizes economic analysis, results Regional Guideline Approach
in reasonable N rates, provides high net return, and Having a common approach to corn N rate
is understandable by producers and crop advisers. guidelines across the Corn Belt has several benefits.
Additionally, the method should have straightforward Similarity across states will increase as differences
calculations, be easy to implement, and be capable in philosophy, data analysis technique, or method
of analysis across a database of N response trials. It of guideline presentation are eliminated. This will
is important to have a large number of sites so there reduce skepticism about guidelines. Government
is adequate representation across a range of possible programs that cross state boundaries may become
corn N responses. easier to implement. Nitrogen rate guidance can be
more uniform within geographically similar soil and
Of the various methods available for evaluating N climatic conditions. Nitrogen response data can be
response data, the maximum return to N (MRTN) shared and compared more easily when a common
approach outlined by Nafziger et al. (2004) is approach is used. Finally, as new N rate response data
attractive for the following reasons: are accumulated, they can easily be integrated into
databases and analyses, and thus more quickly and
1. Data can be utilized from a large number and uniformly influence rate guidelines.
variety of N response trials, and new trials can be
easily added to the analysis. It must be recognized that rate guidelines developed
from analysis of trials conducted across a wide
2. Specific responses of each site are considered in the geography will be general in nature. Those guidelines
determination of optimum N and net return rather reflect the research data and provide insight into
than average response. general fertilizer N needs. However, they cannot
predict site-specific N requirements, and they are
3. A representative number of nonresponsive sites unlikely to provide an accurate estimate of the
does not excessively influence optimum N rate and optimum N rate needed in each specific environment.
net return. It is well documented that optimum N rate varies
among sites and years within sites (Figure 5, 6, and
4. Site data can be grouped according to criteria that 7). Nevertheless, guidelines should provide an N rate
indicate differing N response. that reflects economic value and probability of achieving
expected economic return across a range of locations and
5. Risk assessment can be included. period of time. The MRTN approach provides both the
above-mentioned benefits and allows analysis across
a range of N response trials.
16 Concepts and Rationale for Regional Nitrogen Rate Guidelines for CornIowa - SC Sites Steps in Calculation of MRTN
30
Step 1. Yield data are collected at replicated N
rates from many N rate trials.
20
Step 2. The shape of the N response is observed
% of Sites
for each trial to find out if the response is flat
10 (no response), the yield at zero N, how fast yield
increased as N rate increased, and the point
at which yield leveled off where additional N
0
0-25 25-50 50-75 75- 100- 125- 150- 175- 200- 225- provided no further yield increase (Figure 5).
100 125 150 175 200 225 250
EONR, lb N/acre
Step 3. A computer program is used to fit a line to
Figure 6. Frequency distribution of EONR (0.10 price ratio) for SC
the yield points for each site to show the shape of
sites in Iowa.
the response as well as to provide a mathematical
equation of that line (“curve-fitting”).
SC
250
Step 4. The set of site response curves is
200 accumulated for corn in different rotations. This
Corn Yield, bu/acre
set of curves represents a population of N rate
150
responses, and with an appropriate number of
100 2000 sites, represents the potential responses that might
2001
2002 occur in fields in the future.
50 2003
2004
EONR
Step 5. For each site, several values are calculated
0
from the response curve equation at 1-lb N rate
0 50 100 150 200 250
N Rate, lb N/acre increments from zero to 240 lb N/acre: yield
increase (above the yield at zero N), gross dollar
CC
250
return at that yield increase (corn grain price times
yield), fertilizer cost (N price times rate), and net
200
return to N (gross return minus N cost) (Figure 8).
Corn Yield, bu/acre
150
Economic values are calculated from specified N
fertilizer and corn prices.
1999
100 2000
2001 Step 6. For each N rate, net return is averaged
2002
50 2003 across all sites in the dataset for each specific
2004
EONR rotation.
0
0 50 100 150 200 250
N Rate, lb N/acre
Step 7. The N rate with the largest average net
Figure 7. Variation in EONR (0.10 price ratio) and corn yield in
return to N is the MRTN rate (Figure 8). Nitrogen
different years for SC (top) and CC (bottom) at the same site rates with net return within $1.00/acre of the
location, Ames, Iowa.
MRTN provide a range of N rates with similar
profitability. Net return will vary depending upon
specific N and corn prices, but the MRTN rate
remains constant when the ratio of these prices
($/lb:$/bu) stays the same.
Regional Approach to Corn Nitrogen Rate Guidelines 17The MRTN approach uses economic return to N The MRTN was evaluated as a potential regional
application found in research trials as the basis approach to N rate guidelines. Nitrogen response data
for suggested N rate. The average of N responses were assembled from 698 trials conducted from 1983
accumulated from a population of N rate trial sites is to 2004 (with most after the mid-1990s) in Illinois,
used to estimate the point of MRTN. The net return Iowa, Michigan, Minnesota, Ohio, and Wisconsin
is the increase in yield times the grain price at a (Figure 9). All sites in the database were nonirrigated
particular N rate, minus the cost of that amount of and had either spring preplant or sidedress fertilizer
N fertilizer (Figure 8). The maximum return is the N application. Data were accumulated for CC and
N rate, where net return is greatest. Both corn price SC. There were 93 CC and 185 SC trial sites in
and N cost affect the return to N, and it is their ratio Illinois, 60 CC and 136 SC sites in Iowa, 73 CC and
that directly influences the net return and point of 55 SC sites in Minnesota, and 39 CC and 34 SC sites
maximum return. in Wisconsin. These sites represent a sampling or
population of corn N responses. The number of sites
Clay 01 Site
from Michigan and Ohio was too small for analysis by
160
Yield Return
state, and therefore results are not presented. Grain
140 Net Return
Fertilizer Cost
yield response to N rate was analyzed for each site
120 MRTN
and then accumulated into a database.
100
$/acre
80
60
40
20
0
0 50 100 150 200 250
N Rate, lb N/acre
Figure 8. Corn grain yield and fertilizer economic components
of calculated net return across N rates; example SC site with
MRTN indicated at 0.10 price ratio (N price $0.22/lb N and corn
price $2.20/bu).
Figure 9. Regional N rate database map indicating the
geographic distribution of N response trial sites.
Datasets for SC and CC from Illinois, Iowa,
Minnesota, and Wisconsin were analyzed using four
N:corn grain price ratios ($/lb:$/bu). The price of
corn was held constant at $2.20/bu and the N price
was varied from $0.11, $0.22, $0.33, to $0.44/lb N to
give ratios of 0.05, 0.10, 0.15, and 0.20, respectively.
Analysis included only responsive sites. Inclusion
of nonresponsive sites had little influence on the
18 Concepts and Rationale for Regional Nitrogen Rate Guidelines for CornMRTN rate (average of 4 lb N/acre lower for SC and vary among states. For example, the N rate at MRTN
5 lb N/acre lower for CC at a 0.10 price ratio for is quite similar for the Minnesota and Wisconsin SC
the multi-state database). If desired, nonresponsive and CC databases, and for the Iowa and Illinois CC
sites can be included in the analysis. However, many databases. For the SC database, N rate at MRTN is
nonresponsive sites are fields that have characteristics greatest for Illinois, intermediate for Iowa, and lowest
that result in quite different response to N. for Minnesota and Wisconsin.
Increasing the N price relative to corn price decreases An interesting result of the MRTN analysis is that
both net return and the N rate at the point of the net return to N is fairly flat at rates that surround
maximum return (Tables 4 and 5, and Figures 10 the point of maximum net return. Thus, a range of N
and 11). Large yield responses to N often occur when rates above and below the MRTN rate that produces
yields without N fertilizer are low, which produces a return to N within $1.00/acre of the MRTN can be
large net returns (that is, there is larger net return used to provide guidance for selecting a profitable
with CC compared to SC due to greater yield increase N rate (LOW to HIGH rates in Tables 4 and 5). This
from added N for CC). Differences in N rate at MRTN range of similar profitability along with the effect
Table 4. For SC, the MRTN and profitable N rate range within $1.00/acre of the maximum return for several N:corn grain
price ratios (nonresponsive sites not included).
MRTN LOW** HIGH**
Price Ratio* N Rate Net Yield N Rate Yield N Rate Yield
$/lb:$/bu lb N/acre $/acre bu/acre lb N/acre bu/acre lb N/acre bu/acre
Illinois
0.05 197 130.62 177 170 175 221 178
0.10 163 110.98 174 143 172 186 176
0.15 141 94.30 172 122 168 161 174
0.20 122 79.86 168 106 165 140 172
Iowa
0.05 145 96.65 180 126 179 170 181
0.10 123 81.78 179 107 176 144 180
0.15 109 69.05 177 93 174 125 179
0.20 95 57.80 174 82 171 111 177
Minnesota
0.05 120 77.96 161 101 159 142 161
0.10 101 65.86 159 86 157 119 161
0.15 90 55.46 158 76 155 103 160
0.20 80 46.20 156 68 153 93 158
Wisconsin
0.05 138 80.51 171 117 170 168 172
0.10 107 66.87 169 98 167 133 171
0.15 101 55.22 168 91 166 114 169
0.20 95 44.28 167 79 163 107 169
*Corn grain price held constant at $2.20/bu; N prices at $0.11, $0.22, $0.33, and $0.44/lb N.
**LOW and HIGH approximates the range within $1.00/acre of the MRTN for each price ratio.
Regional Approach to Corn Nitrogen Rate Guidelines 19of N:corn price ratio can be used to define a range end of the range. Rates at the low end of the MRTN
of suggested N rates. The flat net return surrounding range may be more appropriate for soils with lower
the N rate at MRTN reflects the small yield change productivity potential, while rates at the high end of
near optimum N (Tables 4 and 5, and Figures 5 and 8) the range may be more appropriate for soils without
and indicates that choice of a specific rate within this yield-limiting factors and where greater production
general range is not critical. and external risks exist for producers.
The fact that the data used to develop these For the Iowa SC and CC databases, the calculated
guidelines are from a wide variety of trials should ranges around the MRTN at the 0.10 price ratio
give producers confidence that N applications are quite similar to previously suggested N rate
based on MRTN will provide adequate yield across ranges for Iowa SC (100–150 lb N/acre) and CC
variable production conditions. Also, because of (150–200 lb N/acre) rotations (Voss and Shrader,
the small yield change, rates at the lower end of the 1979). Table 6 gives an example of how N rate
N rate ranges will produce greater N use efficiency guidelines might look for SC and CC in Iowa based
(more bushels per lb N) than will rates at the high on MRTN, and ranges for different price ratios.
Table 5. For CC, the MRTN and profitable N rate range within $1.00/acre of the maximum return for several N:corn grain
price ratios (nonresponsive sites not included).
MRTN LOW** HIGH**
Price Ratio* N Rate Net Yield N Rate Yield N Rate Yield
$/lb:$/bu lb N/acre $/acre bu/acre lb N/acre bu/acre lb N/acre bu/acre
Illinois
0.05 213 156.32 154 184 152 239 155
0.10 176 135.19 152 156 149 199 154
0.15 154 117.08 149 136 146 174 151
0.20 137 101.09 146 122 142 154 149
Iowa
0.05 200 158.98 144 179 142 234 145
0.10 174 138.36 142 153 139 196 143
0.15 152 120.53 139 138 136 171 141
0.20 140 104.34 137 125 133 156 139
Minnesota
0.05 148 129.66 153 133 151 168 153
0.10 136 114.09 152 123 150 150 153
0.15 126 99.69 151 114 148 139 152
0.20 118 86.23 149 103 146 131 151
Wisconsin
0.05 165 105.61 165 140 164 197 166
0.10 139 89.21 164 124 162 157 165
0.15 127 74.62 162 111 159 141 164
0.20 112 61.38 159 97 156 129 162
*Corn grain price held constant at $2.20/bu; N prices at $0.11, $0.22, $0.33, and $0.44/lb N.
**LOW and HIGH approximates the range within $1.00/acre of the MRTN for each price ratio.
20 Concepts and Rationale for Regional Nitrogen Rate Guidelines for CornIllinois - SC Iowa - SC
160 160
0.05 0.05
140 0.10 140
0.10
0.15 0.15
120 120
0.20
Return to N, $/acre
Return to N, $/acre
0.20
100 100
80 80
60 60
40 40
20 20
0 0
0 50 100 150 200 250 0 50 100 150 200 250
N Rate, lb N/acre N Rate, lb N/acre
Minnesota - SC Wisconsin - SC
160 160
0.05 0.05
140 140 0.10
0.10
0.15 0.15
120 120
0.20
Return to N, $/acre
Return to N, $/acre
0.20
100 100
80 80
60 60
40 40
20 20
0 0
0 50 100 150 200 250 0 50 100 150 200 250
N Rate, lb N/acre N Rate, lb N/acre
Figure 10. For SC, net return to N and effect of fertilizer N:corn grain price ratio. The symbols correspond to the MRTN and profitable
LOW to HIGH N rate range given in Table 4.
While the analysis used each state’s entire database,
Table 6. Example N rate fertilization guidelines for SC subsets can be created to determine if site-conditions,
and CC in Iowa based on N:corn grain price ratios and
management history, or regions within or across
economic return calculated by the MRTN approach.
states should have the same or different rate
SC CC
Price guidelines. For example, the MRTN is slightly lower
Ratio LOW* MRTN HIGH* LOW* MRTN HIGH* for SC in northern Illinois (163 lb N/acre) than in
$/lb:$/bu - - - - - - - - - - - - - - lb N/acre - - - - - - - - - - - - - - southern Illinois (179 lb N/acre). Rate guidelines
0.05 125 145 170 180 200 230 thus might be adjusted for different regions within
0.10 105 125 145 155 175 195 a state. In another example, data for Iowa SC sites
0.15 90 110 125 140 155 170 show similar MRTN rate when grouped into various
0.20 80 95 110 125 140 155 yield ranges (128 lb N/acre for 0–150 bu/acre,
*LOW and HIGH approximates the profitable N rate range 126 lb N/acre for 150–200 bu/acre, and 127 lb N/acre
providing net return within $1.00/acre of the MRTN for for 200+ bu/acre). In this case, since the MRTN
each price ratio.
rate is similar across the wide range in yield, N rate
adjustment is not needed based on yield level.
Similar analyses can be applied to other rotations
such as first- or second-year corn following forage
legume, if an adequate number of trials is available.
Regional Approach to Corn Nitrogen Rate Guidelines 21Illinois - CC Iowa - CC
160 160
0.05 0.05
140 140
0.10 0.10
120 0.15 120 0.15
Return to N, $/acre
Return to N, $/acre
0.20 0.20
100 100
80 80
60 60
40 40
20 20
0 0
0 50 100 150 200 250 0 50 100 150 200 250
N Rate, lb N/acre N Rate, lb N/acre
Minnesota - CC Wisconsin - CC
160 160
0.05 0.05
140 140 0.10
0.10
0.15 0.15
120 120
0.20
Return to N, $/acre
Return to N, $/acre
0.20
100 100
80 80
60 60
40 40
20 20
0 0
0 50 100 150 200 250 0 50 100 150 200 250
N Rate, lb N/acre N Rate, lb N/acre
Figure 11. For CC, net return to N and effect of fertilizer N:corn grain price ratio. The symbols correspond to the MRTN and profitable
LOW to HIGH N rate range given in Table 5.
Uncertainty does exist in regard to expectation of to N application. Additionally, application above
having sufficient N to meet crop N needs in any economic rates leads to increased nitrate reaching
given year. Producer concerns have centered on water systems, which carries an environmental cost.
the potential for severe yield and economic losses
associated with deficient N, as shown in Figures 10 To help understand the uncertainty associated with
and 11 at low N rates. In the past, and with choice of a particular N rate, percent of maximum
inexpensive N relative to corn, this uncertainty grain yield can be calculated for each rate guideline
sometimes led to high N application rates. When N and price ratio (Figures 12 and 13). These values are
is relatively inexpensive, rates well above the MRTN based on the yield response among all N rate trials
result in a minor decline in net return (Tables 4 and in the database and provide an expectation that a
5, and Figures 10 and 11). However, as N becomes given N rate will provide a certain level of potential
more expensive relative to corn, N application rates productivity. Individuals can use risk tolerance
much higher than the MRTN result in significant in regard to corn production and decisions about
economic losses. Therefore, the use of high N rates enterprise capital allocation to either refine chosen
to ensure high yield should be reconsidered as this rates, or increase confidence that chosen rates will
strategy will not provide the greatest economic return provide the level of N supply desired.
22 Concepts and Rationale for Regional Nitrogen Rate Guidelines for CornIllinois - SC Iowa - SC
100 100
Percent of Maximum Yield
Percent of Maximum Yield
80 0.05 80 0.05
0.10 0.10
0.15 0.15
60 0.20 60 0.20
40 40
20 20
0 0
0 50 100 150 200 250 0 50 100 150 200 250
N Rate, lb N/acre N Rate, lb N/acre
Minnesota - SC Wisconsin - SC
100 100
Percent of Maximum Yield
Percent of Maximum Yield
80 0.05 80 0.05
0.10 0.10
0.15 0.15
60 0.20 60 0.20
40 40
20 20
0 0
0 50 100 150 200 250 0 50 100 150 200 250
N Rate, lb N/acre N Rate, lb N/acre
Figure 12. For SC, the percent of maximum yield across N rates. The symbols correspond to the MRTN rate for the fertilizer N:corn
grain price ratios given in Table 4.
Producers are often concerned that a suggested N yield in exceptionally good corn production years
rate will not produce an adequate crop if that rate is not compromised with N applied at economically
is determined from an “average response,” or is optimum rates (Figure 4). Therefore, high N rates are
based on economic rather than on “maximum-yield” not needed to ensure high yield.
goals. However, choice of a rate within the profitable
range surrounding the MRTN minimizes the net loss
for over- and underapplication, both in regard to
frequency of occurrence and magnitude of economic
loss. While it may seem logical or desirable to have
N sufficiency near 100 percent, with little to no risk
of N deficiency, producers cannot afford to apply
N at rates providing that level of sufficiency
(Figures 10 and 11). An attempt to meet the N
requirement of the few most responsive sites by using
a high rate across all sites does not result in enough
potential yield gain to pay for that N rate. In addition,
Regional Approach to Corn Nitrogen Rate Guidelines 23Illinois - CC Iowa - CC
100 100
Percent of Maximum Yield
Percent of Maximum Yield
80 0.05 80 0.05
0.10 0.10
0.15 0.15
60 0.20 60 0.20
40 40
20 20
0 0
0 50 100 150 200 250 0 50 100 150 200 250
N Rate, lb N/acre N Rate, lb N/acre
Minnesota - CC Wisconsin - CC
100 100
Percent of Maximum Yield
Percent of Maximum Yield
80 0.05 80 0.05
0.10 0.10
0.15 0.15
60 0.20 60 0.20
40 40
20 20
0 0
0 50 100 150 200 250 0 50 100 150 200 250
N Rate, lb N/acre N Rate, lb N/acre
Figure 13. For CC, the percent of maximum yield across N rates. The symbols correspond to the MRTN rate for the fertilizer N:corn
grain price ratios given in Table 5.
In general, N rates at the MRTN tend to be at or economic return is severely reduced (Figures 10 and
above the EONR for individual sites in some 60 to 11). At higher N rates, the slow increase in the yield
80 percent of trials. While 20 to 40 percent chance response curves illustrates that it takes relatively
of “insufficiency” may seem high, the nature of large increases in N rate to move yield higher; with
the response curves is such that the economic the average return from such high amounts of N
penalties for overapplication and underapplication expected to be negative. Finally, when N increases in
are at a minimum at the MRTN. Therefore, while price relative to corn (larger price ratio), the chance
producers bear some level of risk in order to of having high percent of maximum yield becomes
maximize economic return from N fertilization, lower (Figures 12 and 13) and risk increases.
the MRTN provides the best estimate of the N rate Risks and rewards from N application are therefore
that minimizes this risk. At low N rates, chance of balanced by choice of rates from a range that
N sufficiency is low, risk of N shortage is high, and produces maximum profitability.
24 Concepts and Rationale for Regional Nitrogen Rate Guidelines for CornSummary
Application of the MRTN ▪ For CC, at a 0.10 price ratio
approach to the four-state N ($0.22/lb N:$2.20/bu corn), the
response databases indicates the MRTN rate is 176, 174, 136, and
following: 139 lb N/acre for Illinois, Iowa,
Minnesota, and Wisconsin
▪ The flat net return surrounding datasets respectively.
the N rate at MRTN reflects
small yield change near optimum ▪ Higher N prices relative to Because N fertilizer is one of
N and indicates that choosing corn prices (larger price ratio, the most expensive inputs for
an exact N rate is not critical to $/lb:$/bu) result in reduced net producing corn, N rate guidelines
maximize profit. return, lower MRTN rate, reduced should provide producers the
width of the profitable N rate opportunity to maximize return
▪ The MRTN rate and range range around the MRTN, lower from applied N. Due to a poor
of N rates surrounding the chance of N sufficiency, lower relationship between yield and
MRTN that results in similar percent of maximum yield, and economic optimum N, the
profitability provide guidelines greater economic penalty with N regional N rate guideline approach
for rate selection and flexibility rates above MRTN. does not incorporate yield level.
for producers in addressing Instead, yield responses measured
production risk and price ▪ Nitrogen rates well below MRTN in N rate trials conducted across
fluctuations. result in severe reduction in net many sites provide the database
return, especially with the more required for economic analysis and
▪ Nitrogen rates at the MRTN are N-responsive CC crop sequence. determination of most profitable
different for SC and CC rotations, rates. The MRTN approach
but are not consistent among all ▪ If adequate data exist, subsets provides a flexible method to
state databases. Northern regions can be created to determine if site- develop N rate guidelines directly
have lower N fertilizer application conditions, management history, from response databases on a
rate requirement, likely due to a prior crop, or regions within or local or regional basis. It has
greater amount of N supplied by across states could have different intuitive appeal because it focuses
soil organic matter and different rate guidelines. on maximum economic return
climate and crop conditions. and incorporates likelihood of
expected outcome. Moreover,
▪ For SC, at a 0.10 price ratio guidelines can become interactive
($0.22/lb N:$2.20/bu corn), the rather than static due to the
MRTN rate is 163, 123, 101, and ease of calculation and potential
107 lb N/acre for Illinois, Iowa, for adjustments based on site
Minnesota, and Wisconsin history, N price, and grain price.
datasets respectively. This approach should appeal to
producers and crop advisers since
adjustments in rate can be made
for varying production situations.
Summary 25You can also read