Geotechnical Seismic Vulnerability Assessment of Puerto Vallarta, México
←
→
Page content transcription
If your browser does not render page correctly, please read the page content below
Geotechnical Seismic Vulnerability Assessment of
Puerto Vallarta, México
Christian R Escudero ( christian.escudero@cuc.udg.mx )
Universidad de Guadalajara https://orcid.org/0000-0002-2437-423X
Alejandro Ramirez Gaytan
Universidad de Guadalajara
Araceli Zamora Camacho
Universidad de Guadalajara
Adolfo Preciado
ITESO: Instituto Tecnologico y de Estudios Superiores de Occidente
Karen L. Flores
Universidad de Guadalajara
Adan Gomez Hernandez
Universidad de Guadalajara
Research Article
Keywords: Geotechnical zonation, structural zonation, Puerto Vallarta, site classification, Surface waves
Posted Date: March 19th, 2021
DOI: https://doi.org/10.21203/rs.3.rs-325281/v1
License: This work is licensed under a Creative Commons Attribution 4.0 International License.
Read Full License
Version of Record: A version of this preprint was published at Natural Hazards on July 30th, 2021. See
the published version at https://doi.org/10.1007/s11069-021-04945-w.
Page 1/25
Abstract
We performed a seismic vulnerability assessment that involves geotechnical and building structure
analysis for Puerto Vallarta, Mexico, a city located along the pacific coast. Like many other Latin
American cities, has significant seismic risk. We implemented the multi-channel analysis of surface
waves and the horizontal-to-vertical spectral ratio methods to estimate shear wave velocity and soil
resonance frequency. We considered standard penetration test to determine the penetration resistance
and soil classification. We also defined building typologies based on construction materials and
structural systems. The VS30 parameter shows that Puerto Vallarta has the three poorest soil
classifications. The resonance frequency parameter shows four zones with different fundamental soil
periods. We inferred the building's vulnerability from the coupling between the structural and soil
fundamental period and the soil characteristics. The analysis shows several vulnerable buildings scatters
within the city, e.g., within the tourist area, confined masonry buildings from one to five stories and
moment resistance frame buildings up to 12 in the tourist area, poorly confined masonry houses of one
to two stories, and confined masonry buildings of one to five stories in the residential/commercial. We
present an approach that combines the academic and government to solve a real and transcendental
problem since it might directly affect the regulation and structure evaluations in the area. We are sure that
these exercises are of great interest in urban growth areas in other parts of the world, especially in Latin
America, to achieve seismic risk mitigation.

1. Introduction
We present a multidisciplinary seismic vulnerability assessment that involves geotechnical and building
structure data analysis from the civil engineering point of view and data analysis from the geophysical
perspective. We performed the analysis for a city located along the Mexican pacific coast that like many
other Latin American cities looks to have significant seismic risk levels. Nevertheless, there is a lack of the
necessary research for proper seismic assessment. In this way, we implement an approach that uses data
from local authorities (i.e., civil protection) and geophysical data to provide a seismic vulnerability
assessment.

The studied area, Puerto Vallarta city, is located within a very active seismic zone (Fig. 1), with a
convergent tectonic configuration, i.e., Rivera-Cocos-North American plate subduction system (Stock and
Lee 1994). And, continental fragmentation produced extensional systems, i.e., the Colima and the Tepic–
Zacoalco rift (e.g., Allan 1986; Bandy et al. 1995; Luhr et al. 1985). These tectonic conditions produced
important subduction and intraplate earthquakes.

The most significant historic earthquake in Mexico struck on June 3, 1932, with a magnitude of 8.2 and a
rupture extended from the Puerto Vallarta city, at the north, to Manzanillo towards the south (Kelleher et
al. 1973). Later on October 9, 1995, an 8.0 magnitude earthquake struck the southern coast of Jalisco,
with a ruptured of only half of the 1932 earthquake (Courboulex et al. 1997), supporting the existence of
a seismic gap in the northern Jalisco coast (Singh et al. 1981). Approximately 48 earthquakes greater

                                                   Page 2/25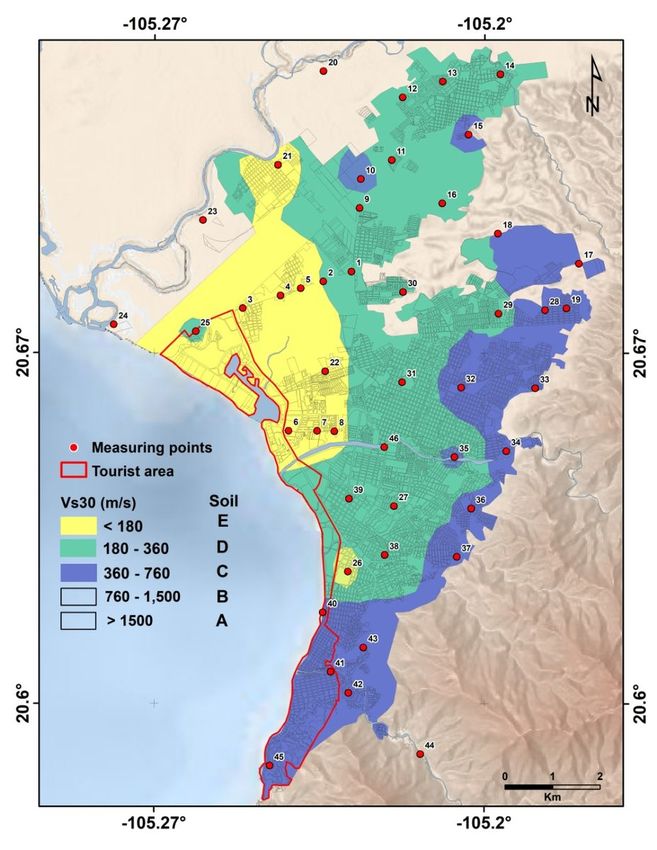
than 6.0-magnitude had struck in the region from the 1800s to the present (Fig. 1). Site effects enlarge
the impact of the earthquake activity.

Puerto Vallarta city is located in the southern part of the Valle de Banderas Graben (Fig. 1), an onshore,
sediment-filled, topographic depression formed by the Tepic-Zacoalco rift branching along the Río Ameca
(Johnson and Harrinson 1990). In this way, much of the Puerto Vallarta city is built on a complex cover of
geologically young deposits of beach and river sands and gravels, as well as estuarine silts. Additionally,
Puerto Vallarta geomorphology has been modified with anthropogenic and natural processes changing
subsurface materials' stiffness.

According to the National Institute of Statistics and Geography (INEGI 2121) national censuses and
counts 2020, Puerto Vallarta's municipality has 291,839 inhabitants, showing an increase of 7.8 percent
in five years. The tourism industry has increased over the years and makes up to 50% of the economic
activity. There are no official numbers of the floating population; however, we can infer it from the
passenger traffic that reaches 57,000 passengers per month through January to March and 222,000 from
July to August, from which 73% of the passengers are international. The tourist industry's substantial
growth causes land-use changes, transforming natural areas to urban zones for hotels and housing
construction and providing services. However, the increase in territorial demand exceeds the competent
authorities' planning and territorial ordering capacity, increasing seismic vulnerability.

Puerto Vallarta is an important tourist city undergoing fast development. However, in spite of the seismic
activity, subsoil characteristics and the exposed elements, no seismic microzonation has been performed.
Therefore, there is a great necessity to elaborate a comprehensive seismic microzonation to contribute in
the development of seismological hazard and risk assessment, to provide useful data for construction
codes, regulations, and for the retrofitting of existing buildings. Moreover, several examples worldwide
have shown that near-surface sediments can significantly amplify ground shaking due to seismic waves.
Therefore it is imperative to characterize the subsoil of areas exposed to seismic hazard and prone to site
amplification. Available geotechnical and geophysical studies of Puerto Vallarta city are sparse or lack
the necessary resolution to estimate seismic site response used as part of earthquake hazard mitigation.
Therefore considering the particularities of Puerto Vallarta soils and the questionable use of traditional
geotechnical methods, in this work, we applied the MASW and H/V methodologies to estimate the
geophysical parameter Vs30, the horizontal-to-vertical spectral ratio (HVSR), and fundamental period, TS,
of the subsoil.

In this work, we combined geophysical techniques to estimate subsoil properties and field observations
of building structure conditions to infer seismic vulnerability. We applied the Multichannel Analyses of
Surface Waves (MASW) and the microtremor horizontal-to-vertical spectral ratio (HVSR) methods to
estimate shear wave velocity (Park et al. 2007) and the primary resonance frequency of soft sediments
overlaying stiff geological bedrock (Nakamura 1989). The soil classification based on these parameters
is fundamental to assess soil–structure resonance that can significantly amplify the seismic damage.
We also considered the Standard Penetration Test (SPT), a simple testing procedure, to determine

                                                   Page 3/25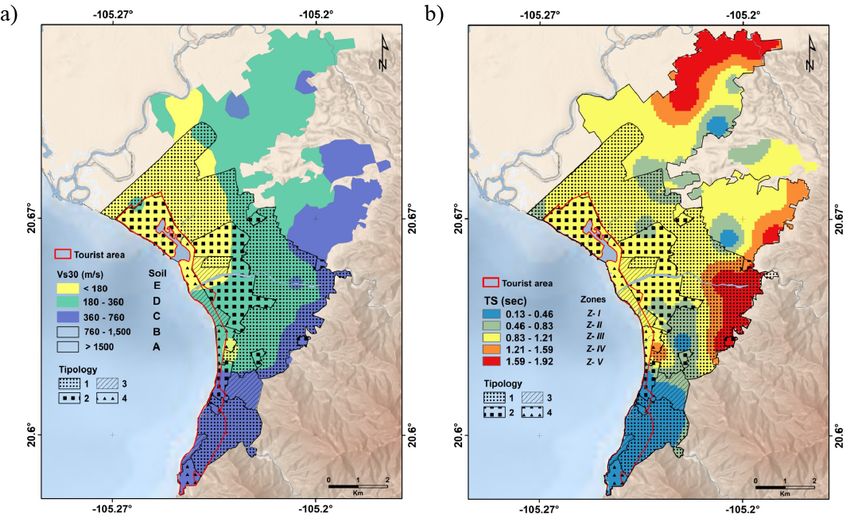
geotechnical parameters by measuring the standard penetration resistance (SPTN) and determining the
soil classification by analyzing collected samples. The correlation of geophysical data with in situ tests
provides a better understanding of the seismic vulnerability.

In this paper, we present an approach that combines the academic and local authorities as part of the
solution of a real and transcendental problem, i.e., seismic hazard and risk, since this work might directly
affect the regulation and evaluations of the structures in the area. We are sure that these types of
exercises are of great interest in urban growth areas in other parts of the world, especially in Latin
America, to achieve seismic risk mitigation.

2. Puerto Vallarta Topsoil And Subsoil
The region has intense fluvial activity, estuaries environments, and coastal activity that dominated the
subsoil production and several anthropogenic landfills. Consequently, Puerto Vallarta has highly
heterogeneous topsoil and subsoil. The only local topsoil classification study was published by the
National Institute of Statistics and Geography (INEGI 2021). The data was sampled between 2002 and
2006, and the soil was classified based on the World Reference Base for Soil Resources, WRBSR (IUSS
2015). Puerto Vallarta has seven soil types (Fig. 2a), i.e., Cambisol at the east of the city, Fluvisol along
the Ameca River, Gleysol surround the estuary El Salado, Leptosol on the mountain areas, Phaeozem,
Regosol on the mountain areas, Solonchak within the coast and estuary areas. Figure 2b shows the
basement in Puerto Vallarta is mainly composed of Quaternary Alluvium around the river flood zone,
Cretaceous silica tuff, and Tertiary conglomerate (INEGI, 2021). It is worth notice that the estuary El
Salado is currently located in a relatively small natural protected area (Fig. 1), it just to cover a larger
territory.

There are no previous published geophysical characterization studies of subsoil at Puerto Vallarta city.
However, Arzate et al. (2006) published a geophysical model of the Valle de Banderas Graben (Fig. 1).
Although the scope of the Arzate et al. (2006) study was providing new insights of the structural
configuration of the graben, it provides a glimpse to the subsoil structure. A gravity survey was carried out
with the purpose of modeling the basement. Results showed that closet to the shore the graben has a
wide-basin geometry relatively shallow at the Puerto Vallarta location towards the mountains where the
basement outcrops. The maximum thickness estimated for the sedimentary layer at the mouth of the
valley is about 2.5 km. Arzate et al. (2006) also performed magnetotelluric, resistivity, and aeromagnetic
surveys that corroborate the sediment depth. However, the results do not provided further subsoil
information mainly because of the resolution of the surveys. It is worth notice, that these geophysical
studies showed a faulted basement beneath the sediment.

3. Materials And Method
The approach consisted of geophysical techniques to estimate subsoil properties and field observations
of building structure conditions to infer seismic vulnerability. From the geophysical perspective, working

                                                    Page 4/25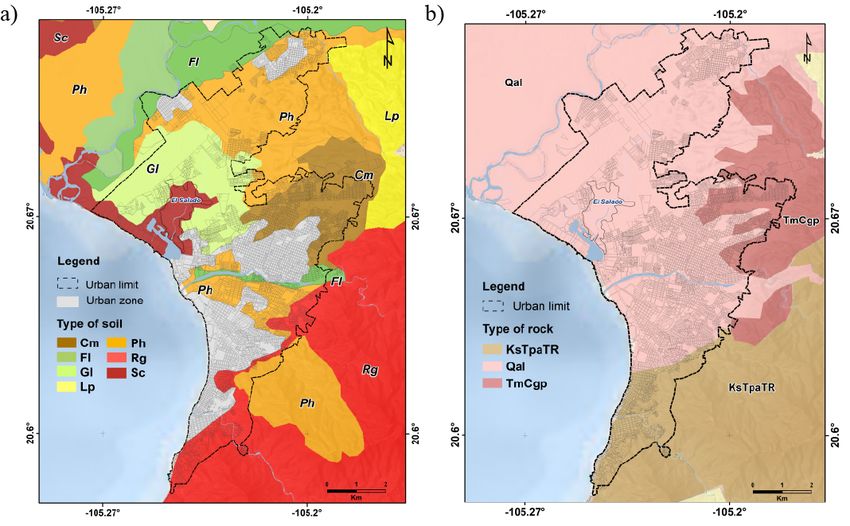
in an urban environment involves several challenges for seismic field measurements due to the sources,
the noise, and the array geometry. Therefore, we implement techniques suitable for urban conditions, i.e.,
the Multichannel Analysis of Surface Waves (MASW) an active seismic methodology and the Horizontal-
Vertical Spectral Ratio (HVSR) a passive seismic analysis methodology. Urban environments also have
advantages, such as information from studies of private companies and individuals that have to be
performed prior the development of civil engineering infrastructure. And in some cases regulations require
that local authorities keep the reports of those studies. In this study, civil protection (CP), “Coordinación
Municipal de Protección Civil y Bomberos, Puerto Vallarta, Jalisco” provides several reports of soil
mechanics studies. It is important to notice that the geophysical studies were performed with their
indispensable collaboration. In addition to the subsoil information, we considered the structural
conditions of the building inventory of Puerto Vallarta.

3.1 Multichannel Analysis of Surface Waves (MASW)

The site geotechnical and geophysical characterization is essential for the seismic and dynamic design
of civil engineering projects. For design purposes, is necessary the site classification based on shear
wave velocity profiles. In the MASW method, Rayleigh waves are generated and used to estimate the
shear wave velocity profile of a test site as a function of depth. Compared to other geophysical and
geotechnical methods, the MASW method is non-invasive, environmentally friendly in an urban
environment, and low-cost. The MASW method is base on the dispersive nature of Rayleigh waves in a
vertically heterogeneous medium. It estimates the frequency-dependent phase velocity of the Rayleigh
waves or dispersion curve, which is related to soil properties. In particular, the shear wave velocity profile
can be determined from the inversion of the experimental dispersion curve (Park et al. 1999). According
to Park et al. (1999), the MASW method consists of three steps, i.e., multichannel seismic records
acquisition, Rayleigh waves dispersion curves estimation, and dispersion curves inversion to estimate the
one-dimensional shear velocity profiles. Fig. 3 shows an example of the data recorded with 24 vertical
geophones (left) and the estimated velocity profile at location COPV.

The shear wave velocity profile provides relevant information about the geotechnical properties of near-
surface materials. The shear wave velocity profile of the uppermost 30 meters is of most interest because
civil engineering structures interact with that subsoil portion. Engineers can use the shear wave velocity
profile, for example, to evaluate the stiffness of the topmost soil layers and to evaluate liquefaction and
soil amplification potential. The European Standard of Design of Structures for Earthquake Resistance
(EUROCODE 8) and the National Earthquake Hazard Reduction Program, NEHRP, proposed the VS30
parameter for soil classification. The VS30 parameter is defined as the average seismic shear wave
velocity between the surface and 30 m depth (Borcherdt 2012). Borcherdt (1992, 1994) proposed the VS30
parameter for the estimation of site-dependent response spectra according to NEHRP (BSSC 2009). VS30
is a well-accepted and robust parameter to characterize local site response and define seismic zoning
within an urban area. The VS30 is obtained using the following equation:

                                                   Page 5/25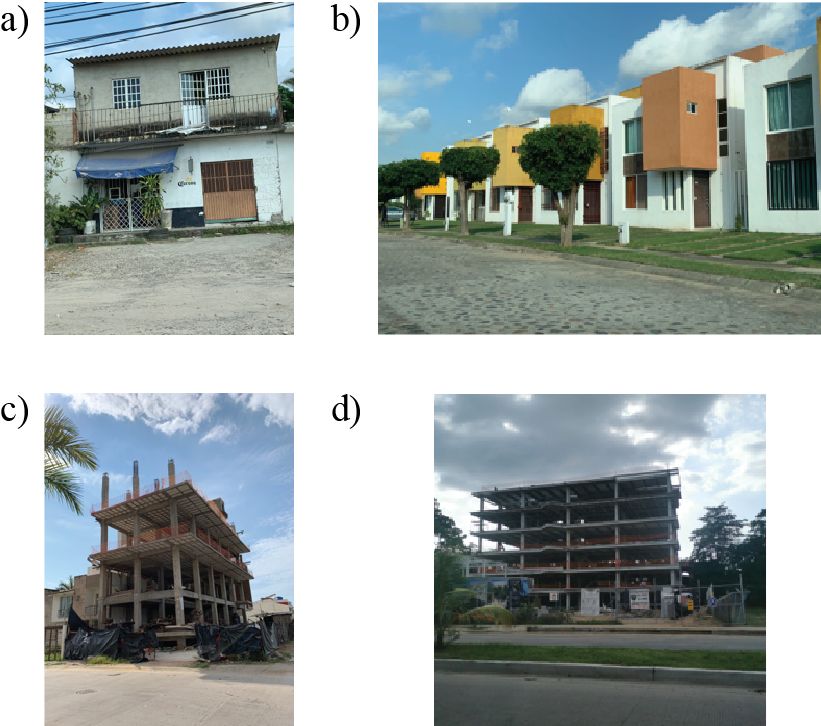
Where corresponds to the thickness of the -th layer between 0 to 30 m depth; and is the shear wave
velocity of the-th layer in m/s. In Table 1 we show the soil type classification according to the NEHRP
(BSSC 2009). For this study, we obtain the VS30 values from shallow-surface 2D velocity profiles, VS-
depth, estimated from the seismic noise analysis using the MASW method.

We chose 52 recording sites evenly distributed over the city of Puerto Vallarta (Fig. 1 and Table 2). The
seismic records were performed using a 24 channels Geode seismograph from Geometrics and 24
geophones with a natural frequency of 4.5 Hz, damping of 50%, cut-off frequency of 80 Hz, and a
sensibility of 0.7 V/in/sec. The active source was a 35 kg iron sphere released from an approximate
height of two meters. We deployed liner arrays with a source offset of 10 meters and two meters
geophone distance. In all recording sites, we performed five blows to obtain good quality seismic records.

3.2 Horizontal-Vertical Spectral Ratio (HVSR) and Soil Fundamental Period (TS)

The HVSR (Nakamura 1989) is a low-cost and straightforward method to estimate the resonance
frequency (FS) and the fundamental period of soils (TS), and therefore, it has been widely used for site
effect studies in the last decade. The TS peak reflects the primary resonance frequency and maximum
amplification of the sediments. In this way, the TS parameter is important because when it is close to the
fundamental frequency of structures, resonance phenomena could be generated, causing severe damage
or collapse. For civil engineering design and this paper's purposes, the TS parameter is used to assess
soil–structure resonance danger.

We chose the same MASW recording sites (Fig. 1); however we only recorded high quality microtremor
data to perform the HVSR analysis in 47 locations (Table 2). The seismic records were performed using
three components seismometer LE-2Dlite MkIII from Lennartz electronics GmbH and Obsidian digitizers
from Kinemetrics. The LE-2Dlite seismometer has eigenperiod of one seconds and upper frequency limit
100 Hz. The seismic sensor was deployed in each recording site and recorded seismic noise during 60
minutes. The seismic noise records were processed using the program GEOPSY 2.9.0 framework and
main tools H/V and array processing (Wathelet et al. 2020). According with process spectral ratio was
estimated through the division of two horizontal components between vertical. Criteria to determine the
size of windows considered that at least 30 periods must be present in the spectra according with
frequency considered. Fig. 4 shows an example of the 60 minutes seismic noise recorded with orthogonal
channels and the estimated horizontal to vertical spectral ratio at location CONV.

3.3 Standard Penetration Test (SPT)

                                                  Page 6/25
The Standard Penetration Test (SPT) is a procedure used in the geotechnical investigation to determine
the relative density, angle of shearing resistance, and the strength of stiff soils. The SPT consists of drill a
borehole to the desired sampling depth using a drill rod with a split-spoon sampler. That basic idea is
driving the sampler into the ground using a hammer dropping from a specific height; then, the required
blows to penetrate a specific depth are known as the standard penetration resistance (SPTN). The results,
with several corrections, are used to estimate the geotechnical engineering properties of the soil. The
split-spoon sampler allows collecting soil samples to classify them according to a specific standard.
To inquire about the soil's geotechnical properties, we analyzed approximately 40 soil mechanics studies
reports performed by private soil laboratories and provided by Civil Protection. However, in this study, we
show six representative standard penetration tests perform within the study area (Fig. 1). Fig. 5 shows
plots of the standard penetration resistance (SPTN) and soil composition against depth. The SPT tests
show that distinct sand, gravel, and clay combinations constitute the subsoil. The test SPTN-1 and SPTN-
3 show soil with predominant contents of well-graded sands with little fines (SW) and silty sands (SM),
and to less extent, poorly graded gravelly sands (SP). This soil composition is consistent with their
location near the coast shore at the north of the city. On the other hand, the test SPTN-2 that is located
within an estuary area shows soil with inorganic silts and clay composition (ML and CL). Finally, test
SPTN-4 and SPTN-6 show soils with mixtures of well-graded gravels with different sand contents (GW
and GS).
3.3 Structures classification and Fundamental Periods
Considering local design and construction practices in Puerto Vallarta city we decided to adopt building
typology based on construction method and story number. We identify four typologies based on the
construction materials and structural system:
Typology 1: Unreinforced and confined masonry houses of one to two stories without a proper seismic
design or auto-constructed, and Adobe houses ( 6a).
Typology 2: Confined masonry houses of one to two stories with seismic design and constructed by an
architect or a civil engineer following the construction/seismic codes and other regulations ( 6b).
Typology 3: Reinforce concrete (RC) buildings of moment resisting frames (MRF) and different
combinations as infill masonry panels or braces ( 6c).
Typology 4: Steel MRF buildings and different combinations as infill masonry panels or braces ( 6d).
According to the currently existing buildings in Puerto Vallarta, we proposed a three groups classification
based on the building height:
Goup 1: Low-rise buildings (height of 3-6 m), with one to two stories and a maximum height of six meters.
Page 7/25Goup 2: Mid-rise buildings (height of 9-18 m), with three to six stories and a maximum height of 18
meters.
Goup 3: High-rise buildings (21-36 m), with seven to twelve stories and a maximum height of 36 meters.
To estimate the fundamental structural period, TE, of the buildings identified in Puerto Vallarta, we
implemented two empirical relations related to the building typology. For typologies one (Fig. 6a) and two
(Fig. 6b), we implement a relation initially proposed by UBC (1997) for shear wall buildings and later used
in EUROCODE 8 (2004),
where H represents the total height of the building. For typologies three (Fig. 6c) and four (Fig. 6d), we
implement a relation proposed by Housner and Brady (1963):
where N is the number of stories. Equation 3 is valid for a maximum number of stories N of 12 with a
maximum height of three meters (total height of buildings of 36 meters). Initially, Housner and Brady
(1963) proposed Equation 3 to estimate the fundamental period of MRF structures/buildings as a linear
correlation with the number of stories. According to Salameh et al. (2016), this expression is used in most
seismic codes in the U.S.A. for steel and RC framed structures. Therefore, Equation 3 is only useful to
estimate the structural fundamental period TE of typologies three and four.
4. Results
We performed a seismic vulnerability assessment of Puerto Vallarta using VS30 and HVSR-Ts geophysical
microzonation, geotechnical data, and building structures analysis. The geophysical parameters were
estimated at approximately 52 sites located within the city (Fig. 1). We recorded seismic data at each site
with linear arrays of 24 vertical geophones and 60 minutes three orthogonal channels of seismic noise
for VS and HVSR estimations, respectively. We further constructed the VS30 soil classification (Fig. 7) and
the Ts iso-period (Fig. 8) maps. Then we used the maps to estimate the resonant vulnerability for
different types of structures and different heights.
Figure 7 shows that according to the VS30 parameter and the NEHRP soil classification (Table 1), the city
of Puerto Vallarta has three soils, i.e., C, D, and E. We found a progressive transition from type C soil at the
northwest area to soil type E towards the east and soil type C at the southeast. The study shows the lack
of type A and B soils in Puerto Vallarta.
Page 8/25According to the parameter Ts (Fig. 8), we divided the city of Puerto Vallarta into four zones. Zone 1, with
the lowest Ts values ranging between 0.13 and 0.46 seconds, blue areas. Zone 2, low-intermediated Ts
values ranging between 0.46 and 0.83 seconds, green areas. Zone 2 mostly appears scattered with zone
3. Zone 3, high-intermediate Ts values ranging between 0.83 and 1.21 seconds, yellow areas. Zone 3
covers most of the city, extends from the center to the north and northeast. Zone 4, high Ts values
ranging between 1.21 to 1.92 seconds, red and orange areas.
With the use of Equation 2 for typologies one and two (Fig. 6a,b), it is estimated a fundamental period TE
of 0.114 seconds for one story houses and 0.192 seconds in case of two story with a story height of 3 m
and 6 m respectively. Considering the four typologies of Equation 3, the structural fundamental periods
for group 1 ranges from 0.1 to 0.2 seconds, for group 2 from 0.3 to 0.6 seconds and in the case of high-
rise buildings of group 3 from 0.7 to 1.2 seconds. It is worth noting that the structural fundamental
periods obtained with Equation 2 are in agreement with the ones obtained with Equation 3. Thus, and for
practical reasons, the fundamental periods of the buildings under consideration for this study are into the
range of 0.1 to 1.2 seconds.
5. Discussion
The estimated VS30 values, and therefore the NEHRP soil classification (Fig. 7), correlate with the geology
and geomorphology of the area (Fig. 2a). The highest VS30 values were estimated for sites located at the
southern and southeastern region of the city, near the mountains with hard soils, i.e., riolythic tuff
material (KsTpsTR). The central and northeast region has class D soil with VS30 ranging between 180 to
360 m/s that correlates with alluvial (Qal) materials representing the entire sedimentary roof deposited
over the basin over time. Finally, the northwest of the city has class E soil with VS30 values less than 180
m/s (Fig. 7) and Gleysol (Gl) soil. While the SPT shows principally well and poorly graded sands, and in
less content silty sands, silts and clays. The soil characteristics and the shallow water table in this area
must be analyzed to determine the possible occurrence of liquefaction.
The estimated TS values (Fig. 8) correlate with the geology, soil classification (Fig. 2) and the VS30
parameter (Fig. 7). Zone 1, identified in the map with blue color (Fig. 8), covers the city’s southeast near
the mountain area with shallow and outcropping rocks. Fig. 8 shows that zone 1 correlates with the
riolythic tuff region material (Fig. 2b) and VS30 soil class C (Fig. 7). The riolythic tuff considered
consolidated volcanic rock is expected to have low Ts values, in agreement with those in Fig. 8 that range
between 0.13 and 0.46 seconds in this area. Zone 3 identified in the map with yellow color, covers most
of the studied area and correlates with alluvial (Qal) materials (Fig. 2b) and VS30 soil class D and E (Fig.
7). Although there are no enough SPT to have a detailed map, the SPTN-1 to SPTN-5 that are located
within this area shows distinct sand, gravel, and clay combinations that constitute in situ measurements
that corroborate the composition of this kind of subsoil. It is worth notice that most urban area of Puerto
Vallarta city is located on this alluvial deposits. With particular interest, around the estuary El Salado, at
the northwest part of the area (Fig. 2a) overlaps with Gleysol (Gl) soil type and the lowest VS30 values of
Page 9/25the study area with soil class E. Characteristic of having a shallow phreatic zone, in addition to being
soils prone to flooding. Finally Zone 4 identified in the map with red and orange colors, is located in two
zones within the studied area, one at the northern part of the city and the other at the east. The recording
sites that produce the TS values of zone 4 were located in mountain regions with polytmtic conglomerate
(TmCgo), but with different geomorphology characteristics that lead to different soil type. At the
southeaste there is an area of high erosion, i.e. rivers, with Regosol soil while the northwest region has
Fluvisol (Fig. 2a), which are typical of the surrounding rivers, so they are usually very clayey.
It is well known that the site response is intrinsically linked to structural design. For this reason, we
compare the VS30 and the TS geotechnical zonation of Puerto Vallarta with the construction typology and
the fundamental structural period, TE of buildings within the city. Fig. 9 shows the building classification
superimposed on VS30 and TS values. The tourist area of Puerto Vallarta mainly located along the shore
is highlighted in Fig. 9 by the red line polygon. Within this area we identified three subzones based on the
TS, i.e., the first with TS of 0.13-0.46 seconds occupying 38%, the second with TS of 0.83-1.21 seconds the
60% and the third with periods ranging from 0.46 to 0.83 seconds 2% of the total tourist area. While the
rest of the city, i.e., the residential/commercial area, where most of the housing, infrastructure such as
schools, hospitals, as well as offices are located. It has dominating soil period corresponds between 0.83
and 1.21 seconds and followed by a very soft soil 1.21-1.92 seconds. Furthermore, some other parts of
minor area are also identified with soil periods of about 0.13-0.83 seconds.
In the structural dynamics field, the coupling between the fundamental structural period, TE, and the
fundamental period of soil, TS, generates the resonance phenomenon at the base of the building and its
structure. The dynamic seismic amplification may lead to collapses in brittle structures and intermediate
to considerable damage with a high probability of collapse/permanent drifts in MRF structures and other
buildings (e.g. Preciado et al. 2020ab; Ramirez-Gaytan et al. 2020). In this way, by comparing the TE and
the TS parameters, we can infer areas vulnerable to intermediate/severe damage or collapse by
resonance effects in case of an intermediate or high-intensity earthquake. (1) Scattered over the city,
Typology 1 (Fig. 6a) adobe and poorly confined masonry houses of one to two stories. (2) Within the
tourist area (TS values between 0.13 and 1.21 seconds), typology 2 (Fig. 6b), confined masonry buildings
with one to five stories (TE values between 0.1 and 0.5 seconds) and typology 3 and 4 (Fig. 6cd), RC and
MRF of steel buildings with one to twelve stories (TE values between 0.1 and 1.2 seconds). (3) Within
residential/commercial areas, at the small-identified areas with TS values between 0.13 and 0.83
seconds, typology 3 (Fig. 6c), especially confined masonry buildings of one to five stories (TE values
between 0.1 and 0.5 seconds). (4) Within the residential/commercial areas, in the area of very soft soil
conditions (TS values between 1.21 and 1.92 seconds), typology 4 (Fig. 6d), MRF buildings of one to 12
stories (TE values between 0.13 and 1.21 seconds). It is worth noticing that within the
residential/commercial areas, there are no intermediate or high-rise buildings; the authors of this paper
recommend no to construct tall buildings in this area.
Page 10/256. Conclusions
Based on VS30 values, Puerto Vallarta has three soil types, i.e., C, D, and E. The city's central area has
type E and D soil, while the south near the mountains has type C soil. Puerto Vallarta has no type A
and B soils, according to the study.
Based on the TS values, we proposed a geotechnical microzonation for Puerto Vallarta consisting of
four zones. Zone 1 shows the lowest TS, between 0.13 and 0.46 seconds. Zone 2 shows TS ranging
from 0.46 to 0.83 seconds mostly appears incrusted and scattered into zone 3. Zone 3 shows
intermediate TS (0.83 to 1.21 seconds) covering the largest area within the city, extends from the
center to north and northeast. Zone 4 shows the longest TS ranging between 1.21 to 1.92 seconds.
Both, TS and VS30 parameter maps ( 7 and 8) show good fit with edaphology and lithology maps
(Fig. 2)
According to the building inventory of Puerto Vallarta, we defined four main typologies in
construction materials and structural systems. The typologies were ranging from auto-constructed
houses of adobe and poorly confined masonry to seismically designed confined houses and MRF
with structural periods for all buildings between 0.1 and 1.2 seconds.
The vulnerability of the buildings, was inferred from the coupling between the structural fundamental
period TE and the soil period TS. Most of the confined masonry buildings from one to five stories and
MRF buildings of one to 12 stories are highly vulnerable to the resonance phenomenon.
The residential/commercial area has vulnerable adobe and poorly confined masonry houses of one
to two stories, confined masonry of one to five stories and low, intermediate and high-rise MRF
buildings. In the very soft soil conditions area (TS between 1.21 and 1.92 seconds), it is
recommended not to construct tall buildings in order to prevent the dynamic amplification by the
resonance effect.
The high-rise buildings in the tourist area exceeding 12 stories are no analyzed due to the limitations
of the empirical equations. In that case, we recommend constructing the 3D models of typical high-
rise buildings to estimate their fundamental period.
The TE is limited by the original assumption of the developer of the empirical relations; therefore it is
necessary to perform a comprehensive instrumentation of buildings within Puerto Vallarta.
Further microzonation analysis using a more sophisticate methodology like multicriteria analysis.
The data and results sharing between local authorities and the scientific community increment the
level of collaboration between the different actors that should collaborate towards the risk
mitigation.
Declarations
Acknowledgments
Page 11/25This research is part of the work program of the CA “CIENCIAS DE LA TIERRA – PELIGROS NATURALES”
number UDG-CA-941. Karen L. Flores was supported by CONACYT-PNPC scholarship. We specially thank
Coordinación Municipal de Protección Civil y Bomberos, Puerto Vallarta, Jalisco for their unconditional
support in the logistics and data sharing.
Founding
This research was in part founded by the research project “Evaluación de la Vulnerabilidad Sísmica en
Puerto Vallarta” from the CA strengthening program from PRODEP (IDCA: 28289; CLAVE: UDG-CA-941).
This research was in part founded by the Coordinación Municipal de Protección Civil y Bomberos, Puerto
Vallarta, Jalisco.
Conflict of interest
The authors declare that they have no conflict of interest.
References
Allan JF (1986) Geology of the Northern Colima and Zacoalco Grabens, southwest Mexico: Late Cenozoic
rifting in the Mexican Volcanic Belt. Geol Soc America. https://doi.org/10.1130/0016-
7606(1986)972.0.CO;2
Arzate JA, Alvarez R, Yutsis V, Pacheco J, López-Loera H (2006) Geophysical modeling of Valle de
Banderas graben and its structural relation to Bahía de Banderas, Mexico. Revista Mexicana de Ciencias
Geologicas. 23:184–198.
Bandy W, Mortera-Gutierrez C, Urrutia-Fucuguachi J, Hilde TWC (1995) The subducted Rivera-Cocos plate
boundary: Where is it, what is it, and what is its relationship to the Colima rift? Geophys. Res. Lett.
22:3075–3078.
Borcherdt R (1994) Estimates of site-dependent response spectra for design (methodology and
justification). Earthquake Spectra. 10:617–654.
Borcherdt R (1992) Simplified site classes and empirical amplification factors for site-dependent code
provisions. NCEER, SEAOC, BSSC workshop on site response during earthquakes and seismic code
provisions, University of Southern California. 1–33.
Borcherdt RD (2012) VS30 – A site-characterization parameter for use in building codes, simplified
earthquake resistant design, GMPES, and shakemaps. 15 World Conference of Earthquake Engineering
Lisboa. 1–10.
BSSC (2009) NEHRP recommended provisions for seismic regulations for new buildings and other
structures. Part1: provisions (FEMA368). Federal Emergency Management Agency, Washington, DC.
Page 12/25Courboulex F, Singh SK, Pacheco JF, Ammon CJ (1997) The 1995 Colima-Jalisco, Mexico, earthquake
(Mw 8): A study of the rupture process. Geophys. Res. Lett. 24:1019–1022.
DeMets C, Traylen S (2000) Motion of the Rivera plate since 10 Ma relative to the Pacific and North
American plates and the mantle. Tectonophysics. https://doi.org/10.1016/S0040-1951(99)00309-1
EUROCODE 8, 2004. Design of structures for earthquake resistance - Part 1: General rules, seismic actions
and rules for buildings. European Standard, European Union.
Gutierrez QJ, Escudero CR, Núñez-Cornu FJ (2015) Geometry of the Rivera–Cocos Subduction Zone
Inferred from Local Seismicity. Bull. Seism. Soc. Am. https://doi.org/10.1785/0120140358
Housner G, Brady A (1963) Natural Periods of Vibration of Buildings. Journal of Engineering Mechanics.
https://doi.org/10.1061/JMCEA3.0000404
INEGI, 2021. Instituto Nacional de Estadística y Geografía (INEGI). Aguascalientes, México.
http://www.inegi.org.mx
IUSS Working Group WRB, 2015. World Reference Base for Soil Resources 2014, Update 2015. World Soil
Resources Reports 106, FAO, Rome.
Johnson CA, Harrison CGA (1990) Neotectonics in central Mexico. Physics of the Earth and Planetary
Interiors. https://doi.org/10.1016/0031-9201(90)90037-X
Kelleher J, Sykes L, Oliver J (1973) Possible criteria for predicting earthquake locations and their
application to major plate boundaries of the Pacific and the Caribbean. J. Geophys. Res.
doi:10.1029/JB078i014p02547
Luhr JF, Nelson SA, Allan JF, Carmichael ISE (1985) Active rifting in southwestern Mexico: Manifestations
of an incipient eastward spreading-ridge jump. Geology. https://doi.org/10.1130/0091-
7613(1985)132.0.CO;2
Nakamura Y (1989) A Method for Dynamic Characteristics Estimation of Subsurface using Microtremor
on the Ground Source. Railway Technical Research Institute. 30:25–33.
Park CB, Miller RD, Xia J (1999) Multichannel analysis of surface waves. Geophysics. 64:800–808.
Park CB, Miller RD, Xia J, Ivanov J (2007) Multichannel analysis of surface waves (MASW)—active and
passive methods. The Leading Edge. 26:60–64.
Preciado A, Santos JC, Silva C, Ramirez-Gaytan A, Falcon JM (2020a) Seismic damage and retrofitting
identification in unreinforced masonry Churches and bell towers by the September 19, 2017 (Mw= 7.1)
Puebla-Morelos Earthquake. Engineering Failure Analysis.
https://doi.org/10.1016/j.engfailanal.2020.104924
Page 13/25Preciado A, Ramirez-Gaytan A, Santos JC, Rodriguez O (2020b) Seismic vulnerability assessment and
reduction at a territorial scale on masonry and adobe housing by rapid vulnerability indicators: the case
of Tlajomulco, Mexico. International Journal of Disaster Risk Reduction.
https://doi.org/10.1016/j.ijdrr.2019.101425
Ramirez-Gaytan A, Flores-Estrella H, Preciado A, Bandy WL, Lazcano S, Alcantara-Nolasco L, Aguirre-
Gonzalez J, Korn M (2020) Subsoil classification and geotechnical zonation for Guadalajara City, México:
Vs30, soil fundamental periods, 3D structure and profiles. Near Surface Geophysics.
https://doi.org/10.1002/nsg.12085
Salameh C, Guillier B, Harb J, Cornou C, Bard PY, Voisin C, Mariscal A (2021) Seismic response of Beirut
(Lebanon) buildings: instrumental results from ambient vibrations. Bulletin of Earthquake Engineering.
https://doi.org/10.1007/s10518-016-9920-9
Singh SK, Astiz L, Havskov J (1981) Seismic Gaps and Recurrence Periods of Large Earthquakes along
the Mexican Subduction Zone: A Reexamination. Bull. Seism. Soc. Am. 71:827–843.
Singh SK, Yamamoto J, Havskov J, Guzmán M, Novelo D, Castro R (1980) Seismic gap of Michoacan,
Mexico. Geophys. Res. Lett. https://doi.org/10.1029/GL007i001p00069
Stock JM, Lee J (1994) Do microplates in subduction zones leave a geological record? Tectonics.
https://doi.org/10.1029/94TC01808
UBC (1997) Uniform Building Code. International conference of building officials. Whittier, California, USA.
Wathelet M, Chatelain JL, Cornou C, Di Giulio G, Guillier B, Ohrnberger M, Savvaidis A (2020) A User-
Friendly Open-Source Tool Set for Ambient Vibration Processing. Seismological Research Letters.
https://doi.org/10.1785/0220190360.
Tables
Page 14/25Table 1. NEHRP Soil profile type classifications for seismic amplifications (BSSC, 2003) Soil General description Average shear wave velocity type to 30 meters deoth (m/s) NEHRP A Hard rock Vs30 > 1500 B Rock 760 m/s < Vs30 < 1500 C Very dense soil and soft rock 360 m/s < Vs30< 760 D Stiff soil 1520, w>40%, and Su
Table 1. List of the 52 sites under study in Puerto Vallarta.

      Name      LATITUD       LONGITUD          Vs30 (m/s)   Ts (sec)   Heigth

1     5DIC      20.61735      -105.2326         381          0.29       1–6

2     BOCA      20.67204      -105.2749         156          0.31       1–6

3     CAÑA      20.69514      -105.2086         216          0.23       1–6

4     CHNA      20.58820      -105.2433         420          0.13       7 – 13

5     CLRD      20.76841      -105.1548         221          0.92       1–6

6     CLVA      20.66113      -105.2166         304          0.99       1–6

7     CNTN      20.73548      -105.1851         345          1.72       1–6

8     CONV      20.68027      -105.2326         188          0.74       1–6

9     ECOT      20.75106      -105.1643         248          1.98       1–6

10    EMZP      20.60606      -105.2310         417          0.29       1–6

11    GAST      20.61068      -105.2244         644          0.20       1–6

12    GDVI      20.67760      -105.2412         132          0.97       1–6

13    HERM      20.66001      -105.1898         521          1.93       1–6

14    JRDN      20.63757      -105.2182         251          0.61       1–6

15    JUNT      20.70243      -105.2418         159          0.88       1–6

16    LACA      20.62509      -105.2275         194          1.54       14 – 20

17    LCAL      20.66010      -105.2047         403          0.16       1–6

18    LLAN      20.70820      -105.2033         390          0.67       1–6

19    LVOC      20.63711      -105.2026         373          1.82       1–6

20    MAVA      20.67076      -105.2583         183          1.04       7 – 13

21    MOJO      20.69425      -105.2253         188          -          1–6

22    NGAL      20.56160      -105.2424         632          0.08       1–6

23    NIXT      20.72026      -105.2326         249          0.88       1–6

24    NVHO      20.69467      -105.2960         209          -          1–6

25    ORDZ      20.63898      -105.2273         195          0.80       1–6

26    PALM      20.67483      -105.1878         382          0.98       1–6

27    PAPA      20.68215      -105.2269         182          -          1–6

                                   Page 16/25
28 PARA 20.65186 -105.2396 159 0.94 21 – 25
29 PAUN 20.70335 -105.2188 175 1.93 1–6
30 PSAN 20.59042 -105.2129 404 1.16 1–6
31 PUNI 20.67828 -105.2165 305 - 1–6
32 RAMB 20.62791 -105.2055 455 1.92 1–6
33 RIPU 20.67897 -105.2371 141 3.13 1–6
34 RMAC 20.60202 -105.2274 475 0.21 1–6
35 RNCH 20.73521 -105.1509 199 0.91 1–6
36 SADO 20.71967 -105.1969 329 1.87 1–6
37 SALI 20.67419 -105.1972 331 0.98 1–6
38 SEST 20.64803 -105.1956 382 1.82 1–6
39 SNMA 20.62827 -105.2201 288 0.20 1–6
40 TABA 20.65183 -105.2338 145 0.94 7 – 13
41 TPPV 20.69190 -105.2569 209 0.79 1–6
42 UIXT 20.71829 -105.2085 360 1.87 1–6
43 V750 20.65179 -105.2303 148 0.85 7 – 13
44 VAVI 20.64877 -105.2202 273 1.12 1–6
45 VGPE 20.64689 -105.2060 293 1.93 1–6
46 VIFL 20.67517 -105.2488 159 1.01 7 – 13
47 VIVA 20.68370 -105.1809 530 0.91 1–6
48 VIVE 20.68940 -105.1973 365 0.59 1–6
49 VIXT 20.71528 -105.2166 247 1.93 1–6
50 VMAR 20.66318 -105.2322 147 0.79 1–6
51 VOLC 20.67520 -105.1835 422 1.52 1–6
52 VUNI 20.69973 -105.2250 289 - 1–6
Figures
Page 17/25Figure 1
Map a) shows the main tectonic units within Western Mexico include the Pacific Plate and North
American Plates, the Rivera Plate, the Cocos Plate, and the Jalisco Block (JB). Main tectonic structures
are the Mesoamerican trench, the Tepic–Zacoalco rift (TZR), Colima rifts (CR), Armería Canyon (AC), and
El Gordo graben (GG). Historic seismicity e.g., the 8.2 magnitude 1932 earthquakes (green line; Singh et
al. 1980), 7.6 magnitude earthquake 1973 (blue line; Singh et al. 1981) and the 8.0 magnitude 1995
earthquakes (yellow line; Courbulex et al. 1997). Gray dots show local seismicity from 2006 to 2007
(Gutierrez et al. 2015). Major late Miocene to present volcanism (gray areas). Inset shows the location of
the study region. Figure modified from DeMets and Traylen (2000). Map b) shows Puerto Vallarta city
with seismic data measured and SPT locations. Note: The designations employed and the presentation
of the material on this map do not imply the expression of any opinion whatsoever on the part of
Research Square concerning the legal status of any country, territory, city or area o bbnhjr of its
Page 18/25authorities, or concerning the delimitation of its frontiers or boundaries. This map has been provided by
the authors.
Figure 2
Map a) shows edaphology and map b) shows lithology of the study zone (INEGI 2021). Note: The
designations employed and the presentation of the material on this map do not imply the expression of
any opinion whatsoever on the part of Research Square concerning the legal status of any country,
territory, city or area o bbnhjr of its authorities, or concerning the delimitation of its frontiers or
boundaries. This map has been provided by the authors.
Page 19/25Figure 3
Example of the data recorded with 24 vertical geophones (left) and the estimated velocity profile at
location COPV.
Figure 4
Example of the 60 minutes seismic noise recorded with orthogonal channels (left) and the estimated
horizontal to vertical spectral ratio (right) at location CONV.
Page 20/25Figure 5
Standard penetration resistance, SPTN, versus depth and soil classification according to Standard
Penetration Test performed at six-selected location within Puerto Vallarta city. Gravels (G) well-graded
(W), poorly graded (P), sandy (S). Sands (S), plasticity limits above “A” line pith P.I. > 4 < 7 (M) and (C),
with gravels (G). Silts (M) and Clays (C).
Page 21/25Figure 6
Buildings Classification in Puerto Vallarta. a) typology 1 auto-constructed houses; b) typology 2 confined
masonry with seismic design; c) typology 3 RC MRF and d) typology 4 steel MRF.
Page 22/25Figure 7
VS30 interpolations map for the 55 sites with in Puerto Vallarta and site classification according with
NEHRP (BSSC, 2009). Note: The designations employed and the presentation of the material on this map
do not imply the expression of any opinion whatsoever on the part of Research Square concerning the
legal status of any country, territory, city or area o bbnhjr of its authorities, or concerning the delimitation
of its frontiers or boundaries. This map has been provided by the authors.
Page 23/25Figure 8
Ts interpolation map for the 33 sites under study in Puerto Vallarta. Note: The designations employed
and the presentation of the material on this map do not imply the expression of any opinion whatsoever
on the part of Research Square concerning the legal status of any country, territory, city or area o bbnhjr
of its authorities, or concerning the delimitation of its frontiers or boundaries. This map has been
provided by the authors.
Page 24/25Figure 9
a) Comparison of Vs30 versus structural systems and b) comparison of Ts versus structural systems.
Note: The designations employed and the presentation of the material on this map do not imply the
expression of any opinion whatsoever on the part of Research Square concerning the legal status of any
country, territory, city or area o bbnhjr of its authorities, or concerning the delimitation of its frontiers or
boundaries. This map has been provided by the authors.
Page 25/25You can also read