VERT FILTER TEST, PHASE 3 WITH THE - DPF DINEX DISIC CATALYSED
←
→
Page content transcription
If your browser does not render page correctly, please read the page content below
Abgasprüfstelle (AFHB)
Contrôle des gaz d’échappement
Gwerdtstrasse 5
CH-2560 Nidau
Tel./Tél. +41 (0)32 321 66 80
Fax       +41 (0)32 321 66 81

              VERT Filter Test, Phase 3 with the
                         DPF DINEX DiSiC catalysed
                 on the Liebherr D 934 S Engine
                       according to the VERT *) measuring procedure (VFT 3)

Ordered by:
DINEX Emission Technology A/S, Fynsvej 39, DK-5500 Middelfart, Denmark

Projekt leading:
TTM, Technik Thermische Maschinen, Niederrohrdorf / Schweiz

Report:
J. Czerwinski, Dipl. Ing. Dr. techn.,              M. Kasper, Dr. sc. nat. ETH
P. Bonsack, Dipl. Ing FH                           Th. Mosimann, Dipl. Ing. HTL
University of Appl. Sciences, Biel-Bienne          A. Hess , MSc. ETH
LAB. FOR EXHAUST EMISSION CONTROL                  Matter Engineering AG, 5610 Wohlen
Gwerdtstrasse 5, CH-2560 Nidau / Switzerland

Nov. 2009                                                                               B 269

*)
     Abbreviations see at the end of report
Dinex DiSiC catalysed / VFT3 / TTM / AFHB ’09                                                  2

CONTENTS

1. SUMMARY                                                                                 3

2. INTRODUCTION                                                                            3

3. LEGAL BACKGROUND and VFT-OBJECTIVES                                                     5

4. VFT TEST-PROTOCOL                                                                       5
   4.1. Test-Cycle and procedure (on engine dynamometer)                                   5
   4.2. Sampling lines and test-arrangement (on engine dynamometer)                        7
5. AVAILABLE INFORMATION                                                                   8
   5.1. General information on emission with traps and fuel-additives                      8
   5.2 General Information on secondary gaseous emissions with traps and fuel-additives    8
   5.3. Increase of NO2/NO-ratio when using noble metal coatings                           9
   5.4. Results with the same DPF material                                                10
6. PARTICIPATING INSTITUTIONS and RESPONSIBLE PERSONS                                     10

7. TEST-ENGINE, FUEL and LUBRICANT                                                        11
   7.1. Test engine data                                                                  11
   7.2. Fuel data according to SN EN 590                                                  12
   7.3. Lubricating oil data                                                              12
8. TEST METHODS AND INSTRUMENTATION                                                       13
   8.1. Engine dynamometer and standard test equipment                                    13
   8.2. Test equipment for regulated exhaust gas emissions                                14
   8.3. Particle Size Analysis and optional analytical methods                            15
9. TEST ROUTINE                                                                           15

10. TEST OBJECTS                                                                          16
   10.1. Particle filter                                                                  16
   10.2 Field Test VFT2                                                                   17
11. RESULTS                                                                               17

12. CONCLUSIONS                                                                           19

13. DOCUMENTATION                                                                         19

14. LITERATURE                                                                            19

15. LIST OF ATTACHED FIGURES                                                              20

16. APPENDICES                                                                            20

17. ABBREVIATIONS                                                                         21
Dinex DiSiCcatalysed / VFT3 / TTM / AFHB ’09                                                       3

1. SUMMARY

This report summarizes the investigations with the Diesel Particle Filter DINEX DiSiC catalysed on
a Liebherr engine according to the VERT*) Filter Test Phase 3 after the field test VFT2. The most
important results of the field test are reported.

The investigations comprise all measurements and evaluations, which were performed on Diesel
engines within the scope of the VERT*) project. The size distributions of the particulates were sys-
tematically measured besides the usual engine operating parameters, volatile pollution emissions
and particulate mass emissions.

The technology of this filter material is the same as the DPF DINEX which was previously tested
according to the VERT test procedure VFT1 and yielded excellent filtration results, (see chap. 5.4.).

The analysis was performed at four operating points of the engine and during the attempt of charg-
ing and regeneration of the DPF by means of catalytic coating.

The results can be summarized as follows:

•   with the investigated DPF in the used condition the filtration based on number count reached
    99.4 % and as average of the 4 operation points 99.15%
•   the used DPF eliminates very well the opacimetric acceleration smoke
•   the regeneration of the DPF with the catalytic coating worked very well
•   due to the catalytic activity of the DPF system, there are influences on the gaseous
    components: reduction or elimination of CO & HC. There is no change of NOx but the engine-
    out-NO2 is increased up to the average value Δ NO2 / NOx = 34%.
•   an inspection of the DPF before the tests revealed a perfect condition of the filter material.

The investigated DPF fulfils the criteria of the VERT filter test phase 2 and phase 3 and can be
recommended to the users.

2. INTRODUCTION

The occupational health authorities of Switzerland, Austria and Germany: SUVA, AUVA and TBG
together with the Swiss clean air authority BAFU have performed the VERT project 1994-1999 to
satisfy the increasingly stringent demands on air quality in underground workplaces and offroad [1].

Targets of VERT and LRV

• Evaluate aftertreatment systems for existing engines to reduce particulate emissions
  to < 3 % of engine-out emissions levels - with respect to total EC+OC-mass and particle
  number count in the size range 20-300 nm
• Define certification procedures for such aftertreatment systems
• Establish rules for monitoring field emissions of offroad engines
• Define application guidelines in consensus with engine manufacturers and operators.

*) VERT… Verminderung der Emissionen von Realmaschinen im Tunnelbau
      Verification Emission Reduction Technologies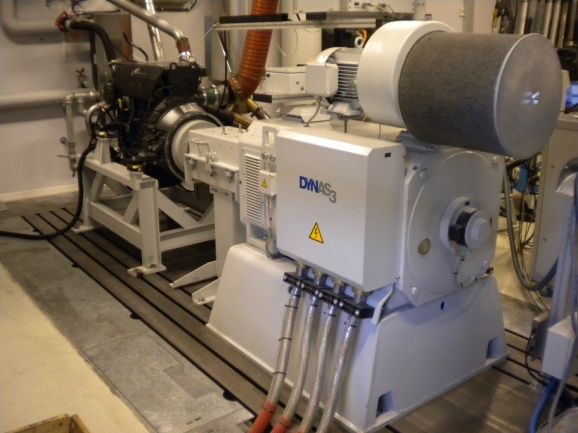
Dinex DiSiCcatalysed / VFT3 / TTM / AFHB ’09                                                         4

VERT was concluded 3/2000 with application tools such as trap-system-specification, certification
procedures and field monitoring standards and a list of VERT-approved trap-systems published in
the SUVA/BAFU-Filter-List [2], yearly updated. Only traps systems which have successfully
passed the VERT-Filter-Test VFT are listed in this document and they remain in this list only if they
continue to prove their quality in the field.

The particulate trap system has proved to be the only available effective measure to curtail particu-
late emissions. Regeneration of such traps requires appropriate technical means such as burners,
heaters, catalytic coatings or fuel additives. All such means must be certified together with the trap
system and quality-monitored in the field. Continuous electronic OBD is a further requirement to
control such systems, which need to perform automatically and safe for the engines and the envi-
ronment.

Research on trap systems has revealed that traps can become highly active chemical reactors be-
cause of their extremely high specific surface. They can adsorb any substances offered by the ex-
haust gas, extent their residence time under high temperature conditions and thereby create prod-
ucts which did not exist in the exhaust before or in much lower concentrations. This chemical activ-
ity can be increased by the presence of catalysts originating from fuel or lube-oil, additives or coat-
ings. It has been shown that extremely toxic substances can be created such as PCDD/F**) in very
high concentrations [3]. This has prompted the introduction of a so-called VERT-Secondary-
Emission-Test VSET which must be performed in all cases where such catalytic means are used.

Swiss legislation for the workplace [4] and offroad [5] where traps are now mandatory on all Diesel
engines is based on VERT-results and requires exclusive use of systems which have successfully
passed VFT and VSET. These test protocols are also approved by the German UBA , the Austrian
AUVA, the German TBG, the Canadian DEEP, London LEZ, New York USA, Südtirol Italy, NL EPA
Chile EPA, CARB, MSHA, INRS.
The VERT measuring procedures were carefully reconsidered and described in the Swiss Norm
SNR 277205 (Sept. 2007), [6].

In the amendment to the Clean Air Ordinance (LRV) from Sept. 19th, 2008, (part 4a and appendix
4, paragraph 3) [5], the Swiss Federal Office of Environment established new legal base for the
approval of construction machines and DPF systems for retrofitting.
These procedures, here simply called LRV are based on VERT test procedures and SNR 277205..
There are some simplifications of quality requirements and a change of administrative procedure,
which became a conformity testing and conformity certification, like for different other products, ac-
cording to the federal law.

LRV offers two options to control the emission quality of construction machines (both OEM and ret-
rofit).

•   fulfilling of nanoparticles counts limit value of 1012 1/kWh in the NRSC and NRTC according to
    the guideline 97/68/EG (possibility for OEMs),
•   using of DPF system, which fulfils the LRV-requirements.

Since January 2009, the Federal Office BAFU transformed the VERT Filter List in a LRV List,
which recommends the DPF systems suitable for retrofitting.

The Association of Retrofit Manufacturers (AKPF) decided to create a VERT Association, which
owns the legally protected label “VERT” and will continue to take the worldwide responsibility for
BAT- VERT procedures and of VERT Filter List. In this way, a regular attention will be paid to: ad-
ditional quality requirements (which are not included in LRV), activities of knowledge transfer, con-
sulting and support for the users and for industry and a control of the aftermarket service.

**) PCDD/F...     polychlorinated dibenzodioxins / furans (isomers)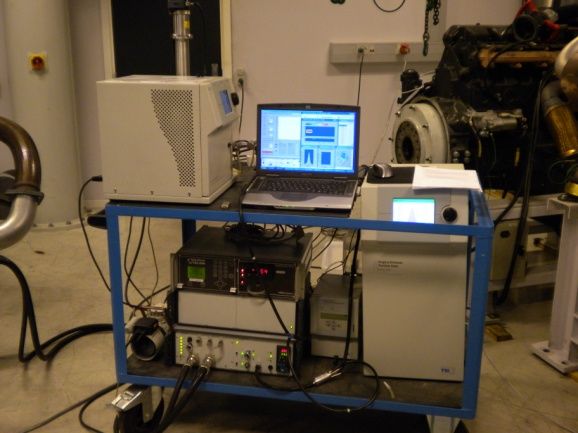
Dinex DiSiCcatalysed / VFT3 / TTM / AFHB ’09                                                           5

There is a close and continuous collaboration between the committees of VERT verification proce-
dures and LRV conformity.

3. LEGAL BACKGROUND and VFT-OBJECTIVES
Swiss legislation supports the use of particulate traps but in case of regeneration procedures using
fuel additives or catalytic coatings it requires to proof that there will be no additional substances
produced which can affect human health or the environment in general.
The first regulation issued by the EJPD (Swiss Ministery of Justice) on 7.August 1990, based on
Art. 84 Abs.1 BAV states “ In Verkehr stehende und neue, ohne Partikelfilter typengeprüfte Fahr-
zeuge, können nachträglich mit Partikelfiltern ausgerüstet werden.....beim Einsatz von additiv- oder
katalytischunterstützten Regenerationsverfahren ist nachzuweisen, dass eine Gefährdung von Ge-
sundheit und Umwelt durch die zusätzlichen entstehenden Reaktionsprodukte ausgeschlossen ist“
[7].
Based on this the VERT trap-system specification requires under “additional constrains for emis-
sions”, that “there shall be no clearly detectable and relevant increase of emissions compared to
the initial engine conditions”, where “relevant” is defined by the SUVA MAK-threshold levels at the
working place and the general BAFU (Swiss EPA) threshold levels for ambient air [6, 8].

Beside of these requirements particulate trap-systems installed and operating in offroad vehicles
must comply with existing legislation in particular with respect to noise emission, safety aspects [9]
and new-substance-regulations, [10].

VFT-Objectives:
Objectives of the three phases of the VERT-Filter-Test are:

Phase 1 (engine dynamometer tests):
•  quality control of the filter material – filtration efficiency of counts and of mass at different soot
   loading
•  functionality of regeneration system
•  particle size analysis over 20-300 nm:
•  monitoring of gaseous emissions during regenerations (part of VFT).
Phase 2 (field test):
•  control of the long-term behaviour of the particulate trap system in field application
Phase 3 (engine dynamometer tests):
•  shortened procedure of the trap quality control after a long field application (until 2000 h)

4. VFT TEST-PROTOCOL

4.1. Test-Cycle and procedure (on engine dynamometer)

In general 4 operating points of the ISO-cycle 8178 C/4 C1 designed for construction site engines
are selected as the basis for all emission measurements, Fig. 1 (symbols ⊗):

•   Operating point 5:   full load, mean RPM (max. torque)
•   Operating point 7:   mean RPM, 50% load
•   Operating point 3:   rated RPM, 50% load
•   Operating point 1:   full load, rated RPM
Dinex DiSiCcatalysed / VFT3 / TTM / AFHB ’09                                                      6

                                               Mercedes Benz OM 926 LA

                                 100                           5

                                                                                          1
                                                               6

                      load [%]
                                                                                          2
                                 50                            7
                                                                                          3

                                                                                          4
                                  0    8

                                       800             1480                      2250

                                                      engine speed [rpm]

Fig. 1: Operating points of the VERT-Filter-Test

The test is driven in the fixed sequence after a warm-up phase until engine coolant temperature
reached >83 °C and lube-oil > 90° (test routine see chap. 9).

VFT, Phase 1

The first quality control of the trap is the free acceleration with opacity measurement. The peak
opacity has to be lower than 5%.

The following test sequences are:
•  4-point-test with a “trap new” (or in state of delivery),
•  charging of the trap with soot
•  2-point-test with a “trap soot-loaded”,
•  regeneration of the trap (Fig. 2 example with additive)
•  4-point-test with a “trap regenerated”.

According to the VERT-experiences the opacimetry at free acceleration furnishes analogous infor-
mation, as at torque-converter acceleration.

During the regeneration test the engine torque is increased at nominal (constant) speed. While the
exhaust gas temperature increases the regeneration is indicated by means of the back-pressure,
exhaust gas emissions and NanoMet-signals. All those parameters are on-line measured, Fig. 2.

In certain cases, e.g. if the filter material was already measured in another type of trap, a short-
ened test procedure of the VFT, phase 1, like in the phase 3 can be applied.

VFT, Phase 3 (after field test)

The performed measurements in this case are:

•   free accelerations
•   4-points test procedure with the trap “delivery state”.
•   loading of the trap
•   regeneration of the trap (Fig. 2 example with additive)
Dinex DiSiCcatalysed / VFT3 / TTM / AFHB ’09 7
n [1/min] M [Nm]
2100 550
2000
n 500
450
1900 400
1800 350
Engine Exhaust
M
300
1700
250
1600 200 Part flow
0 600 1200 1800 2400 3000 3600
t [s]
Dilution Tunnel Sampling for
Or MD 19 Gases
T [°C] p5 [bar] Minidiluter
500 200
NanoMet CO, HC, NOx
460 160
p5 PM
420 120
SMPS
380 80
T5
340 40
ELPI BSN
300 0
0 600 1200 1800 2400 3000 3600 (13 stages)
t [s]
CO [ppm] HCFid [ppm]
200 30
CO
150 29
HC Fig. 3: Principal sketch of the sampling lines
100 28
and test arrangement.
50 27
0 26
0 600 1200 1800 2400 3000 3600
t [s]
Fig. 2: Regeneration of a trap with an
Fe-additive, (on engine dynamometer).
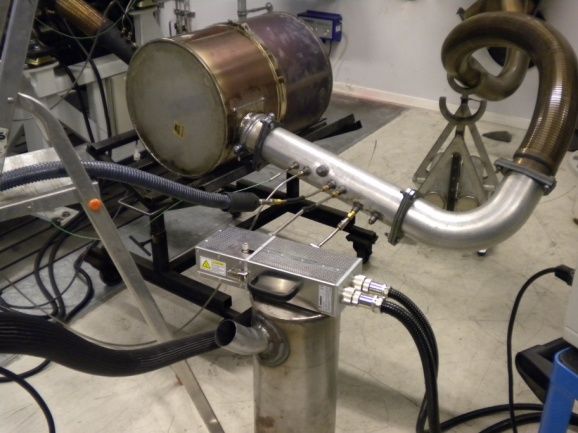
4.2. Sampling lines and test-arrangement (on engine dynamometer)
2 sampling lines are used, Fig. 3:
• sampling via Part-Flow-Dilution tunnel, or MD 19 Minidiluter
for direct on-line size, count, and surface information using SMPS, NanoMet and ev. ELPI, as
well as for gravimetric particulate mass (PM) measurement
• sampling of gas from the undiluted exhaust gas for the gaseous components and Bosch
Smoke Number (BSN)
On-line measurements (for each operating point)
• Regulated pollutants total HC by FID , CO by NDIR, NOx by chemiluminescence detection
(CLD)
• Particle count by SMPS in combination with thermoconditioner
• Size-specific particulate mass by ELPI (if desired)
• Particle surface and particle composition by NanoMet
• Control parameters: pressures and temperatures.
For details of the sampling, and analysis of nanoparticulates see annex A1 and for the off-line op-
tional analytical methods see annex A2.Dinex DiSiCcatalysed / VFT3 / TTM / AFHB ’09 8
5. AVAILABLE INFORMATION
5.1. General information on emission with traps and fuel-additives
During the VERT project, experience was obtained regarding the properties of ultrafine particulates
at engine-out conditions as well as downstream of the aftertreatment devices such as particulate
traps or oxidation catalysts or combinations of both [1], [2], [11], [12], Fig. 4.
In particular, it was found that fuel additives (called regeneration additives, FBC) mostly reduce
particulate mass but increase the number count of ultrafine particles in some cases by two orders
of magnitudes forming a clearly pronounced bimodal size distribution of engine-out solid particles.
It was proved in previous cases that these were solid non-carbonaceous particles presumably con-
sisting of clusters of primary metal-oxide particles in the size range around 20 nm, Fig. 5.
Fig.4: Particle size distribution Fig. 5: Additive ash particle formation
with/without Additive depending on concentration
It was also shown that this bimodal distribution was dependent on the additive concentration in the
fuel, very pronounced with high concentrations and nearly disappearing with lower concentrations
where the additive was still equally active catalysing soot combustion.
In certain configurations, e.g. with particulate traps but without fuel additive, the ultrafine particulate
count is increased, too. This is mainly caused by the spontaneous condensation of volatile sulfate
or HC. These particulates are mainly volatile and can be absorbed in the activated carbon trap.
They are referred to as spontaneous condensate. They particularly occur under conditions where
there is little condensation surface of solid particulates available and the pertinent substance is in a
saturated state.
When a fuel additive is used with a particulate trap, the count of ultrafine particulates can increase
due to a combination of both effects mentioned above.
Experience shows that the particulate traps have a very good filtration rate for carbon particulates
and metal oxide particles.
5.2 General Information on secondary gaseous emissions with traps and fuel-additives
Since traps provide an ideal environment for generation of new substances from the many educts
supplied by fuel, lube-oil, combustion and engine wear it must be expected, that such chemical
processes can be accelerated by catalysis if catalytically active materials are also present. Fuel
additive substances are by definition catalytically active. Examples from earlier VSET’s demon-
strate how strong such effects may be thus supporting the need of this kind of test:Dinex DiSiCcatalysed / VFT3 / TTM / AFHB ’09 9 Fig. 6 represents the formation of Dioxins in a particulate trap with different fuel additives (FBC). The worst case is simulated by means of doping the fuel with chlorine. Generation of PCDD/F when using a Copper-Additive Fig. 6: Formation of Dioxins in a catalytic active particulate trap When using the copper additive the trap immediately became active, increasing the PCDD/F- emission by about one order of magnitude at limited chlorine content but by more than 3 orders of magnitude for increased chlorine whereas in the case of the Fe- and Ce-additives the PCDD/F- concentration was not influenced with the trap-system. 5.3. Increase of NO2/NO-ratio when using noble metal coatings The ratio of NO2/NO where NO is the less toxic component of NOx , is usually < 0,1 at engine-out conditions. When using noble metal coatings on high specific-surface substrates however NO can be oxidized to NO2 which is 6 times more toxic based on MAK-threshold values. In this case the conversion of NO to NO2 is performed on purpose to support a soot oxidation process at very low temperatures. This process however is obviously not very well controlled, re- sulting in high NO2-slip levels, Fig. 7. The same could happen with Pt-containing additives. It was remarked during several investigations, that the fuel additives (FBC) and some special filter coatings don’t produce the higher NO2-level. More systematic clarifications of these effects were started in 2003.
Dinex DiSiCcatalysed / VFT3 / TTM / AFHB ’09                                                      10

Fig. 7: NO2/NOx for 4 city-buses using Pt-coated catalyst in combination with traps, [13]

5.4. Results with the same DPF material

Several DPF’s with SiC as filtration material were investigated in the VERT verification procedure.

The DINEX SiC monolyths with the same pore size showed a very good filtration efficiency of solid
nanoparticles (up to 99,7 % count filtration efficiency) and a total elimination of the acceleration
smoke. (VFT1, [14]).

With the state of knowledge of today it is proven, that the effects of condensation, especially sul-
phates, overlap the gravimetric results and simulate a worse PM-filtration efficiency. In this situa-
tion the most useful parameter to qualify the trap is the particle count filtration efficiency.

Due to these effects lower particle mass filtration efficiencies are usually indicated.

6. PARTICIPATING INSTITUTIONS and RESPONSIBLE PERSONS

The tests were performed at DINEX engine laboratory, Middelfart DK, with the participation and
contribution of some measuring systems from the Swiss VERT team.

The following institutions participated in the measurements:
•   Laboratories for Exhaust Emission Control of the University of Applied Sciences, Biel-Bienne,
    CH
    (Measurements on engine test rig, leading the test program);
    Prof. Dr. Jan Czerwinski, Dipl. Ing. Th. Hilfiker, Dipl. Ing. P. Bonsack
•   Matter Engineering AG / Wohlen, CH
    (Particle analysis)
    Dr. M. Kasper, Dipl. Ing. Th. Mosimann, MSc ETH A. Hess
•   TTM Technik Thermische Maschinen, Niederrohrdorf, CH
    (Project management);
    Dipl. Ing. A. Mayer.
•   DINEX engine laboratory, Middelfart, DK
    (Measurements on engine test rig)
    Mr. Lars Chr. Larsen, Mr. S. Gjerlev
Dinex DiSiCcatalysed / VFT3 / TTM / AFHB ’09 11
7. TEST-ENGINE, FUEL and LUBRICANT
7.1. Test engine data
SNR 277205, Tab. D.3
Manufacturer / type Mercedes Benz / OM 926 LA
Maximum emission level (legal exhaust level) 97/68/EG step 3A; EPA/CARB Tier 3
Cylinder number and configuration 6 cylinders in-line
Bore / stroke 106 x 136 [mm]
overall displacement 7.20 [dm3]
Compression ratio 17.5 [-]
Serial number / year of manufacture / operating hours 926929-00-667522 / 2007 / 200
Cooling medium (air, water, etc.) water
Combustion process (direct injection, prechamber, etc.) direct injection
Fuel system type solenoid-controlled single unit pumps
Speed governor EDC
Method of air aspiration turbocharging
Charge air cooling system intercooler
Measures to reduce emissions -
Rated power / Rated speed 220 [kW] @ 2200 [min-1]
Low idle speed / high idle speed 600 [min-1]; 2750 [min-1]
Test points of engine in accordance with ISO 8178-4, test cycle
C1
Rated speed Intermediate speed
Test phase 1 3 5 7
Speed [min-1] 2252 2252 1484 1484
Torque [Nm] 1005 492 1308 648
Power [kW] 237.1 116.0 203.3 100.7Dinex DiSiCcatalysed / VFT3 / TTM / AFHB ’09 12
7.2. Fuel data according to SN EN 590
SNR 277205, Tab. D.4
Base fuel (without additive)
Type Diesel fuel Danish market quality
Manufacturer YX Energi A/S
Property Method Unit
Density (at 15°C) ISO 3675 kg/l 0.820 – 0.845
Viscosity (at 40°C) ISO 3104 mm2/s 2.2 – 2.8
Cetane number ISO 5165 - 52 - 54
Cetane index ISO 4264 - 49 - 51
Sulphur content ISO 4260 / 8754 mg / kg max. 10
Cloud point ISO 3015 °C max. -10
Pour point (CFPP) ISO 3016 °C max. -20
Flash point ISO 2719 °C min. 62
Heating value MJ/kg min. 42.5
Aromatic hydrocarbons ISO 3837 % vol max. 2
Conradson at 10% test residue max. 0.02 g/100g
Boiling analysis (at 1013 mbar, 340°C) min. 98 vol%
7.3. Lubricating oil data
YX Energi Texaco Ursa Ultra X, Low SAPS, 10W-40
Property
Viscosity kin 40°C - mm2/s
Viscosity kin 100°C 13.5 mm2/s
Viscosity index 154 (--)
Density 15°C 860 kg/m3
Pourpoint -33 °C
Flamepoint 238 °C
Total Base Number TBN 9.8 mg KOH/g
Sulfur ashes 1.0 %wDinex DiSiCcatalysed / VFT3 / TTM / AFHB ’09 13
8. TEST METHODS AND INSTRUMENTATION
8.1. Engine dynamometer and standard test equipment
t7
p7
Fig. 8-1: Horiba Schenck dynamometer Fig. 8-2: sensors p7, t7
Dynas 3 HD 600
t8
p8
exhaust
gases
SMPS
Thermodiluter NanoMet
Head PAS & DC
sensors
TSI 379020A
Fig. 8-3: sensors p8, t8 and TSI 379020A Fig. 8-4: NanoMet, SMPS and TSI 379020A
Thermodiluter Head (MD19-3E) apparatus
TEOM
MDT-905
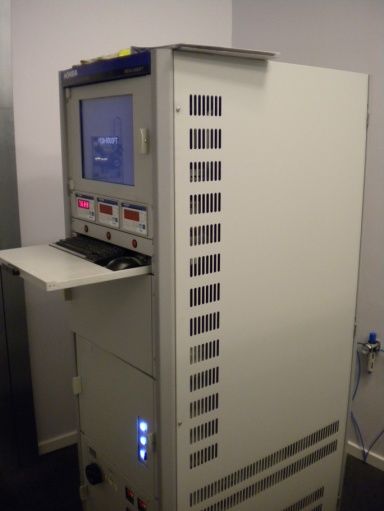
Fig. 8-5: Horiba MDT-905 and TEOM Fig. 8-6: FTIR Horiba MEXA 6000FT
series 1105Dinex DiSiCcatalysed / VFT3 / TTM / AFHB ’09 14
Following laboratory equipment was employed:
Horiba Schenck Engine Test Stand Titan D 600 with:
• Dynamometer Dynas 3 HD 600 with torque measuring flange
• Fuel flow measuring and conditioning unit KMA 4000
• Air flow measuring unit Sensycon Sensyflow P DN 150
• Pressure transducers Schenck CANSAN-SP8
• Thermo-couples Type K, Pt 100
• Intake air conditioning: mixing valve outside / inside air
The engine cell and the measuring cell are separated.
Different parameters are registered on-line via PC or on a chart recorder. The continuous registra-
tion of all parameters is possible.
8.2. Test equipment for regulated exhaust gas emissions
Measurement is performed according to the Swiss Regulation for Exhaust Emissions from Heavy
Duty Vehicles, which responses to the directive 2005 / 55 / EC & ISO 8178:
• Volatile components:
- Horiba exhaust gas measurement device
Type MEXA 6000FT, Fourier Transform Infrared Spectrometer (FTIR)
• Measurement of the particulate emission:
- Sampling and dilution:
Horiba Micro-Dilution Sampling System MDT-905
Diesel particulate mass monitor Tapered Element Oscillating Microbalance (TEOM)
Series 1105 (Rupprecht & Patashnick Co., Inc.)
- Opacimetry:
Bosch BEA mobile
Calculations are done with the user-software MS Excel 2007. All data are saved and are available
for further evaluations.
The corrected exhaust emissions are calculated according to the Swiss Regulation for Exhaust
Emissions from Heavy Duty Vehicles, which responses to the directive 2005 / 55 / EC & ISO 8178.
Formulae used for calculation are listed in appendix A3, nomenclature see A4.Dinex DiSiCcatalysed / VFT3 / TTM / AFHB ’09 15
8.3. Particle Size Analysis and optional analytical methods
In addition to the gravimetric measurement of particulate mass, the particle size and counts distri-
butions are analysed with following apparatus:
• SMPS – Scanning Mobility Particle Sizer, TSI (DMA TSI 3081, CPC TSI 3010)
• NanoMet – System consisting of:
- PAS – Photoelectric Aerosol Sensor (Eco Chem PAS 2000)
- DC – Diffusion Charging Sensor (Matter Eng. LQ1-DC)
- MD19 tunable minidiluter (TSI 379020A Thermodiluter Head
respectively Matter Eng. MD19-3E)
- Thermoconditioner (TC) (i.e. MD19 + postdilution sample heating until 300°C)
A detailed description of those systems can be found in annex A1.
The optional analyses, which can be performed in external analytical laboratories (EMPA, SUVA
and others), are:
• coulometric analysis of PM-filtrate residue, giving EC & OC,
• analysis of SOF / INSOF and sulfates in PM by solvent methods,
• analysis of PAH in gas phase and in PM.
Some further explanations about these methods see annex A2.
9. TEST ROUTINE
• Engine conditioning: with particulate trap 60 minutes; without particulate trap 40 minutes
• Conditioning program: 5 load points, equal duration, ascending load from idling to full load
• Start of the measurements: last 5 min. of the operation point
• For size distributions: 30s after setting the operating point
• Time for complete test sequence: 10 min. per operating point
• Time for repetition measurement: 10 min.
• Sequence of operating points: point 5 – 7 – 3 – 1 – 5 rep.
• Particulate gravimetry: online with TEOM
• Free acceleration with opacimetry
Monitoring of the test conditions
• Ambient temperature: default value (mixing valve outside / inside air)
• Barometric pressure: default value
• Ambient humidity: default value
• CO2 content of the ambient air: not measured
• Temperature in the test cell: mixing valve outside / inside air, set to 22°C
• Air inlet temperature after the filter: 20°C controlled by mixing with
outside air (except for very high ambient temperatures)
• Oil pressure and oil temperature: continuous monitoring by test rig control
• Engine cooling water temperature: continuous monitoring as per manufacturer specificationsDinex DiSiCcatalysed / VFT3 / TTM / AFHB ’09 16
10. TEST OBJECTS
10.1. Particle filter
SNR 277205, Tab. D.1
Manufacturer of filter system Dinex A/S, Fynsvej 39
5500 Middelfart, Denmark
Type / serial number Catalysed Silicon Carbide / PN 984703, SN 121613
Designation of particle filter family DiSiCCATALYSED
Filter medium (particle filter element)
Manufacturer of filter medium Dinex A/S
Type Silicon carbide
External dimensions / weight 11.25” x 12” / 19.5 kg
Material Silicon carbide
Porosity [%] 42-45
Pore size [μm] 15-17
Number of cells per square inch [CPSI] 150, 7 segments
Wall thickness [mm] 0.5
Maximum flow-through rate [m3/s] 0.8125 @ 470°C / 0.71 *)
Maximum space velocity [s-1] 36.4 *)
Maximum operating temperature [°C] 600 cont. / 750 peak
Storage capacity for soot/ash [g] ca. 234
Regeneration
Regeneration procedure NO2 - oxidation
With additive (FBC = fuel borne catalyst)
Manufacturer and specification of additive
Catalytically active substances
Treat rate recommended / standard
Additizing procedure
Specification of dosage device
With catalytic coating
Catalytically active elements / concentration of
Pt 20 g/ft3
catalytically active substances
OBC (electronic on board control unit)
Manufacturerer and specification Dinex DiNLOG
Serial number PN 41005, SN 08100215
The tested filter Dinex DiSiCcatalysed on the engine stand is represented in annex A5. Technical
information from manufacturer – is represented in annex A6.
*) see annex A12 (at bottom)Dinex DiSiCcatalysed / VFT3 / TTM / AFHB ’09 17
10.2 Field Test VFT2
The DPF Dinex DiSiCcatalysed was installed on a Volvo B10 bus with Euro II engine DH 10A 245,
180 kW, operated by Arriva Denmark, Gladsaxe, Denmark.
Description of the field test from the operator:
Description Date Operating km Cumulated km
of the bus of DPF 121613
Installation 10.02.2009 577’418 0
1000h control measurement 02.06.2009 Odometer dysfunctional 24’500 *)
Removal 24.09.2009 Odometer dysfunctional 49’000 *)
Total working km 49’000 *)
Total working hours 2’042
(with = 24 km/h)
*)
according to Arriva
There were continuous controls of backpressure by means of datalogger (examples see
annexes A7).
The distribution-plots of pressure and temperature before DPF (from datalogger) show that the
average backpressure rarely exceeds 50 mbar and the temperature before trap is mostly between
150 and 300°C.
The first control measurement was performed by the Danish Technological Institute, see annex A8.
There is a catalytic influence of the measured DPF system on the gaseous emission components:
reduction of CO and HC and increasing of the NO2/NOx-ratio up to approx. 8% at low idle and 38%
at high idle.
Annex A9 (after 1000h) shows the same influence, there is an increasing of the NO2/NOx-ratio up
to approx. 34% at low idle and 19% at high idle.
The measurements after 2000 operating hours showed a reduction of CO and a decreasing of the
NO2/NOx-ratio down to approx. 9% at high idle. NO2/NOx-ratio at low idle was equal, see annex 10.
11. RESULTS
Inspection
When inspecting the filter supplied after the field test and before starting the VFT3 test procedure
the filter element presented itself perfectly clean at the outlet side and without any signs of failures
such as cracks, leakages or bondings.
The graphic representation of results is given in the attached figures, see chap. 15.
The results of measurements and calculated parameters are tabulated in annex, A11 & A12, see
chap. 16.
Following tendencies can be seen:
Fig. 9 - the DPF DINEX DiSiC catalysed shows a very good reduction of particle mass PM.
Nevertheless one of the most important statements of VERT is: gravimetry is not an appropriate
parameter to characterize the DPF quality. The right metric is the nanoparticles count concentra-
tion.Dinex DiSiCcatalysed / VFT3 / TTM / AFHB ’09 18 There is catalytic influence of the measured DPF-system on the gaseous emission components: reduction or elimination of CO, HC and no influence on NOx. The engine-out-NO2 is increased up to the NO2 / NOx - ratio of 60%. Fig. 10 – the investigated DPF in state of delivery eliminates very well the black smoke during the free acceleration. Beside the standard opacimeter this is also documented by the very sensitive signals PAS & DC (about PAS & DC see comments to Fig. 18) In the following Figures 11 - 15 the SMPS particle size distribution spectra (PSD) without and with DPF are represented. There is generally very good filtration efficiency with penetration values mostly between 0.01 and 0.001. (An exception is the operation points 5, 1st performance in state of delivery). Fig. 16 – the integrated numbers of particles in the size spectrum 20-300 nm show differences with/without DPF, which are generally of 2 orders of magnitude. The smallest differences are at pt. 5 (1st performance). Fig. 17 – the integration of the particulate counts in partial size spectra confirms the findings: gen- erally a very good filtration efficiency. Fig. 18 – shows the results with the on-line measuring sensors at all operating points. The signals of PAS and DC in this figure are converted to the values responding to the undiluted volume concentrations in the exhaust gas. PAS (photoelectric aerosol sensor) is sensitive to the surface of particulates and to the chemical properties of the surface. It indicates the solid particles. DC (diffusion charging sensor) measures the total particle surface independent of the chemical properties. It indicates the solids and the condensates. Additional information about PAS and DC see annex A1. With DPF the values of both signals are reduced generally yielding the penetration values mostly between 0.01 and 0.001. Penetration is a parameter representing the portion of particulates passing through the DPF, it is a ratio of down – to upstream concentrations. penetration = 1 – filtration efficiency The table in Fig. 19 summarizes the filtration efficiencies for mass (PMFE), or counts (PCFE) filtra- tion of the used DPF DINEX DiSiC catalysed. The average filtration efficiency for counts PCFE = 99.31%, is very good and sufficient for VERT. Fig. 20 shows the regeneration attempt, which followed at 2200 rpm with the stepwise increased torque. A first backpressure drop is visible in the 7th step at approx. t7 = 500°C. Fig. 21 represents the results at load steps without DPF. This measuring series were performed to demonstrate other emission components, in particular PAS, DC, NOx, NO, NO2 and compare the results with/without DPF. In Fig. 22 some considerations of the NO2-changes with / without DPF at load steps are represented. The DPF DINEX DiSiC catalysed increases NO2-concentration at all steps. The average increase ratio Δ NO2 / NOx is 34%.
Dinex DiSiCcatalysed / VFT3 / TTM / AFHB ’09                                                        19

12. CONCLUSIONS

The results can be summarized as follows:

•     with the investigated DPF in the used condition the filtration based on number count reached
      99.4 % and as average of the 4 operation points 99.15%
•     the used DPF eliminates very well the opacimetric acceleration smoke
•     the regeneration of the DPF with the catalytic coating worked very well
•     due to the catalytic activity of the DPF system, there are influences on the gaseous
      components: reduction or elimination of CO & HC. There is no change of NOx but the engine-
      out-NO2 is increased up to the average value Δ NO2 / NOx = 34%.
•     an inspection of the DPF before the tests revealed a perfect condition of the filter material.

The investigated DPF fulfils the criteria of the VERT filter test phase 2 and phase 3 and can be
recommended to the users.

13. DOCUMENTATION

The original data are confidential. They are archived at the Exhaust Gas Laboratory of the Univer-
sity of Applied Sciences, Biel.

14. LITERATURE

[1]      VERT Verminderung der Emissionen von Real-Dieselmotoren im Tunnelbau
         Ein Verbundprojekt von Suva, AUVA, TBG und BUWAL, Abschlussbericht
         TTM, A. Mayer, 29.2.2000
[2]      Filter list
         Verified particulate trap systems for Diesel engines
         suvaPro, 1. August 1999
[3]      Influence of particulate trap systems on the composition of Diesel engine exhaust gas
         emissions
         N.V. Heeb, EMPA-Bericht 167985
[4]      Filter-Obligatorium
         Information zur Einführung des Partikelfilter-Obligatoriums
         suvaPro Luzern, 24.1.2000
[5]      Schweizerische Luftreinhalte-Verordnung (LRV)
         Stand 3. Änderung vom 19. Sept. 2008, SR 946.51
[6]      Testing particle filter systems for internal combustion engines. Swiss Norm SNR 277 205,
         Sept. 2007
[7]      Verordnung zur Nachrüstung von Fahrzeugen mit Partikelfiltern
         Eidg. Justiz- und Polizeidepartement, 7. August 1990, V. 7.621.3/V. 7.683.4/V. 7.703
[8]      Grenzwerte am Arbeitsplatz 1994
         Suva Luzern, 1903.d - Ausgabe 1994
[9]      Bundesgesetz über die Sicherheit von technischen Einrichtungen und Geräten (STEG)
         18. Juni 1993
[10]     Verordnung über umweltgefährdende Stoffe (Stoffverordnung, StoV)
         9. Juni 1986/1. Januar 1994
Dinex DiSiCcatalysed / VFT3 / TTM / AFHB ’09 20
[11] Partikelfilter für schwere Nutzfahrzeuge, Technische Grundlagen zur Nachrüstung grosser
Fahrzeugflotten, BUWAL, Oktober 2000
[12] Particulate Traps for Retro-Fitting Construction Site Engines VERT:
Final Measurements and Implementation. A. Mayer et al., SAE 1999-01-0116.
[13] Emissionsmessungen an mit CRT ausgerüsteten Stadtbussen auf dem Rollenprüfstand
der LARAG AG in Wil, März 2000, EMPA-Bericht, 411'289.
[14] J. Czerwinski, T. Neubert, Th. Hilfiker, M. Kasper, Th. Mosimann, A. Hess: VERT Filter
Test, Phase 1: with the DPF DINEX DiSiC catalysed on the Liebherr D 934 S engine. La-
boratory for Exhaust Emission Control of the University of Applied Sciences, Biel-Bienne,
CH, report B220, May 2008.
15. LIST OF ATTACHED FIGURES
Fig. 9 Comparison of the emission parameters
Fig. 10 Opacity and NanoMet at free acceleration in state of delivery
Fig. 11 SMPS-size distributions, 1480 rpm / 1310 Nm,
Fig. 12 SMPS-size distributions, 1480 rpm / 650 Nm,
Fig. 13 SMPS-size distributions, 2250 rpm / 490 Nm,
Fig. 14 SMPS-size distributions, 2250 rpm / 1010 Nm,
Fig. 15 SMPS-size distributions, 1480 rpm / 1310 Nm,
Fig. 16 Integrated counts of particles in the size spectrum 20 – 300 nm
Fig. 17 Integrated counts of particles in different size spectra
Fig. 18 NanoMet-data for each operating point
Fig. 19 Comparison of trapping efficiencies
Fig. 20 Regeneration attempt with stepwise increased torque at 2200 rpm
Fig. 21 Load steps without DPF
Fig. 22 NO2-changes at load steps
16. APPENDICES
A1 Particle size analysis
A2 Optional off-line analytical methods
A3 Calculation formulae
A4 Measured and calculated engine data, nomenclature
A5 DINEX DiSiC catalysed on the test bench
A6 DINEX DiSiC catalysed technical drawings and data from manufacturer
A7 Examples datalogger screening with statistical evaluation of backpressure
A8 Inspection DTI Feb. 2009
A9 Inspection DTI June 2009 (1000h test)
A 10 Inspection DTI Sept. 2009 (2000h test)
A 11 Tables of measured and calculated values: w/o DPF, ULSD (10 ppm)
A 12 Tables of measured and calculated values: with DPF, ULSD (10 ppm), after field testDinex DiSiCcatalysed / VFT3 / TTM / AFHB ’09 21
17. ABBREVIATIONS
AFHB Abgasprüfstelle FH Biel, CH FL full load
AKPF Arbeitskreis der Partikelfilterher FOEN Federal Office of Environment
steller, Austria (BAFU), CH
AUVA Austria Unfall Versicherung- GRPE UN Groupe of Rapporteurs
Anstalt Pollution & Energie
BAFU Bundesamt für Umwelt, (Swiss HD heavy duty
EPA) IARC International Agency for Research
BAT best available technology of Cancer
CARB Californian Air Resources Board ICE internal combustion engines
CFPP cold filter plugging point ICP-MS Inductively coupled plasma mass
CLD chemoluminescence detector spectrometry
CNC condensation nuclei counter INRS Institut National de Recherche sur
la Santé, F
CPC condensation particle counter
JRC EC Joint Research Center
CRT continuously regenerating trap
LEZ low emission zones
CVS Constant Volume Sampling:
LRV Luftreinhalteverordnung, CH
Dilution Tunnel for Regulated
ME Matter Engineering, CH
Emission Measurement
MD19 heated minidiluter
DC Diffusion Charging sensor
MSHA Mines Safety & Health Administra-
DEEP Diesel Engines Emission Pro tion, US
gram, Canada NanoMet NanoMetnanoparticle summary
DI Direct Injection surface analyser (PAS + DC +
DPF Diesel Particle Filter MD19)
DMA differential mobility analyzer NDIR nondispercive infrared
DME Diesel Motor Emissions = EC NP nanoparticles < 999 nm SMPS –
(nomenclature of occupational range)
health authority SUVA) NRSC nonroad stationary cycle
EC Elemental carbon, European NRTC nonroad transient cycle
Community OBD on board diagnosis
ECU electronic control unit OC Organic carbon
EDC Electronic Diesel Control OEM original equipment manufacturer
EDX Energy dispersive x-ray detection OP operating point
EGR exhaust gas recirculation PAH Polycyclic Aromatic Hydrocarbons
ELPI Electric low pressure impactor PAS Photoelectric Aerosol Sensor
EMPA Eidgenössische Material Prüf- und PC particle counts
Forschungsanstalt, CH PCDD/F Polychlorinnated Dibenzodioxins /
EPA Environmental Protection Agency Furans
FAD Förderkreis Abgasnachbehand PCFE particle counts filtration efficiency
ungs –technologien für Dieselmo PM particulate matter, particle mass
toren, Germany
PMFE particle mass filtration efficiency
FBC Fuel Borne Catalyst = Fuel Addi
PMP Particulate Measurement Program
tive = Regeneration Additive
of GRPE
FE filtration efficiency
PSD particle size distribution
FID flame ionization detector
RE reduction efficiencyDinex DiSiCcatalysed / VFT3 / TTM / AFHB ’09 22
SEM Scanning Electron Microscopy UBA Umwelt Bundesamt, Germany
SMPS Scanning Mobility Particle Sizer ULSD ultra low sulfur Diesel
SUVA Schweiz. Unfallversicherungs- US-EPA US – Environmental Protection
Anstalt, CH Agency
TBG Tiefbaugenossenschaft, Germany VERT Verminderung der Emissionen von
TC thermoconditioner, Total Carbon Realmaschinen im Tunnelbau
(Swiss – Austrian – German project,
TEOM trapping element oscillating
DPF retrofitting underground)
microbalance
VFT1 VERT Filter Test Phase 1
TEQ Toxicity-Equivalent
VROM Netherlands EPA
TNO Netherland National, Laboratories,
NL VSET VERT-Sekundäremissionstest
TTM Technik Thermische Maschinen, WHTC worldwide heavy duty transient
CH cycle
TÜV Technischer Überwachungsverein, DYou can also read