Google Matrix of the World Trade Network
←
→
Page content transcription
If your browser does not render page correctly, please read the page content below
Vol. 120 (2012)                                 ACTA PHYSICA POLONICA A                                               No. 6-A

      Proceedings of the 5th Workshop on Quantum Chaos and Localisation Phenomena, Warsaw, Poland, May 20–22, 2011

                  Google Matrix of the World Trade Network
                                    L. Ermann and D.L. Shepelyansky
                  Laboratoire de Physique Théorique du CNRS, IRSAMC, Université de Toulouse
                                          UPS, 31062 Toulouse, France
          Using the United Nations Commodity Trade Statistics Database we construct the Google matrix of the world
     trade network and analyze its properties for various trade commodities for all countries and all available years
     from 1962 to 2009. The trade flows on this network are classified with the help of PageRank and CheiRank
     algorithms developed for the World Wide Web and other large scale directed networks. For the world trade this
     ranking treats all countries on equal democratic grounds independent of country richness. Still this method puts
     at the top a group of industrially developed countries for trade in all commodities. Our study establishes the
     existence of two solid state like domains of rich and poor countries which remain stable in time, while the majority
     of countries are shown to be in a gas like phase with strong rank fluctuations. A simple random matrix model
     provides a good description of statistical distribution of countries in two-dimensional rank plane. The comparison
     with usual ranking by export and import highlights new features and possibilities of our approach.

          PACS: 89.65.Gh, 89.75.Hc, 89.75.−k, 89.20.Hh

                    1. Introduction                              damping parameter α in the WWW context describes
                                                                 the probability 1 − α to jump to any node for a random
   The analysis and understanding of world trade is of pri-      surfer. The value α = 0.85 gives a good classification for
mary importance for modern international economics [1].          WWW [4]. By construction the Google matrix belongs to
Usually the world trade ranking of countries is done             the class of the Perron–Frobenius operators and Markov
according to their export and/or import counted in               chains [4], its largest eigenvalue is λ = 1 and other eigen-
USD [2]. In such an approach the rich countries natu-            values have |λ| ≤ α. According to the Perron–Frobenius
rally go at the top of the listing simply due to the fact        theorem the right eigenvector, called the PageRank vec-
that they are rich and not necessarily due to the fact           tor, has maximal λ = 1 and non-negative elements that
that their trade network is efficient, broad and compet-         have a meaning of probability P (i) attributed to node i.
itive. In fact the trade between countries represents a          Thus all nodes can be ordered in a decreasing order of
directed network and hence it is natural to apply mod-           probability P (i) with the corresponding increasing Page-
ern methods of directed networks to analyze the prop-            Rank index K(i). The presence of gap between λ = 1
erties of this network. Indeed, on a scale of last decade        and |λ| = α ensures a convergence of a random initial
the modern society developed enormously large directed           vector to the PageRank after about 50 multiplications
networks which started to play a very important role.            by matrix G. Such a ranking based on the PageRank al-
Among them we can list the World Wide Web (WWW),                 gorithm forms the basis of the Google search engine [4].
Facebook, Wikipedia and many others. The information             It is established that a dependence of PageRank prob-
retrieval and ranking of such large networks became a            ability P (i) on rank K(i) is well described by a power
formidable challenge of modern society.                          law P (K) ∝ 1/K βin with βin ≈ 0.9. This is consistent
   An efficient approach to solution of this problem was         with the relation βin = 1/(µin − 1) corresponding to the
proposed in [3] on the basis of construction of the Google       average proportionality of PageRank probability P (i) to
matrix of the network and ranking all its nodes with the         its in-degree distribution win (k) ∝ 1/k µin where k(i) is
help of the PageRank algorithm (see detailed description         a number of ingoing links for a node i [4, 5]. For the
in [4]). The elements Gij of the Google matrix of a net-         WWW it is found that for the ingoing links µin ≈ 2.1
work with N nodes are defined as                                 (with βin ≈ 0.9) while for out-degree distribution wout of
                                                                 outgoing links a power law has the exponent µout ≈ 2.7
   Gij = αSij + (1 − α)/N,                               (1)     [6, 7]. We note that PageRank is used for ranking in
where the matrix S is obtained by normalizing to unity           various directed networks including citation network of
all columns of the adjacency matrix Ai,j , and replacing         Physical Review [8, 9] and for rating of the total impor-
columns with only zero elements by 1/N . Usually for the         tance of scientific journals [10].
WWW an element Aij of the adjacency matrix is equal to             The PageRank performs ranking determined by ingo-
unity if a node j points to node i and zero otherwise. The       ing links putting at the top most known and popular

                                                          (A-158)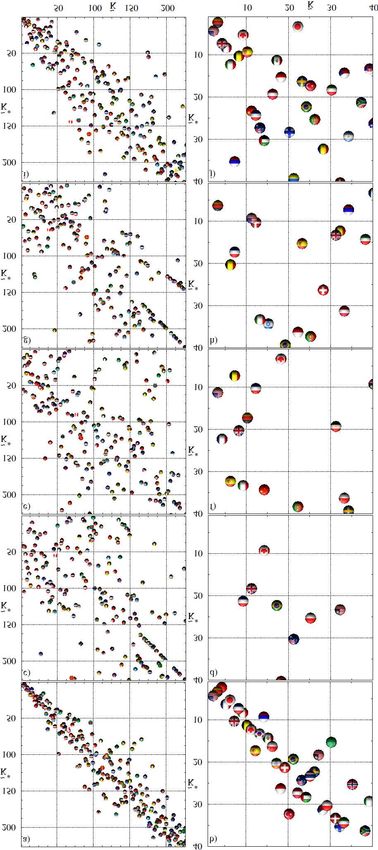
Google Matrix of the World Trade Network                                       A-159

nodes. However, in certain networks outgoing links also
play an important role. Recently, on an example of pro-
cedure called network of Linux Kernel software, it was
shown [11] that it is very useful to introduce an addi-
tional ranking vector P ∗ (i) with ranking index K ∗ (i).
This ranking is obtained by taking the original network
and making inversed all link directions in the original ad-
jacency matrix Aij . This corresponds to the transforma-
tion Aij → AT = Aji . After that an additional Google
matrix G∗ is constructed according to relation (1) at the
same α. The examples of matrices G and G∗ for the
world trade network are shown in Fig. 1. The eigen-
vector of G∗ with eigenvalue λ = 1 gives then a new
inverse PageRank P ∗ (i) with ranking index K ∗ (i). This
ranking was named CheiRank [12] to mark that it al-
lows to chercher l’information (look for the information)
in a new way. While the PageRank rates the network
nodes on average proportionally to a number of ingoing
links, the CheiRank rates nodes on average proportion-
ally to a number of outgoing links. The results obtained
in [11, 12] confirm this proportionality with the exponent
βout = 1/(γout − 1).
   Since each node belongs both to CheiRank and Page-
Rank vectors the ranking of information flow on a di-
                                                                Fig. 1. Image of money mass matrix M (top), Google
rected network becomes two-dimensional. While Page-             matrix G (middle) and inverse Google matrix G∗
Rank highlights how popular and known is a given node,          (bottom) for all commodities (left column) and crude
CheiRank highlights its communication and connectivity          petroleum (right column) for year 2008 with all world
abilities. The examples of Linux and Wikipedia networks         countries N = 227 from the UN COMTRADE [13].
show that the rating of nodes based on PageRank and             Matrix elements g, for Mi,j , Gi,j or G∗i,j , are shown
CheiRank allows to perform information retrieval and            by color changing from 0 to a corresponding maximum
                                                                value gmax . All three matrices are shown in the basis of
to characterize network properties in a qualitatively new
                                                                PageRank index K (and K 0 ) of matrix G, respectively
way [11, 12]. The results presented in [11, 12] show that       for all commodities (left) and crude petroleum (right),
the approach based on PageRank and CheiRank allows              which correspond to x, y-axis with 1 ≤ K, K 0 ≤ N . Here
to classify reliably ingoing and outgoing flows. The treat-     we use α = 0.5 for matrix G and its PageRank index K
ment of ingoing and outgoing flows is especially impor-         and the same α for G∗ ; all nodes are ordered by Page-
tant for trade flows as we will see below. As discussed in      Rank index K of matrix G and thus we have two matrix
[11, 12] this approach has certain similarities with hubs       indexes K, K 0 for matrix elements in this basis.
and authorities of the HITS algorithm but our 2DRank-
ing has an advantage of giving global query-independent
ranking.                                                        For a given year we extract from the UN COMTRADE
   In this work we apply CheiRank and PageRank ap-            money transfer (in USD) from country j to country i that
proach to the World Trade Network (WTN) using the             gives us money matrix elements Mij (for all types of com-
enormous and detailed United Nations Commodity Trade          modities noted above). These elements can be viewed
Statistics Database (UN COMTRADE) [13]. Using these           as a money mass transfer from j to i. In contrast to
data we analyze the world trade flows both in import          the adjacency matrix Aij of WWW, where all elements
and export for all commodities for all years 1962–2009        are only 0 or 1, here we have the case of weighted el-
available there at SITC1 and HS96 databases. We also          ements. This corresponds to a case when there are in
performed analysis for specific commodities taken from        principle multiple number of links from j to i and this
SITC Rev. 1 database, mainly for year 2008: crude             number is proportional to USD amount transfer. Such
petroleum (S1-33101, “Crude petroleum”), natural gas          a situation appears for rating of scientific journals [10],
(S1-3411, “Gas, natural”), barley (S1-0430, “Barley, un-      Linux PCN [11] and for Wikipedia English articles hy-
milled”), cars (S1-7321, “Passenger motor cars, other         perlink network [12], where generally there are few ci-
than buses”), food (S1-0, “Food and live animals”), ce-       tations (links) from a given article to another one. In
reals (S1-04, “Cereals and cereal preparations”). Their       this case still the Google matrix is constructed according
codes and official UN names are given in brackets. In few     to the usual rules and relation (1) with Sij = Mij /mj
cases, when certain countries were non-reporting their ex-    and Sij = 1/N  P , if for a given j all elements Mij = 0.
port, we complemented the WTN data from the import            Here mj =         i Mij is the total export mass for coun-
database.                                                     try j. The matrix G∗ is constructed from transposed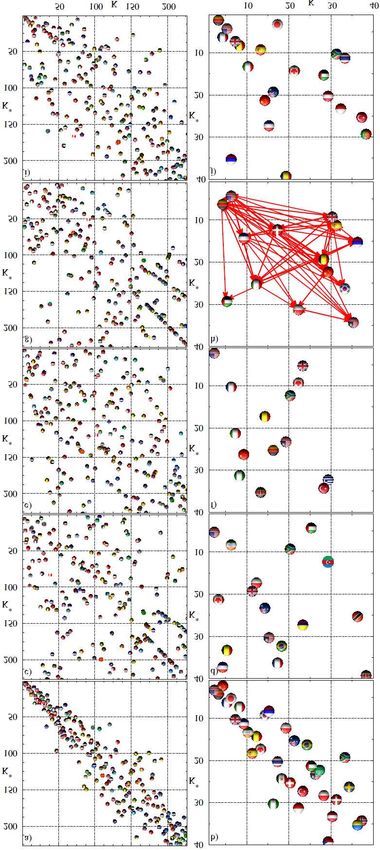
A-160                                         L. Ermann, D.L. Shepelyansky
                                  P
money matrix with Sij = Mji / i Mji . In this way we           (RMWTN) which describes the statistical properties of
obtain the Google matrices G and G∗ of WTN which al-           this distribution in the case of all commodities; compari-
low to treat all countries on equal grounds independently      son with ranking based on import and export for various
of the fact if a given country is rich or poor. A similar      commodities is presented in Sect. 4; discussion of the re-
choice was used in rating of scientific journals [10], PCN     sults is given in Sect. 5. More detailed information and
Linux [11] and Wikipedia network [12]. The main dif-           data are given in Appendix and at the website [24].
ference appearing for WTN is a very large variation of
mass matrix elements Mij related to the fact that there
                                                                    2. Properties of Google matrix of WTN
is very strong variation of richness of various countries.
Due to these reason we think that it is important to use
                                                                   An example of the Google matrix of WTN in 2008 is
the ranking based on the Google matrix which treats in
                                                               shown in Fig. 1 for all commodities and crude petroleum.
a democratic way all world countries that corresponds
                                                               The matrices G and G∗ are shown in the basis where
to the democratic standards of the UN. For the WTN
                                                               all countries are ordered by the PageRank index K of
CheiRank and PageRank are naturally linked to export
                                                               matrix G constructed for corresponding commodity (left
and import flows for a given country and hence it is very
                                                               and right columns). The matrix elements of G are dis-
natural to use these ranks for characterization of country
                                                               tributed over all N values being roughly homogeneous
trade abilities. The Google matrix can be constructed in
                                                               in K, even if the left top corner at small K, K 0 values is
the same way not only for all commodities but also for a
                                                               filled in a more dense way. In contrast the density drops
given specific commodity.
                                                               at large values of K 0 . Such a structure is visible both
   We note that in the past there had been early studies       for all commodities and crude petroleum but clearly the
of flow matrices in demographic population flows [14] and      global density is smaller in the later case since there are
petroleum trade [15] but the unified approach based on         less number of links there (see data in next section). The
the Google matrix combined with PageRank and Chei-             structure of G∗ is approximately the same (we will see in
Rank methods gives now much more detailed and reli-            next section that rich countries are located at low K, K 0
able analysis. More recently the interest to the analy-        values). In contrast to G and G∗ the structure of money
sis of the world trade as a network becomes more and           matrix M is rather different. For all commodities matrix
more pronounced with a few publications in this area           elements drop very rapidly at large values of K and K 0
[16–23]. Thus, the global network characteristics were         that corresponds to the fact that the main amount of
considered in [16, 17], degree centrality measures were        world money circulates only between rich countries with
analyzed in [18, 19] and time evolution of network global      top ranks K. In contrast to that for crude petroleum
characteristics was studied in [20]. Topological and clus-     the matrix elements of M are located at intermediate K
tering properties of trade network and multinetwork of         values. Indeed, in this case PageRank index K orders
various commodities were discussed in [19, 21, 22]. Power      countries by their crude petroleum trade where richest
law distributions of centrality measures have been found       countries are not necessarily at the top ranks.
for undirected trade networks used in [19, 21]. In many            From the Google matrices G and G∗ we find the
studies only undirected network has been used (see e.g.        probability distributions PageRank P (K) and CheiRank
[19, 21]) while the real trade networks are directed and       P ∗ (K ∗ ) which are shown in Fig. 2 for the same com-
thus their properties are rather different from undirected     modities as Fig. 1. One of the main features of these
approximation [23]. It should be noted that the ranking        distributions is that both P (K) and P ∗ (K ∗ ) depend on
based on PageRank is broadly used for WWW and other            their indexes in a rather similar way form, that is in con-
types of directed networks [6–10] but we are aware of          trast to the results found for the WWW [6, 7], PCN
only two works which apply this approach to the WTN:           Linux [11] and Wikipedia network [12], where these dis-
one is available at [18] and another is at very recent [23].   tributions are different having different exponents β in
Here we present a systematic study of directed WTN             the power law decay. Here, up to fluctuations, we have
on the basis of new combination of PageRank and Chei-          βin = βout = β. The size of WTN is rather small com-
Rank methods using the Google matrix constructed for           pared to usual sizes of WWW, Linux or Wikipedia net-
the enormous UN COMTRADE database. The signifi-                works. However, still we find that the power law gives a
cant advantage of our approach is that PageRank per-           quite good fit of our data. The fit gives β = 1.17 ± 0.015
forms analysis and ranking of ingoing links being linked       at α = 0.85 and β = 0.63 ± 0.01 at α = 0.5 (for all
with import trade flows while CheiRank is linked to out-       commodities) and β = 0.92 ± 0.02 and β = 0.51 ± 0.01,
going links being related to export trade flows. In this       respectively (for crude petroleum) for all 227 countries in
way CheiRank–PageRank analysis is very natural for             Fig. 2. For the fit of top 100 countries we have respec-
the WTN.                                                       tively β = 1.15 ± 0.03 (α = 0.85) and β = 0.75 ± 0.008
   The paper is composed as follows: in Sect. 2 we de-         (α = 0.5) for all commodities and β = 1.22 ± 0.015
scribe the global properties of the Google matrix of           (α = 0.85) and β = 0.70 ± 0.008 (α = 0.5) for crude
WTN, in Sect. 3 we analyze distribution of countries           petroleum. There is a certain change of the exponent
in PageRank–CheiRank plane for the whole time period           with a decrease of the fit interval which, however, is not
1962–2009 and propose a random matrix model of WTN             very large. We attribute this to visible deviations at the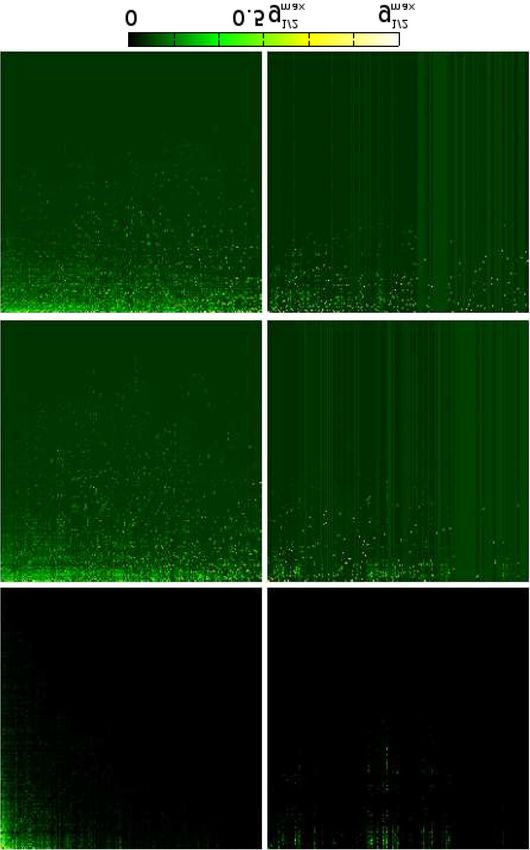
Google Matrix of the World Trade Network                                     A-161

tail of K, K ∗ with small countries (see discussion in next     nential decay at large K results from a strong variation of
section). On average the exponent value is not very far         richness of countries which changes more than by four or-
from the value β = 1 corresponding to the Zipf law [25].        ders of magnitude. From the comparison of ranks shown
                                                                in Fig. 2 it is clear that PageRank and CheiRank give
                                                                more equilibrated and democratic description of trade
                                                                flows.
                                                                   We should note that due to a small size of the WTN
                                                                the fluctuations are stronger compared to large size net-
                                                                works like the WWW. It is especially visible for specific
                                                                commodities where the total number of links is by fac-
                                                                tor 30 smaller than for all commodities (see next sec-
                                                                tion). These fluctuations are smaller for the damping
                                                                factor value α = 0.5 in agreement with the results pre-
                                                                sented in [26, 27]. In fact this α value was also used in [9]
                                                                for PhysRev citation network. Due to that reasons in the
                                                                next sections we show data for ranking at α = 0.5. There
                                                                are only small variations of ranking for all commodities
                                                                in the range 0.5 ≤ α ≤ 0.85 (see data in [24]).

  Fig. 2. Probability distributions of PageRank P (K),
  CheiRank P ∗ (K ∗ ), ImportRank P̃ (K̃), and Export-
  Rank P˜∗ (K˜∗ ) are shown as function of their indexes
  in logarithmic scale for all commodities (top part) and
  crude petroleum (bottom part) for WTN in 2008 with
  N = 227. Here P (K) and P ∗ (K ∗ ) are shown by red and
  blue curves, respectively, for α = 0.5 (solid curves) and
  α = 0.85 (dotted curves); P̃ (K̃) and P̃ ∗ (K̃ ∗ ) are dis-
  played by dashed red and blue curves, respectively. For
  both commodities the distributions P (K) and P ∗ (K ∗ )
  follow a power law dependence like P ∝ 1/K β (see text),
  the Zipf law is shown by the straight dashed line with
  β = 1 in top part.
                                                                  Fig. 3. Spectrum of the eigenvalues λ of the Google
   It is useful to compare the behavior of probabilities          matrix at α = 1 in complex plane for WTN in 2008 with
P (K) and P ∗ (K ∗ ) with respective ranking related to im-       N = 227 countries for all commodities, food, cereals and
port and export. To do that we rank the countries by              barley (from top to bottom); all eigenvalues are shown
probability import P̃ (K̃) defined as a ratio of import in        for each commodity; unit radius circle is also shown.
                                                                  Only the bottom case have quasi-degenerate eigenvalues
USD for a given country K̃ to the total world import
                                                                  close to the circle with 3 values λ = 1, 0.99987, 0.991
in USD for a given year with ordering of all countries            and two values close to λ = −1; other cases have a
in decreasing probability order
                             P index of ImportRank K̃.            significant gap separation from |λ| = 1.
By construction we have        K̃ P̃ (K̃) = 1 and P̃ (K̃) =
mK̃ /MT , where mK̃ is the import mass of a given coun-           Finally let us discuss the spectrum λ of the Google
                   P
try K̃ and MT = i,j Mij is the total world money mass           matrix which follows from the equation for right eigen-
for a given year. In the same way we construct export           vectors ψm (i):
probability P˜∗ (K˜∗ ) with the ExportRank K˜∗ . The de-           X
pendence of these probabilities on their indexes is shown              Gij ψm (j) = λm ψm (i).                      (2)
in Fig. 2. In the range of 1 ≤ K̃, K˜∗ ≤ 50 it can be               j
well described by a power law with β = 1.01 ± 0.03 for          It is known that the dependence on α is rather simple:
all commodities corresponding to the Zipf law (for crude        all eigenvalues, except one with λ = 1, are multiplied
petroleum we obtain for this range β = 1.43 ± 0.07). At         by α [4]. Due to that we show the spectrum of G at
larger values of order index we find a sharp drop with an       α = 1 in Fig. 3. Compared to the spectrum studied
exponential type decay on the tail. For crude petroleum         for other networks (see examples in [11, 27–31]) we find
this exponential decay starts at smaller values of K due        that the WTN spectrum is very close to real line espe-
to a significantly smaller total number of links that gives     cially for three top commodities in Fig. 3. We explain
an increase of β for the range of 50 countries. The expo-       this by the fact that here an average number of links
A-162 L. Ermann, D.L. Shepelyansky
per country is very large for these commodities and that
the matrix elements are not very far from the symmet-
ric relation Mij = Mji at which the spectrum is real.
We only note that for barley the spectrum has quasi-
-degeneracy at λ = 1 that signifies the existence of slow
relaxation modes. We attribute this to the fact that there
are certain countries which practically do not use barley
that leads to appearing of isolated subspaces with cor-
responding quasi-degenerate modes. We will return to
the discussion of spectrum properties of G in the next
section.
3. CheiRank versus PageRank for WTN
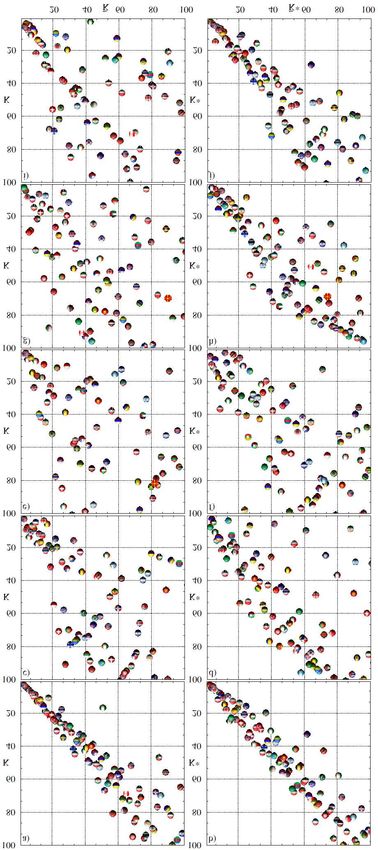
We start from examples of distributions of countries
in the PageRank–CheiRank plane shown in Fig. 4 for 5
different commodities in 2008. The first case of all com-
modities corresponds to trade flows between countries
integrated over all type of products. Even if the Google
matrix approach is based on a democratic ranking of in-
ternational trade, being independent of total amount of
export-import for a given country, we still find at the
top ranks K and K ∗ the group of industrially developed
countries (see more details in Table I). This means that
these countries have efficient trade networks with opti-
mally distributed trade flows. Another pronounced fea-
ture of global distribution is that it is concentrated along
the main diagonal K = K ∗ . This feature is not present in
other networks studied before (e.g. PCN Linux [11] and
Wikipedia [12]). The origin of this density concentra-
tion is based on simple economy reason: for each country
the total import is approximately equal to export since
each country should keep on average an economic bal-
ance. Thus for a given country its trade is doing well
if its K ∗ < K so that the country exports more than it
imports. The opposite relation K ∗ > K corresponds to
a bad trade situation. We also can say that local minima
Fig. 4. Country positions in PageRank–CheiRank
in the curve of (K ∗ − K) vs. K correspond to a suc- plane (K, K ∗ ) for world trade in various commodities
cessful trade while maxima mark bad traders. In 2008 in 2008. Each country is shown by circle with its own
most successful were China, Rep. of Korea, Russia, Sin- flag (for a better visibility the circle center is slightly
gapore, Brasil, South Africa, Venezuela (in order of K for displaced from its integer position (K, K ∗ ) along direc-
K ≤ 50) while among bad traders we note UK, Spain, tion angle π/4). The parts show the ranking for trade
Nigeria, Poland, Czech Rep., Greece, Sudan with espe- in the following commodities: all commodities (a, b);
cially strong export drop for two last cases. The compar- crude petroleum (c, d); natural gas (e, f); barley (g, h);
cars (i, j). Left column shows a global scale with all 227
ison of our ranking with the import-export ranking will countries, while right column gives a zoom in the region
be analyzed in the next section. of 40 × 40 top ranks. For barley in part (h) the links
Even if there is a concentration of density along the between countries inside the selected region are shown
main diagonal (Fig. 4a) we still have a significant broad- by arrows.
ening of distribution especially at middle values of K ≈
100. This means that the gravity model of trade, of-
ten used in economy (see e.g. [1, 18]), has only approxi- reason of such a strong scattering is clear: e.g. for crude
mate validity. Indeed, in this model the mass matrix Mij petroleum some countries export this product while other
is symmetric that would place all countries on diagonal countries import it. Even if there is some flow from ex-
K = K ∗ that is definitely not the case. porters to exporters it remains relatively low (see more
If we now turn to the distribution of countries for a discussion in the next section). This makes the Google
trade in a specific commodity then it becomes absolutely matrix to be very asymmetric. Indeed, the asymmetry
clear that the symmetry approximately visible for all of trade flow is well visible in Fig. 4h where arrows show
commodities is absolutely absent: the points are scat- the trade directions between countries within top 40 × 40
tered practically over the whole square N × N . The ranks for barley.Google Matrix of the World Trade Network A-163
It is also useful to use 2DRank K2 discussed in [12], product (all ranks for commodities of Fig. 4 are given
which orders all nodes according to the order of their in Tables I–V). As an example, we note Singapore which
appearance inside squares of size K × K going from is at the third position in K2 (Table II): it is a small
K = 1, 2, 3, . . . to N for each of four specific commodi- country which cannot export or import a large amount
ties shown in Fig. 4. In a certain sense top countries of the commodity, but its trade network is very active re-
in 2DRank K2 are those which are active traders even distributing flows between various countries that places
not being among large exporters or importers of this it at a high K2 rank.
TABLE I
Top 20 ranking for all commodities — 2008.
Ran K K∗ K2 K̃ K̃ ∗
1 USA China USA USA China
2 Germany USA China Germany Germany
3 China Germany Germany China USA
4 France Japan Japan France Japan
5 Japan France France Japan France
6 UK Italy Italy UK Netherlands
7 Italy Russian Fed. UK Netherlands Italy
8 Netherlands Rep. of Korea Netherlands Italy Russian Fed.
9 India UK India Belgium UK
10 Spain Netherlands Rep. of Korea Canada Belgium
11 Belgium Singapore Belgium Spain Canada
12 Canada India Russian Fed. Rep. of Korea Rep. of Korea
13 Rep. of Korea Belgium Canada Russian Fed. Mexico
14 Russian Fed. Australia Spain Mexico Saudi Arabia
15 Nigeria Brazil Singapore Singapore Singapore
16 Thailand Canada Thailand India Spain
17 Mexico Spain Australia Poland Malaysia
18 Singapore South Africa Brazil Switzerland Brazil
19 Switzerland Thailand Mexico Turkey India
20 Australia U. Arab Emir. U. Arab Emir. Brazil Switzerland
The images of Fig. 4 allow to understand qualita- ber of countries is increased by 38%, while the number of
tively the reasons of density concentration around diago- links per country for all commodities is increased in total
nal K = K ∗ for the case of all commodities: this trade is by 140% with a significant increase from 50% to 140%
composed from hundreds of specific commodities which during the period 1993–2009 corresponding to economy
behave randomly and the averaging over them gives ef- globalization. At the same time for a specific commod-
fective coarse-graining and produces a certain symmetry ity the average number of links per country remains on
for matrix elements due to the central limit theorem for a level of 3–5 links being by a factor 30 smaller com-
a sum of many positive contributions. The fact that the pared to all commodities trade. During the whole period
increase of coarse-graining cell gives more and more sym- the total amount MT of trade in USD shows an average
metry which is well seen in Fig. 3 where the spectrum exponential growth by 2 orders of magnitude.
becomes more and more close to a real one, and hence To understand the physical properties of the WTN we
there is more and more symmetry in elements Gij , when consider the distribution of money mass transfer matrix
we go from barley to cereals, food and all commodities. elements Mij shown versus their transposed values Mji
We will return to the analysis of specific country rank- in Fig. 6. This distribution is symmetric by the construc-
ing in the next section while now we turn to analysis of tion. In the case of symmetric matrix Mij , corresponding
time evolution of WTN. to the gravity model of trade or undirected network, all
The variation of global parameters of WTN during the elements should be located on one diagonal line that is
database period 1962–2009 is shown in Fig. 5. The num- definitely not the case. For crude petroleum the distri-A-164
TABLE II
Top 20 ranking for crude petroleum — 2008.
Ran K K∗ K2 K̃ K̃ ∗
1 USA Russian Fed. USA USA Saudi Arabia
2 Canada Kazakhstan India Japan Russian Fed.
3 Netherlands U. Arab Emir. Singapore China U. Arab Emir.
4 Belgium USA UK Italy Nigeria
5 India Ecuador South Africa Rep. of Korea Iran
6 China Saudi Arabia Canada India Venezuela
7 Germany India Australia Germany Norway
8 Japan South Africa U. Arab Emir. Netherlands Canada
9 Rep. of Korea Nigeria Colombia France Angola
10 UK Sudan Azerbaijan UK Iraq
11 Singapore Azerbaijan Malaysia Spain Libya
12 Italy Venezuela Brazil Singapore Kazakhstan
13 Australia Norway Belgium Canada Kuwait
14 Malaysia Iran Trinidad and Tobago Thailand Azerbaijan
15 Spain Algeria France Belgium Algeria
16 France Singapore Netherlands Brazil Mexico
17 Brazil Kuwait Kenya Turkey UK
18 Sweden UK Angola South Africa Qatar
19 South Africa Angola China Poland Oman
20 Thailand Canada Thailand Australia Netherlands
TABLE III
Top 20 ranking for natural gas — 2008.
Ran K K∗ K2 K̃ K̃ ∗
1 USA USA USA Japan Norway
2 Japan Trinidad and Tobago France USA Canada
3 Rep. of Korea Norway Belgium France Algeria
4 Spain UK South Africa Rep. of Korea Russian Fed.
5 France Russian Fed. Italy Spain Qatar
6 Italy Oman Canada Belgium Belgium
7 Nigeria Australia UK UK Indonesia
8 China Canada Malaysia Italy Malaysia
9 Poland France Germany Germany Netherlands
10 Portugal Algeria China Ukraine USA
11 El Salvador South Africa Nigeria Netherlands Australia
12 Kenya Kazakhstan Greece Mexico Nigeria
13 Belgium Qatar Turkey China Saudi Arabia
14 Guatemala Saudi Arabia Kenya India U. Arab Emir.
15 Germany U. Arab Emir. Netherlands Hungary Trinidad and Tobago
16 Mexico Belgium Rep. of Korea Czech Rep. Germany
17 Ecuador Pakistan Spain Canada Oman
18 Malaysia Singapore Russian Fed. Brazil Egypt
19 South Africa Netherlands India Turkey UK
20 Slovenia Italy Japan Thailand TurkmenistanA-165
TABLE IV
Top 20 ranking for barley — 2008.
Ran K K∗ K2 K̃ K̃ ∗
1 Saudi Arabia France USA Saudi Arabia Ukraine
2 Yemen Canada Germany Germany France
3 Germany USA Netherlands Japan Australia
4 U. Arab Emir. Australia Denmark China Canada
5 USA Germany Italy Belgium Germany
6 Israel Ukraine Belgium Netherlands Russian Fed.
7 Japan Rep. of Moldova China Syria Argentina
8 Netherlands UK U. Arab Emir. Iran USA
9 Oman Argentina UK Jordan Denmark
10 Greece Spain Spain USA Kazakhstan
11 Italy Denmark Singapore Denmark Romania
12 Croatia Kazakhstan Rep. of Korea Italy UK
13 Syria Netherlands Malaysia Tunisia Hungary
14 Kuwait Russian Fed. Russian Fed. Israel Spain
15 Cyprus India Austria Colombia Bulgaria
16 Denmark Hungary Poland Algeria Netherlands
17 Occ. Palestinian Terr. Romania Brazil Kuwait Lithuania
18 Switzerland Belgium Ireland Brazil Sweden
19 Bosnia Herzegovina Lithuania France Morocco Belgium
20 Jordan Sweden South Africa Turkey India
TABLE V
Top 20 ranking for cars — 2008.
Ran K K∗ K2 K̃ K̃ ∗
1 Nigeria Germany Germany USA Germany
2 Germany Japan USA Germany Japan
3 France USA France UK USA
4 USA Rep. of Korea UK France Canada
5 Russian Fed. France Belgium Italy Rep. of Korea
6 UK UK Spain Russian Fed. UK
7 Belgium Belgium Italy Belgium France
8 Ukraine Spain Japan Canada Spain
9 Italy South Africa Australia Spain Belgium
10 Greece Thailand Canada China Mexico
11 Venezuela Mexico China Netherlands Italy
12 Spain Italy Netherlands Australia Slovakia
13 China Canada U. Arab Emir. U. Arab Emir. Czech Rep.
14 Netherlands U. Arab Emir. Austria Saudi Arabia Poland
15 Australia Czech Rep. South Africa Austria Sweden
16 Japan Slovakia Poland Mexico Turkey
17 Albania Hungary Thailand Poland Hungary
18 Romania Australia Russian Fed. Switzerland Austria
19 Sudan Austria Turkey Finland Thailand
20 Canada China Portugal Ukraine South AfricaA-166 L. Ermann, D.L. Shepelyansky
Fig. 5. Time evolution of the number of countries
(N , full black curve), average number of links per coun-
try (hNL i) for all commodities (dashed curve) and crude
petroleumP (points for five years), total amount of money
(MT = i,j Mij , red curve). The scale of N and hNL i
is shown on left side, while MT values, in $ USD, are
given in logarithmic scale on the right side.
Fig. 6. Money mass transfer matrix elements Mi,j are
bution is even more broad showing definite absence of shown versus their transposed values Mj,i for all com-
symmetry of Mij . In fact for all commodities the dis- modities of WTN in 1962 (top left part) and 2008 (top
tribution forms a rather broad cone whose form remains right part). Bottom left part shows the matrix elements
stable in time according to the comparison of data in for crude petroleum of WTN in 2008; bottom right part
1962 and 2008 years (the density is higher in the later shows the same quantities for random matrix model
of WTN. Four parts show 5 orders of magnitude in loga-
case since there are more countries). Keeping in mind
rithmic scales starting from maximum values of Mij . In
that according to data of Fig. 2 we have the Zipf law the case of WTN (top and bottom left parts) matrix el-
for P̃ (K̃) we propose the random matrix model of WTN ements are taken from the UN COMTRADE database
(RMWTN) with the mass matrix elements given by and are expressed in USD, right bottom part is built
from one random realization with Mij = ²i ²j /ij (see
Mij = ²i ²j /ij, (3) text). Here N = 164 for 1962 data; N = 227 for 2008
where ²i are random numbers homogeneously distributed data and RMWTN.
in [0, 1] interval and i, j are indexes in the ImportRank
index K̃. The distribution given by this simple model
reproduces quite well the actual distribution found for top ranks (K +K ∗ < N ). For countries with K +K ∗ > N
all commodities (see right parts in Fig. 6). With this the RMWTN model does not succeed to describe cor-
RMWTN distribution of Mij we construct the Google rectly the upper part of spindle distribution found for the
matrices G and G∗ according to the usual recipes (1) WTN and hence further improvements of the RMWTN
and then determine the distribution of points in (K, K ∗ ) are needed. However, a simple description of the distri-
plane. bution for a half top countries is rather successful.
To have a statistical comparison between the RMWTN A remarkable feature of the WTN spindle distribution
and real WTN data we construct the density distribu- of Fig. 7 (top right) is the appearance of high density
tion of countries in the plane (K ∗ − K, K ∗ + K) using domains at K ∗ − K ≈ 0 with K + K ∗ ≈ 1 and K +
all available years 1962–2009 at the UN COMTRADE K ∗ ≈ 2N . They give an impression of two solid phases
database for all commodities. The coarse-grained distri- emerging in these two regions while the other part looks
bution of about 104 WTN data points is shown in Fig. 7. like a gas phase. This view gets additional confirmation
We present the data directly in (K ∗ − K, K ∗ + K) plane by data of Fig. 8 where we present the velocity square
(top left part) and in rescaled variables ((K ∗ − K)/N , (∆v)2 , averaged over the whole period 1962–2009, as a
(K ∗ + K)/N ) plane, which takes into account that the function of K + K ∗ . This local quantity is defined as
number of countries grown by 38% during this time pe- (∆v)2 = [K(t) − K(t − 1)]2 + [K ∗ (t) − K ∗ (t − 1)]2 via a
riod. The distribution has a form of spindle with maxi- one year displacement of a given country in (K, K ∗ ) plane
mum density at the vertical axis K ∗ −K = 0. We remind with further averaging over all times and all countries.
that good exporters are on the left side of this axis at These data clearly show that for K + K ∗ ≤ 20 we have
K ∗ − K < 0, while the good importers (bad exporters) very small square velocity (small effective temperature)
are on the right side at K ∗ − K > 0. corresponding to a solid phase of rich countries, while
The comparison of WTN data with the results pro- for K + K ∗ > 20 we have large square velocity (large
duced by RMWTN model (3) are shown in bottom parts effective temperature) corresponding to a gas phase with
of Fig. 7: there is a good agreement between both with- rapid rank fluctuations. There is a similar visible drop
out any fit parameters for the half of all countries with of temperature at another limit of most poor countriesGoogle Matrix of the World Trade Network A-167
Fig. 8. Top part shows velocity square ∆v 2 as a func-
tion of K + K ∗ for all countries and all years (all com-
modities data). Gray circles represent all values of ∆v 2 ,
Fig. 7. Spindle distribution for WTN of all commodi- red curve shows the value of ∆v 2 averaged over cases
ties for all countries in the period 1962–2009 shown in with fixed K + K ∗ , blue curve shows the average of the
the plane of (K ∗ − K, K ∗ + K) (left top part, coarse- red curve data in the interval [K +K ∗ −10, K +K ∗ +10].
-grained data in 3 × 3 cell size) and in the rescaled plane In the bottom part the number of cases ρ(K + K ∗ ) at
((K ∗ − K)/N , (K ∗ + K)/N ) (right top part, coarse- a given K + K ∗ is shown as a function of K + K ∗ .
-graining inside each of 76 × 152 cells, which is ap-
proximately the same number as in top left part); data
from the UN COMTRADE database. Bottom left part:
zoom of top right part; bottom right part: data from
100 realisations of RMWTN model (3) with N = 227 as
for WTN size in 2008.
with K + K ∗ ≈ 2N which indicates a formation of solid
phase of poor countries (the data are not so exact for this
region due to variation of number of UN countries with
time).
The presence of solid phase of rich countries and gas
phase of other countries is also visible from analysis of
rank variation in time for individual countries shown in
Fig. 9: for K, K ∗ ≤ 10 the curves are almost flat while
for K, K ∗ > 10 we see strong fluctuation of curves. It
is interesting to note that sharp increases in K mark
crises in 1991, 1998 for Russia and in 2001 for Argentina
(import is reduced in period of crises). We also see that
in recent years the solid phase is perturbed by entrance of
new countries like China and India. However, the results
presented in Fig. 10 for the variation of square velocity
with time for three regions of K + K ∗ show that the top
10, and even top 20, countries have rather small velocities Fig. 9. Time evolution of CheiRank and PageRank in-
∆v 2 , compared to those with (K +K ∗ )/2 ≈ K > 20. For dexes K, K ∗ for some selected countries for all com-
K ≤ 20 we have ∆v 2 which remains constant in time. modities. The countries shown in top parts are: Japan
In a certain sense it looks that the countries with 20 < (jp — black), France (fr — red), Fed. Rep. of Germany
K < 40 protect those with 1 ≤ K ≤ 20 (approximately before unification and Germany after unification (de —
both in blue), Great Britain (gb — green), USA (us —
corresponding to G-20 major economies [32]), so that orange) [curves order goes from top to bottom in left top
their temperature at 1 ≤ K ≤ 20 remains unaffected part at year 1962]. The countries shown in bottom parts
even by a very larger fluctuation well visible for the range are: Argentina (ar — violet), India (in — dark green),
81 ≤ K + K ∗ ≤ 120 during the period of 1992–1998 with China (cn — cyan), USSR and Russian Fed. (ru — both
a few financial crises of Black Wednesday, Mexico crisis, in gray) [curves order goes from top to bottom in left
Asian crisis and Russian crisis. bottom part at year 1975].A-168 L. Ermann, D.L. Shepelyansky
Fig. 11. Time evolution of correlators of PageRank–
CheiRank (κ) and ImportRank–ExportRank (κ̃). All
commodities are shown by solid red curve for κ̃, and
solid black curve and dashed blue curve for κ with α =
Fig. 10. Time evolution of velocity square ∆v 2 for all 0.5 and α = 0.85, respectively. Correlators for crude
commodities averaged over five years interval. In addi- petroleum with 10 years of separation are shown in red
tion ∆v 2 is averaged over countries in the following in- squares for κ̃ and black circles for κ.
tervals: 1 ≤ K +K ∗ ≤ 40 (black curve), 41 ≤ K +K ∗ ≤
80 (red curve), 81 ≤ K + K ∗ ≤ 120 (blue curve) in top
part; 1 ≤ K +K ∗ ≤ 20 (black curve), 21 ≤ K +K ∗ ≤ 40 aim we present the distribution of country positions on
(red curve), 41 ≤ K + K ∗ ≤ 60 (blue curve) in bottom the planes (K̃, K) and (K˜∗ , K ∗ ) shown for top 100 for
part. the same commodities as in Fig. 4 for year 2008. For all
commodities there is a clear correlation between Page-
Rank and ImportRank since the distribution of points is
The presented results for distribution of countries and centered along the diagonal K = K̃. It starts to spread
analysis of their time evolution in the PageRank–Chei- only around K ≈ K̃ ≈ 30. At the same time for Chei-
Rank plane confirm a well known statement that “the Rank and ExportRank such a spreading from diagonal
poor stay poor and the rich stay rich”. starts significantly earlier at K˜∗ ≈ K ∗ ≈ 10.
Finally let us discuss an additional parameter which For other commodities shown in Fig. 12 the correla-
characterizes the correlation between PageRank and tions between ranking based on Google matrix and cor-
CheiRank vectors. The correlator between PageRank responding export or/and import ranking are practically
and CheiRank is defined as absent showing very broad scattering of points around
X
κ=N P (K(i))P ∗ (K ∗ (i)) − 1, (4) almost the whole plane. Only for cars there is a certain
i level of correlation for approximately the first 10 ranks.
and in a similar way the correlator between ImportRank Natural products like crude petroleum, natural gas and
and ExportRank is given by agriculture products like barley show no correlations.
X The similar conclusions can be also drawn from the
κ̃ = N P̃ (K̃(i))P̃ ∗ (K̃ ∗ (i)) − 1. (5) comparison of country distributions in the plane (K, K ∗ )
i (Fig. 4) and in the plane (K̃, K̃ ∗ ) (Fig. 13), which show
Recently it has been found that there are networks with data on the same scales. Clearly, the distributions are
small correlator, like PCN Linux [11], and large corre- rather different and only for all commodities we can see
lator, as Wikipedia [12]. Here we find that for all com- visible correlations (we note that appearance of ordered
modities we have large values of κ and κ̃, which have short line segments in parts (c, g) around K ≈ K̃ ≈ 200
rather similar dependence on time (see Fig. 11). In con- is due to degeneracy of P and P̃ values, for those coun-
trast, there are almost zero or even negative correlations tries which e.g. do not use barley, and thus their ordering
for crude petroleum. Indeed, for crude petroleum there becomes somewhat arbitrary).
is no correlation between export and import while for all Let us discuss in more detail few concrete examples
commodities they are strongly correlated. shown in Tables I–V. For all commodities first 5 posi-
tions are very close in both ways of ranking. As a signifi-
4. Comparison with import–export ranking cant change we note Canada which moves from K̃ ∗ = 11
down to K ∗ = 16 and Mexico with respective change
It is important to compare rating based on PageRank from K̃ ∗ = 13 to K ∗ > 20: the export of these two
and CheiRank with the usual way of country rating based countries is too strongly oriented on USA that becomes
on ImportRank and ExportRank (see e.g [2]). With this directly visible through CheiRank analysis. In contrastGoogle Matrix of the World Trade Network A-169
Fig. 12. Comparison of ranking between PageRank K Fig. 13. Country positions in the ImportRank–
and ImportRank K̃ (left column), and between Chei- ExportRank plane (K̃, K̃ ∗ ) for year 2008. The shown
Rank K ∗ and ExportRank K̃ ∗ (right column) for year commodities are: all commodities (parts a, b); crude
2008. The shown commodities are: all commodities petroleum (part c, d); natural gas (part e, f); barley
(parts a, b); crude petroleum (parts c, d); natural gas (part g, h); cars in (i) and (j). Left column shows a
(parts e, f); barley (parts g, h); cars (parts i, j). Only global scale (227 countries) while right column illus-
top 100 ranks are shown. trates the first 40 × 40 region. Data can be compared
with those in Fig. 4.
Singapore moves up from K̃ ∗ = 15 to K ∗ = 11 that shows
the stability and broadness of its export trade, a similar usual fact that Kazakhstan is practically the only coun-
situation appears for India moving up from K̃ ∗ = 19 to try which sells crude petroleum to the CheiRank leader
K ∗ = 12. in this product Russia. This puts Kazakhstan on the sec-
Even more strong changes of ranking appear for spe- ond position. It is clear that such direction of trade is
cific commodities. For example for crude petroleum Rus- more of political or geographical origin and is not based
sia moves up from K̃ ∗ = 2 to K ∗ = 1 showing that its on economic reasons.
trade network in this product is better and broader than For natural gas there are also significant differences
the one of Saudi Arabia. Iran moves in opposite direction between two ways of ranking. Thus, USA moves strongly
from K̃ ∗ = 5 down to K ∗ = 14 showing that its trade up from K̃ ∗ = 10 to K ∗ = 1 due its broad trade network
network is restricted to a small number of nearby coun- in this product. Canada moves down from K̃ ∗ = 2 to
tries. A significant improvement of ranking takes place K ∗ = 8 due to its too strong trade orientation on USA.
for Kazakhstan moving up from K̃ ∗ = 12 to K ∗ = 2. A small country Trinidad and Tobago moves up from
The direct analysis shows that this happens due to an un- K̃ ∗ = 15 to K ∗ = 2 since it provides about 70% of importA-170 L. Ermann, D.L. Shepelyansky
of top leader USA. exchange between a country and the rest of the world
Significant reordering appears also for barley trade. while PageRank-CheiRank approach takes into account
Thus, the leader Ukraine moves down from K̃ ∗ = 1 all links and money flows between all countries. We hope
to K ∗ = 6 due to too narrow trade network and USA that this new approach based on the Google matrix will
moves up from K̃ ∗ = 8 to K ∗ = 3 due to its broad trade find further useful applications to investigation of various
network. flows in trade and economy.
For trade of cars we have France going up from K̃ ∗ = Finally we would like to note that the matrices of the
7 to K ∗ = 3 due to its broad export network. Also type analyzed here naturally appear in the frame of the
Thailand goes strongly up from K̃ ∗ = 19 to K ∗ = 10 Ulam method [33] applied to the systems with dynamical
due to its broad trade links. We note that on the side of chaos [28–30]. We hope that an exchange of ideas be-
import we have strong change for Nigeria which moves tween these research areas will bring new useful insights
from K̃ > 20 up to K = 1. This is the most populated in future.
country in Africa with a strong income due to oil trade
which provides a large fraction of USA import. With Acknowledgments
such oil income Nigeria buys cars from all over the world
and thus becomes at the top of PageRank. We thank Gilles Saint-Paul (TSE, Toulouse) for useful
Finally we note that among top 20 countries ranked discussions on economics and Olga Chepelianskaia (UN
in 2DRank K2 by all commodities in 2008 (see Table I) Bangkok) for insights on UN databases. Our special
there are 14 among G-20 major economies [32]. At the thanks are addressed to Arlene Adriano and Matthias
same time ExportRank gives 13, and ImportRank gives Reister (United Nations Statistics Division) for pro-
14 countries from 19 of G-20-list. We attribute a differ- vided help and friendly access to the UN COMTRADE
ence in 5 countries to political and geographical aspects database [13]. We thank participants of 5th Workshop
of G-20-selection. on Quantum Chaos and Localisation Phenomena, May
20–22, 2011, IFPAN, Warsaw, Poland for useful discus-
5. Discussion sions of this work presented at the Workshop. After the
submission this work has been reported at 14th Annual
In this work we constructed the Google matrix of the Research Conference of De Nederlandsche Bank “Com-
WTN using the enormous UN COMTRADE database. plex systems: Towards a better understanding of finan-
From this matrix we obtained PageRank and CheiRank cial stability and crises”, Amsterdam, November 3–4,
of all world countries in various types of trade products 2011.
for years 1962–2009. This new approach gives a demo-
cratic type of ranking being independent of the trade References
amount of a given country. In this way rich and poor
countries are treated on equal democratic grounds. In a [1] P.R. Krugman, M. Obstfeld, M. Melitz, International
certain sense PageRank probability for a given country Economics: Theory & Policy, Prentice Hall, New Jer-
is proportional to its rescaled import flows while Chei- sey 2011.
Rank is proportional to its rescaled export flows inside [2] Central Intelligence Agency, The CIA World Factbook
of the WTN. 2010, Skyhorse Publ. Inc., New York 2009.
The global characteristics of the world trade are ana- [3] S. Brin, L. Page, Computer Networks ISDN Syst. 30,
lyzed on the basis of this new type of ranking. Even if all 107 (1998).
countries are treated now on equal democratic grounds [4] A.M. Langville, C.D. Meyer, Google’s PageRank and
still we find at the top rank the group of industrially de- Beyond: The Science of Search Engine Rankings,
Princeton University Press, Princeton 2006.
veloped countries approximately corresponding to G-20.
We recover 74% of countries listed in G-20. Our stud- [5] N. Litvak, W.R.W. Scheinhardt, Y. Volkovich, Lec-
ture Notes Comput. Sci. 4936, 72 (2008).
ies establish the existence of two solid state domains of
rich and poor countries which remain stable during the [6] D. Donato, L. Laura, S. Leonardi, S. Millozzi, Eur.
Phys. J. B 38, 239 (2004).
years of consideration. Other countries correspond to a
gas phase with ranking strongly fluctuating in time. We [7] G. Pandurangan, P. Raghavan, E. Upfal, Internet
Math. 3, 1 (2005).
propose a simple random matrix model which well de-
scribes the statistical properties of rank distribution for [8] S. Redner, Physics Today 58, 49 (2005).
the WTN. [9] F. Radicchi, S. Fortunato, B. Markines, A. Vespig-
The comparison between usual ImportRank–Export- nani, Phys. Rev. E 80, 056103 (2009).
Rank (see e.g. [2]) and our PageRank–CheiRank ap- [10] J. West, T. Bergstrom, C.T. Bergstrom,
proach shows that the later highlights the trade flows in a arXiv:0911.1807, to appear in J. Am. Soc. Info.
Sci. Tech. (2011); http://eigenfactor.org/ .
new useful manner which is complementary to the usual
analysis. The important difference between these two ap- [11] A.D. Chepelianskii, Towards Physical Laws for
Software Architecture, arXiv:1003.5455[cs.SE]
proaches is due to the fact that ImportRank–ExportRank (2010); http://www.quantware.ups-tlse.fr/
method takes into account only global amount of money QWLIB/linuxnetwork/ .Google Matrix of the World Trade Network A-171
[12] A.O. Zhirov. O.V. Zhirov, D.L. Shepel- [23] T. Squartini, G. Fagiolo, D. Garlaschelli, Rewiring
yansky, Eur. Phys. J. B 77, 523 (2010); World Trade. Part II. A Weighted Network Analysis,
http://www.quantware.ups-tlse.fr/QWLIB/ arXiv:1103.1249[physics.soc-ph] (2011).
2drankwikipedia/ . [24] http://www.quantware.ups-tlse.fr/QWLIB/
[13] United Nations Commodity Trade Statistics tradecheirank/ .
Database http://comtrade.un.org/db/ . [25] G.K. Zipf, Human Behavior and the Principle of Least
[14] P.B. Slater, Sov. Geography Rev. Trans. 16, 453 Effort, Addison-Wesley, Boston 1949.
(1975). [26] K. Avrachenkov, N. Litvak, K. Pham, Internet Math.
[15] P.B. Slater, IEEE Trans. Sys. Man Cyber. 5, 278 5, 47 (2005).
(1975). [27] B. Georgeot, O. Giraud, D.L. Shepelyansky, Phys.
[16] D. Garlaschelli, M.I. Loffredo, Physica A, Stat. Mech. Rev. E 81, 056109 (2010).
Appl. 355, 138 (2005). [28] D.L. Shepelyansky, O.V. Zhirov, Phys. Rev. E 81,
[17] M.A. Serrano, M. Boguna, A. Vespignani, J. Econ. 036213 (2010).
Interac. Coor. 2, 111 (2007). [29] L. Ermann, D.L. Shepelyansky, Phys. Rev. E 81,
[18] L. De Benedictis, L. Tajoli, The World Trade 036221 (2010).
Network, working paper (2009); available at [30] L. Ermann, D.L. Shepelyansky, Eur. Phys. J. B 75,
http://www.eief.it/files/2010/10/luca-de- 299 (2010).
-benedictis.pdf . [31] L. Ermann, A.D. Chepelianskii, D.L. Shepelyansky,
[19] G. Fagiolo, J. Reyes, S. Schiavo, Phys. Rev. E 79, Eur. Phys. J. B 79, 115 (2011).
036115 (2009).
[32] Wikipedia contributors, G-20 Major Economies,
[20] J. He, M.W. Deem, Phys. Rev. Lett. 105, 198701 Wikipedia, The Free Encyclopedia, Web. 25 Mar.
(2010). 2011.
[21] G. Fagiolo, J. Reyes, S. Schiavo, J. Evol. Econ. 20, [33] S.M. Ulam, A Collection of Mathematical Problems,
479 (2010). Vol. 8 of Interscience tracs in pure and applied math-
[22] M. Barigozzi, G. Fagiolo, D. Garlaschelli, Phys. ematics, Interscience, New York 1960, p. 73.
Rev. E 81, 046104 (2010).You can also read