West Coast Trade Report - Pacific ...
←
→
Page content transcription
If your browser does not render page correctly, please read the page content below
West Coast Trade Report
                                                                                                                January 2021

A First Glimpse at December’s TEU Counts
Note: The ports we survey take anywhere from a few days          the 1.91 million TEUs (+11.0%) the Global Port Tracker
to a few weeks to report their container trade statistics. The   had estimated just a month earlier. And that, in turn,
Port of Oakland is normally the first to post these numbers,     was certainly much more upbeat than the 1.7 million
while the Port of New York/New Jersey is nearly always           TEU (-8.2%) fall-off the same forecaster had foreseen for
the last. For example, in what we can only hope might be         December in its November 9 report.
a foreshadowing of this year’s American League pennant
race, both the Ports of Oakland and [attention: Yankees fans]    Several ports have already announced their December
Boston posted their December TEU numbers by January              container tallies. The Port of Long Beach reported that
11, the very same day PNYNJ released its November tallies.       inbound loaded TEUs in the year’s final month totaled a
Still, because West Coast ports are generally much quicker       record 406,072, a 25.6% jump over the last month of 2019.
in releasing their monthly TEU tallies than their rival ports    That was also a 6.1% increase over November, indicating
elsewhere in the country, these “First Glimpse” numbers are      no relief for that port from the second-half wave of
necessarily incomplete and may give a misleading indication      containerized imports through the port.
of the latest trends.                                            Things were a bit different next door as business
In a January 8 press release, the National Retail                continued to slacken at the Port of Los Angeles. Although
Federation’s Global Port Tracker estimated that 2.02             inbound loads in December (460,865 TEUs) were up by
million TEUs of imported merchandise arrived at U.S.             23.5% year-over-year, import traffic was down 0.9% from
ports in December. That would represent a 17.3% year-            November’s 464,820 volume, which in turn was down from
over-year gain, a decidedly more optimistic outlook than         October’s 506,613 TEUs. Indeed, the year’s peak month of

                                                                                            Photo courtesy of The Port of Oakland
Pacific Merchant Shipping Association
70 Washington Street, Suite 305, Oakland, CA 94607
                                                                                                    pmsaship.com
510-987-5000 info@pmsaship.com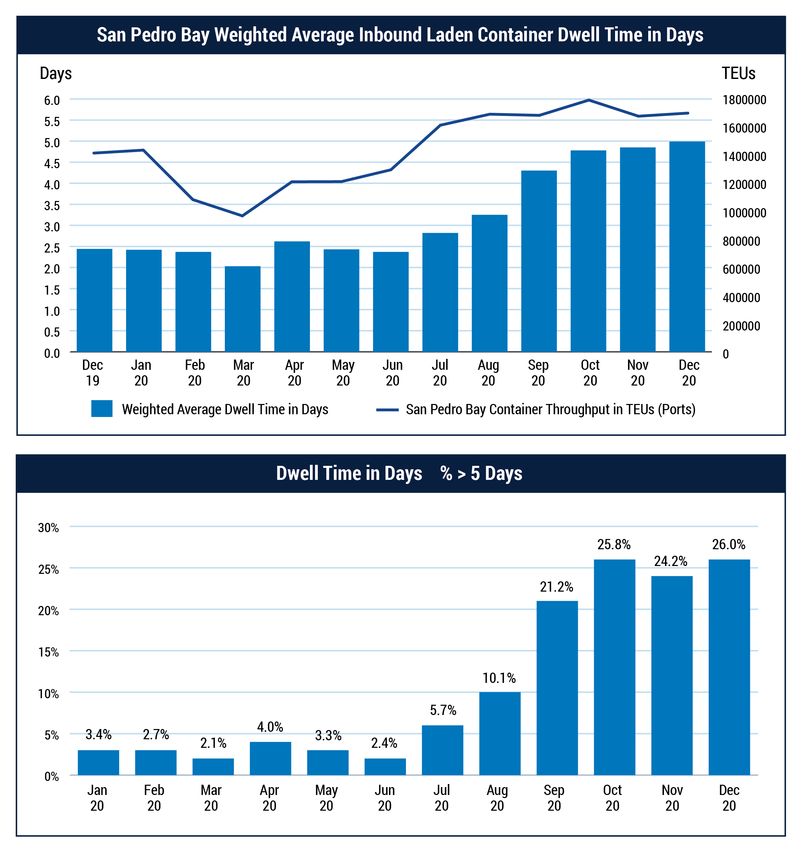
West Coast Trade Report

A First Glimpse at December’s TEU Counts Continued

import traffic at LA came in August, when 516,286 loaded       by Valentine’s Day. One unofficial estimate, however,
TEUs were discharged at the port.                              credits PNYNJ with a 22.6% year-over-year boost in
                                                               inbound loads. Elsewhere, Savannah saw a remarkable
Elsewhere along the U.S. West Coast, the Northwest
                                                               30.5% jump in inbound loads from a year earlier, while
Seaport Alliance ports (Seattle and Tacoma) imported
                                                               Virginia (+18.8%), and Charleston (+14.4%) also reported
122,469 laden TEUs, up 15.7% from a year earlier. That
                                                               strong year-over-year gains in 2020’s final month. The
was a 4.5% improvement over November and nearly
                                                               same was true of Houston, which reported a 26.4%
equaled the ports’ busiest month (September) this year
                                                               increase in inbound loaded TEUs over last December.
for import loads. Oakland, meanwhile, posted an 11.0%
year-over-year increase in inbound loads in December. The      Export numbers along the USWC in December were down
San Francisco Bay Area port also recorded a 6.1% bump          by 3.5% (-14,317 TEUs) from a year earlier. Long Beach
over November, a month in which Oakland’s import trade         did post a 5.6% year-over-year gain, but that was more
suffered from congestion at the Southern California ports.     than offset by a 7.7% drop at Los Angeles, leaving the San
Some ships that were due to call at Oakland in November        Pedro Bay ports 1.2% (-2,985 TEUs) shy of the previous
did not arrive until December. And some ships simply           December’s export tally. Oakland recorded a modest 0.9%
skipped Oakland entirely and just sailed back to Asia from     (+687 TEUs) gain in loaded export containers, but export
San Pedro Bay.                                                 shipments from the two NWSA ports plunged by 15.8%
                                                               (-12,019 TEUs).
Altogether, the five major U.S. West Coast container ports
saw a 22.2% (+195,780 TEUs) increase in inbound loads          December export numbers elsewhere were mixed.
from December 2019. The December 2020 volume was               Outbound loads from Houston were down 8.7% (-9,494
also 3.5% (+36,933 TEUs) over the volume in the previous       TEUs) from a year earlier, while the two British Columbia
month.                                                         ports were up by 2.6% (+2,718 TEUs). Charleston (+8.6%
                                                               or +5,336 TEUs) and Virginia (+5.6% or +4,385 TEUs) have
At least statistically, the two ports In British Columbia we
                                                               reported impressive gains in exports from December
track went different ways in December. Inbound loads
                                                               2019.
leapt by 19.1% at Vancouver but slipped by 4.3% at Prince
Rupert, leaving the two with a combined 12.0% year-over-       Although inbound container loads in December were
year increase.                                                 way up nationally from a year earlier, the November to
                                                               December increase looks to be very slender.
Back East, the Port of New York/New Jersey rang up a…
Frankly, we probably won’t know how many TEUs PNYNJ
handled in December until sometime next month, maybe

                                                                                        Photo courtesy of The Port of Everglades

                                                                                                January 2021           Page 2
West Coast Trade Report

Parsing the November 2020 TEU Numbers
Please note: The numbers here are not
                                           Exhibit 1        November 2020 - Inbound Loaded TEUs at Selected Ports
derived from forecasting algorithms or
the partial information available from                        Nov 2020     Nov 2019       %      Nov 2020       Nov 2019       %
U.S. Customs and Border Protection but                                                  Change     YTD            YTD        Change
instead represent the actual TEU counts
as reported by the major North American   Los Angeles           464,820      371,350     25.2%    4,366,175      4,340,755      0.6%

seaports we survey each month. The U.S.   Long Beach            382,677      293,287     30.5%    3,592,268      3,435,207      4.6%
mainland ports we monitor collectively
handle over 90% of the container          San Pedro Bay
                                                                847,497      664,637     27.5%    7,958,443      7,775,962      2.3%
                                          Totals
movements at continental U.S. ports.
                                          Oakland                 78,045      77,350      0.9%     905,764         893,900      1.3%
November 2020 Import Traffic
Inbound loads through the five major      NWSA                  117,151       94,978     23.3%    1,131,349      1,263,428    -10.5%
U.S. West Coast ports saw a 24.6%
                                          USWC Totals          1,042,693     836,965     24.6%    9,995,556      9,933,290      0.6%
(+205,728 TEUs) year-over-year jump
in November. Altogether, the five         Boston                  10,461      11,538     -9.3%     124,984         138,196     -9.6%
maritime gateways handled 1,042,693
                                          NYNJ                  382,912      301,123     27.2%    3,562,361      3,482,007      2.3%
inbound loaded TEUs, down 6.1% from
the 1,110,345 inbound loads the same      Maryland                47,148      38,940     21.1%     478,291         482,847     -0.9%
ports had handled a month earlier
                                          Virginia              125,214      103,410     21.1%    1,193,758      1,262,673     -5.6%
in October. The Port of Los Angeles
recorded a 25.2% year-over-year leap      South Carolina          93,369      82,785     12.8%     939,433         984,535     -4.6%
(+93,470 TEUs), while the neighboring
                                          Georgia               234,583      173,863     34.9%    2,081,974      2,046,532      1.7%
Port of Long Beach posted a 30.5%
(+89,390 TEUs) gain. Together, the two    Jaxport                 27,027      27,390     -1.3%     289,730         325,383    -11.0%
San Pedro Bay ports handled 27.5%
                                          Port Everglades         26,280      26,959     -2.5%     271,767         290,054     -6.3%
(+182,860 TEUs) more inbound loads
than they had a year earlier. Up in the   Miami                   45,816      37,763     21.3%     396,239         405,593     -2.3%
San Francisco Bay Area, the Port of
Oakland reported a more modest 0.9%       USEC Totals*          992,810      803,771     23.5%    9,338,537      9,417,820     -0.8%

(+695 TEUs) increase from November        New Orleans             10,921      10,155      7.5%     126,094         125,470      0.5%
2019, owing largely to a disruption
in shipping schedules caused by           Houston               122,475      101,494     20.7%    1,167,929      1,144,516      2.0%
congestion at the San Pedro Bay ports.    USGC Totals           133,396      111,649     19.5%    1,294,023      1,269,986      1.9%
Meanwhile, the Northwest Seaport
Alliance ports (Seattle and Tacoma)       Vancouver             162,436      123,918     31.1%    1,630,117      1,568,840      3.9%
saw inbound loads soar by 23.3%           Prince Rupert           51,272      58,181    -11.9%     584,434         616,903     -5.3%
(+22,173 TEUs) over the same month a
year earlier.                             BC Totals             213,708      182,099     17.4%    2,214,551      2,185,743      1.3%

Across the border in British Columbia,    US/BC Totals         2,187,411    1,762,156    24.1%   20,805,554     20,649,511      0.8%
Vancouver posted another astonishing
                                          US Total             2,168,899    1,752,385    23.8%   20,628,116     20,621,096     0.03%
bump in inbound loads in November.
However, it was a different story at      USWC/BC              1,256,401   1,019,064      9.8%   12,210,107    12,119,033      -4.1%
Prince Rupert which saw inbound loads                                                                         Source Individual Ports
decline by 11.9% (-6,909 TEUs).

                                                                                                     January 2021             Page 3
West Coast Trade Report
Parsing the November 2020 TEU Numbers Continued
Exhibit 2 November 2020 - Outbound Loaded TEUs at Exhibit 3 November Year-to-Date
Selected Ports Total TEUs (Loaded and
Empty) Handled at Selected
Nov 2020 Nov 2019 % Nov 2020 Nov 2019 %
Ports
Change YTD YTD Change
Los Angeles 130,916 138,544 -5.5% 1,411,141 1,625,948 -13.2% Los Angeles -3.0%
Long Beach 117,283 123,705 -5.2% 1,343,514 1,347,409 -0.3% Long Beach 4.7%
San Pedro Bay NYNJ -0.1%
248,199 262,249 -5.4% 2,754,655 2,973,357 -7.4%
Totals
Georgia -0.1%
Oakland 79,667 81,780 -2.6% 852,380 856,376 -0.5%
Vancouver 0.6%
NWSA 72,746 73,589 -1.1% 726,771 837,465 -13.2%
NWSA -13.5%
USWC Totals 400,612 417,618 -4.1% 4,333,806 4,667,198 -7.1%
Houston -0.4%
Boston 6,298 6,128 2.8% 71,922 75,856 -5.2%
Manzanillo -5.8%
NYNJ 118,762 119,422 -0.6% 1,217,152 1,349,679 -9.8%
Virginia -5.9%
Maryland 21,032 20,254 3.8% 204,354 215,100 -5.0%
Virginia 89,032 77,241 15.3% 858,014 887,839 -3.4% Oakland -2.3%
South Carolina 64,447 62,831 2.6% 707,572 755,059 -6.3% S. Carolina -6.6%
Georgia 113,357 119,126 -4.8% 1,309,097 1,359,049 -3.7% Montreal -8.8%
Jaxport 43,814 44,440 -1.4% 467,399 459,136 1.8% -4.5%
Jax Port
Port Everglades 31,476 39,664 -20.6% 311,276 395,427 -21.3% -6.6%
Prince Rupert
Miami 25,633 35,774 -28.3% 316,216 381,432 -17.1%
Miami -7.5%
USEC Totals* 513,851 524,880 -2.1% 5,463,002 5,878,577 -7.1%
L Cardenas -21.8%
New Orleans 22,464 23,600 -4.8% 255,451 275,207 -7.2%
Maryland -3.0%
Houston 102,755 107,927 -4.8% 1,124,005 1,155,948 -2.8%
Everglades -9.4%
USGC Totals 125,219 131,527 -4.8% 1,379,456 1,431,155 -3.6%
Philadelphia 6.3%
Vancouver 82,062 91,707 -10.5% 954,878 1,035,082 -7.7%
New Orleans -11.1%
Prince Rupert 12,949 15,250 -15.1% 174,879 174,724 0.1%
Boston -12.3%
British Columbia
95,011 106,957 -11.2% 1,129,757 1,209,806 -6.6%
Totals 0 2000000 4000000 6000000 8000000 10000000
2,000,000
4,000,000
6,000,000
8,000,000
10,000,000
US/Canada Total 1,134,693 1,180,982 -3.9% 12,306,021 13,186,736 -6.7%
US Total 1,039,682 1,074,025 -3.3% 11,176,264 11,976,930 -6.7% 2020 YTD
USWC/BC 495,623 524,575 -5.7% 5,463,563 5,877,004 -7.0% 2019 YTD
Source: Individual Ports
Source Individual Ports
January 2021 Page 4West Coast Trade Report
Parsing the November 2020 TEU Numbers Continued
Exhibit 4 USWC Ports Shares of Worldwide U.S. Exhibit 5 USWC Ports Shares of U.S. Mainland
Mainland, November 2020 Trade With East Asia, November 2020
Nov 2020 Oct 2020 Nov 2019 Nov 2020 Oct 2020 Nov 2019
Shares of U.S. Mainland Ports Containerized Import Tonnage Shares of U.S. Mainland Ports’ East Asian Container Import Tonnage
LA/LB 28.7% 29.2% 27.2% LA/LB 45.1% 45.9% 44.0%
Oakland 3.4% 3.5% 3.9% Oakland 3.7% 3.8% 4.5%
NWSA 4.7% 4.5% 5.1% NWSA 6.7% 6.7% 7.7%
Shares of U.S. Mainland Ports Containerized Import Value Shares of U.S. Mainland Ports’ East Asian Container Import Value
LA/LB 35.1% 36.1% 34.6% LA/LB 51.0% 51.7% 51.4%
Oakland 3.2% 3.3% 3.6% Oakland 3.8% 3.9% 4.3%
NWSA 6.3% 6.2% 6.9% NWSA 9.0% 8.7% 10.0%
Shares of U.S. Mainland Containerized Export Tonnage Shares of U.S. Mainland Ports’ East Asian Container Export Tonnage
LA/LB 21.6% 21.4% 20.1% LA/LB 33.7% 35.6% 35.0%
Oakland 6.9% 7.1% 6.6% Oakland 8.2% 8.7% 9.3%
NWSA 7.8% 7.6% 8.5% NWSA 11.5% 12.1% 14.6%
Shares of U.S. Mainland Conatainerized Export Value Shares of U.S. Mainland Ports’ East Asian Container Export Value
LA/LB 20.9% 20.6% 20.4% LA/LB 38.2% 40.1% 41.4%
Oakland 8.4% 8.3% 8.2% Oakland 13.7% 12.4% 13.2%
NWSA 4.6% 4.5% 5.0% NWSA 8.3% 8.6% 10.2%
Source: U.S. Commerce Department. Source: U.S. Commerce Department.
Along the storm-lashed Gulf Coast, the Port of Houston 21.3% (+8,053 TEUs), while Charleston recorded a 12.8%
and the Port of New Orleans both enjoyed year-over-year increase (+10,584 TEUs). Among all U.S. mainland ports
gains in inbound loads. Houston’s inbound traffic was in November, only Port Everglades (-2.5%), Jaxport (-1.3%),
up 20.7% (+20,981 TEUs), while New Orleans saw a 7.5% and Boston (-9.3%) faltered.
increase (+766 TEUs).
Enough about boxes. What about the value of what’s in
On the East Coast, the nine Atlantic Coast ports we
them? Well, here are some relevant numbers. Year-over-
monitor saw their inbound loads in November jump by
year, the value of containerized imports from the Far
23.5% (+189,039 TEUs) from a year earlier, with the Port
East through the Port of Los Angeles and Long Beach
of Savannah seeing the briskest year-over-year growth
increased by 18.9%, while the value of containerized
at 34.9% (+60,720 TEUs). Not far behind in percentage
terms was the Port of New York/New Jersey with a 27.2% imports through Oakland and the NWSA rose by 5.4% and
(+81,789 TEUs) gain. Four other East Coast ports posted 7.0%, respectively. Those bumps were overshadowed by
double-digit increases from a year earlier. Maryland the 34.3% increase in the value of containerized imports
was up 21.1% (+8,208 TEUs) as was Virginia (+21,804 from the Far East in November at Savannah and the 24.1%
TEUs). Miami’s inbound loaded container count grew by jump at PNYNJ.
January 2021 Page 5West Coast Trade Report
Parsing the November 2020 TEU Numbers Continued
November 2020 Outbound Traffic in November 2019. Those numbers were reflected
Containerized export traffic has been dismal pretty much in the two ports’ combined share of the value of the
all year, and November was no exception. Still, there were nation’s containerized import trade, with a 35.1% share
notable exceptions, the most notable of which was the in November down from a 36.1% share in October but up
15.3% (+11,791 TEUs) year-over-year boost in outbound from their 34.6% share last November. Meanwhile, the
loaded TEUs at Virginia. Among the other U.S. and Port of Oakland’s November share of import tonnage
Canadian ports we track, only Maryland (3.8%), Charleston slipped to 3.4% from 3.5% in October and from 3.9% a year
(+2.6%), and, yes, Boston (+2.8%) saw gains in their ago. Oakland’s share of import value also edged lower in
export trades. Both Vancouver (-10.5%) and Prince Rupert November to 3.2% from 3.3% in October and from 3.6%
(-15.1%) in British Columbia recorded sizable year-over- in November 2019. Further north, the two NWSA ports
year declines in loaded TEU exports in November. saw their combined share of import tonnage increase to
4.7% in November from 4.5% in October but fall from 5.1%
Outbound loads at Los Angeles and Long Beach in
the previous November. In value terms, the NWSA ports’
November were off by 5.4% from last November, while
import share improved to 6.3% from 6.2% in October but
Oakland recorded a 2.6% fall-off. Meanwhile, export loads
fell from their 6.9% share in November 2019.
through the NWSA ports slipped by 1.1%. In total, outbound
loads through the five major USWC ports were down by On the export side, the Southern California ports gained
4.1% (-17,006 TEUs) from a year earlier compared to a 2.1% market share over November 2019 in terms of both
(-11,029 TEUs) dip at the nine USEC ports we track. tonnage and value. Oakland likewise gained market
Along the hurricane-plagued Gulf Coast, outbound loads share in both categories year-over-year. The November
were down by 4.8% at both New Orleans and Houston. to November comparisons did not bode as well at the
NWSA ports, which saw their combined share of both U.S.
Not surprisingly, the value of the goods traveling in those containerized export tonnage and value decline from a
fewer export containers diminished at the San Pedro Bay year earlier.
terminals by 4.7% from a year earlier, while volume of
containerized shipments out of the NWSA ports plunged Exhibit 5: USWC Ports and the East Asia Trade. The Ports
by 15.7%. Exports through Oakland rose in value by 6.8%, of Los Angeles and Long Beach saw their combined share
while Savannah’s containerized exports to the Far East of the nation’s containerized import tonnage from East
increased by 6.5%. PNYNJ saw a modest 2.5% growth in Asia in November slip to 45.1% in November from 45.9%
its containerized exports to the Far East. in October. Nevertheless, the two ports’ combined share
of East Asian imports was up from 44.0% the previous
Weights and Values November. The two Southern California gateways also
We acknowledge that the TEU is the maritime shipping sustained a modest dip to 51.0% from 51.7% in October
industry’s preferred metric. Here, though, we offer two and from 51.4% in November 2019 in their joint share of the
alternative gauges – the declared weight and value of declared value of those imports. Elsewhere along the coast,
the goods housed in those TEUs. The percentages in the Oakland’s 3.7% share of containerized import tonnage
following exhibits are derived from data compiled by the from East Asia was down both from 3.8% a month earlier
U.S. Commerce Department and are published with a
and from 4.5% the previous November. Oakland’s 3.8%
time-lag of usually five weeks.
value share was also off from October and from November
Exhibit 4: USWC Ports and the Worldwide Container 2019. Further north, the two NWSA ports’ 6.7% share of
Trade. Exhibit 4 features some intriguing statistics on containerized import tonnage was on par with October but
containerized imports (regardless of point of origin) below the prior November’s 7.7% share. And the NWSA
entering mainland U.S ports. The two San Pedro Bay ports’ collective share of the value of containerized imports
ports saw their combined percentage of containerized from East Asia edged higher to 9.0% from October’s 8.7%,
import tonnage in November slip to 28.7% from 29.2% November’s share remained significantly below the 10.0%
in October while also remaining above their 27.2% share share the ports held a year earlier.
January 2021 Page 6West Coast Trade Report
Parsing the November 2020 TEU Numbers Continued
Almost without exception, the weight as well as the value responsible for the highest volumes of year-over-year
shares of U.S. containerized exports to East Asia declined growth in containerized imports from the Far East are
from October to November at all of the major USWC those that more directly reflect the dramatic shift to
gateways. The exception was Oakland’s gain in export work-from-home and, more generally, a cloister-at-home
value share to 13.7% from 12.4% a month earlier and from lifestyles. For example, household furnishings accounted
13.2% the previous November. for 18.8% of increase in containerized import tonnage
from the Far East between March and November. Imports
Who’s #1? of toys, games, and athletic or exercise equipment
The Port of Los Angeles was the nation’s busiest container accounted for 12.9% of the surge. Imports of cell phones,
port in November with total traffic (loaded + empty) televisions and other electronic devices were responsible
amounting to 889,746 TEUs. The Port of Long Beach ran for another 9.3% of the pandemic period’s growth in
second with 783,523 TEUs, while the Port of New York/ containerized import tonnage from the Far East. PC and
New Jersey (PNYNJ) placed well behind in third place laptop imports represented 8.0% of imports.
with 738,885 TEUs. (Trailing even further behind was
Savannah with 464,805 total TEUs.) Soybeans
Owing to a sharp increase in shipments to China, there
For those who believe empty boxes shouldn’t count, was a decided upswing in overall U.S. soybean exports
the rankings do change. Los Angeles remained the big in November, up 62.9% from 6.44 million metric tons in
dog with 595,736 loaded TEUs crossing its docks in November 2019 to 10.48 million metric tons this past
November. In second place, however, was the Port of New November. Nearly three-quarters (74.49%) of the nation’s
York/New Jersey with 501,674 loaded TEUs, narrowly soybean export tonnage this November was destined for
ahead of the 499,960 laden TEUs handled at Long Beach. China, up from 65.9% a year earlier.
The YTD totals (loads + empties) for the first eleven Kalama, the port on the Washington State side of the
months of the year showed Los Angeles in the lead with Columbia River, handled 12.6% of the total export tonnage
8,334,210 TEUs. With 7,297,430 TEUs, second place in November, while the Northwest Seaport Alliance Ports
Long Beach easily bested PNYNJ’s total of 6,876,744 of Tacoma and Seattle accounted for another 6.1%.
TEUs. Strictly in terms of loaded boxes, LA handled Two other Washington State ports, Longview (3.1%) and
5,777,316 laden TEUs through November, with 4,935,782 Vancouver (1.3%) also figured in the trade, while Oregon’s
loaded TEUs crossing the docks at Long Beach. PNYNJ Portland wrangled a 0.7% share of the nation’s soybean
meanwhile processed 4,779,513 loaded TEUs through exports in November. Altogether, U.S. ports in the Pacific
November. Northwest garnered 23.8% of the nation’s soybean export
tonnage in November.
PPE Imports
We’ve seen numerous reports ascribing the congestion Additionally, the Ports of Los Angeles and Long Beach
at U.S. ports over the past few months in large part to the earned a 3.1% share of the soybean export trade by
sudden demand for Personal Protective Equipment (PPE). virtue of their commanding 46.4% share of the nation’s
Intuitively, that would seem to make sense. The COVD- containerized exports of soybeans. Typically, though, only
19 pandemic has certainly prompted a huge surge in the about ten percent of America’s soybeans are shipped
use (at least among most segments of society) of face abroad in containers.
masks as well as plastic gloves, face shields, surgical
gowns, sanitizing liquids, etc. And, since U.S. companies
Waste and Scrap Paper
Once upon a not too distant time, Waste and Scrap Paper
make precious little of this sort of stuff anymore, it would
(Harmonized System Code 4707) comprised about half
naturally follow that America’s ports have been obliged to
the containerized export tonnage shipped from the Ports
handle unprecedented volumes of PPE gear.
of Los Angeles and Long Beach to China. In one particular
However, what the official U.S. Commerce Department month, November 2018, HS 4707 accounted for 60.3% of
trade data indicate is that the categories of goods all of the containerized tonnage the two ports shipped to
January 2021 Page 7West Coast Trade Report
Parsing the November 2020 TEU Numbers Continued
China. By a year later, that share had slipped to 32.8% as that has imposed on manufacturers of the cardboard
China became more and more discriminating about the boxes. Greater volumes of the scrap paper that had
quality of American trash it would accept. This November, formerly been shipped abroad are now being gleaned for
though, the HS 4707 share of containerized export recycling into the boxes turning up on our doorsteps with
tonnage shipped to China through the two San Pedro Bay increasing frequency.
ports stood at just 14.8%.
Unbalanced Trade Lanes
Still, exporters of containerized HS 4707 did manage Altogether, the 76 million residents of the eleven mainland
a 6.5% year-over-year gain in containerized exports states that comprise America’s Far West and Rocky
worldwide, despite the nearly halving of shipments to Mountain regions account for a shade less than one-
China and a 22.6% drop in exports to South Korea. Other quarter of the nation’s population and a shade more
Asian nations more than took up the slack. Malaysia led of its gross domestic product. Yet in 2020, U.S. West
the way with a 32,076 metric tons increase over what it Coast ports handled some 12% of all U.S. containerized
imported in November 2019, a leap of 43.2%, followed by maritime trade tonnage with the European Union.
a 29,118 metric ton increase in shipments from LA and
Long Beach to Vietnam and a 21,256 metric ton surge By contrast, some 34% of America’s containerized trade
in exports to Thailand. Singapore also joined in with a with the nations of Northeast Asia moves through ports
14,287 metric ton boost in imports from the two Southern along the Eastern Seaboard. Last year, over 58% of the
California ports. Port of Boston’s modest container import trade (268,418
TEUs) involved trade with Asia. Trade with Northern
HS 4707 containerized shipments to China from the Europe accounted for a minority share (42%).
Northwest Seaport Alliance ports in Washington State
fell even more sharply (-82.1%) in November than at the There was a time when maritime leaders along the USWC
Southern California ports. But, unlike the San Pedro Bay thought the expanded Panama Canal would be a two-way
ports, HS 4707 exporters using the NWSA ports were street. Evidently, it’s become a thoroughfare with more
unable to find alternate markets. As a result, containerized eastbound lanes. Equally evident is that the bulk of the
HS 4707 exports through the big Washington State ports trade that occurs between Europeans and Western states
were down 22.5% (-10,923 metric tons) from a year earlier. continues to move overland from East and Gulf Coast
ports.
Oakland likewise saw a significant 67.2% fall-off in
containerized exports of HS 4707 to China in November.
But the emergence of other markets willing to import HS
4707 kept Oakland’s overall loss of trade in scrap paper
export tonnage to 3.3% or 5,334 metric tons.
One salient factor has been the pandemic-induced
surge in e-commerce purchases and the demand
Interested in membership in PMSA?
Contact Laura Germany for details at: lgermany@pmsaship.com or 510-987-5000.
January 2021 Page 8West Coast Trade Report
Jock O’Connell’s Commentary:
Forecasting Amidst a Pandemic Era
Not a day seems to pass without one or more maritime The wonder, then, is that the entire edifice of maritime
industry oracle warning of woeful times ahead for trade has not already crumbled. Instead, as PMSA vice
America’s seaports. Cargo forecasters are nearly president Thomas Jelenić aptly notes elsewhere in this
unanimous in expecting the surge of containerized newsletter: “No other gateway in North America could
imports that began last spring will continue to inundate have moved 17.3 million TEU in the face of a pandemic.
ports in Southern California and elsewhere in the U.S. The year 2020 should be remembered as a year where
through much of 2021, thus accentuating the enormous nearly everything went wrong, yet cargo is still flowing.”
strain industrial and retail supply chains have been
Mirabile visu.
enduring. E-commerce, namely the stay-at-homes
ordering online, is said to be largely responsible for the Still, the ports remain in the danger zone, redlining their
ongoing tide of imported goods, although one does capabilities while seeking new efficiencies. According to a
wonder what more there is to order after your Peloton has January 13 article in the venerable and esteemed Journal
finally been delivered. of Commerce: “Six straight months of near-record cargo
volumes have congested the entire Southern California
The bleak outlook, in turn, has prompted maritime
supply chain beyond its capacity.”
industry pundits to scour their thesauri for suitably
apocalyptic synonyms to replace the now hackneyed (It would not be surprising to hear that Las Vegas casinos
“meltdown” to describe the logistical prospect facing, say, are now offering odds on when the Southern California
the Ports of Los Angeles and Long Beach. ports will finally seize up like the Flathead V8 engine did in
my late uncle Victor’s 1952 Ford.)
No one should minimize the challenges that have
confronted these ports, the indispensable hinges that But what, really, is the aspersion at least tacitly being cast
link the ocean with the landside of the nation’s foremost at the ports? Can it truly be that so many of the pundits of
global supply chains. As the blue line in Exhibit A the maritime media are perplexed by the fact that a five-
demonstrates, inbound loaded container volumes have gallon bucket can’t accommodate a six-gallon pour? The
been nothing short of extraordinary at America’s busiest gist of the critiques one hears, especially about the plight
maritime complex. of the San Pedro Bay ports, is that congestion might
Exhibit A Inbound Loaded Container Traffic at the Ports of Los Angeles and Long Beach: 2015-2020
Source: The Ports of Long Beach and Los Angeles
10,000,000 In TEUs
8,000,000
6,000,000
4,000,000
2,000,000
January February March April May June July August September October November December
n 2016 n 2017 n 2018 n 2019 n 2020
January 2021 Page 9West Coast Trade Report
Commentary Continued
easily have been averted if only the ports – along with averred that December might see 1.53 million TEUs arrive.
every other element of the landside supply chain – had November’s update moved the dial to 1.58 million TEUs,
invested in a bigger bucket in the form of cargo-handling still well down from the 1.72 million TEUs American ports
capacities they do not normally need. had handled in December 2019.
Now, if it has suddenly become fair game to slight those So, at this point a couple of weeks before Thanksgiving,
who failed to foresee what few foresaw, it’s equally fair to what were port officials around the country, officials
look squarely at what forecasters had been telling us over like Gene Seroka and Mario Cordero (respectively the
the past several months, particularly those forecasters executive directors of the Ports of LA and Long Beach)
whose predictions are routinely and credulously reported thinking? If they are as diligent in monitoring the GPT
each month in the maritime industry press. forecasts as the esteemed and venerable Journal of
And here’s the rub. Forecasting, especially when so many Commerce is in uncritically reporting them each month,
fundamentals are in flux, is exasperatingly difficult. Even Gene and Mario and their colleagues could reasonably
the best err. Take, for example, the experience of the conclude that handling the projected December traffic
National Retail Federation’s Global Port Tracker (GPT), would be a piece of cake. They might also have planned
one of the most closely watched and highly regarded to take a few extra days off at the holidays. Or, as
prognosticators of container import traffic. maritime professionals, they might rightly have sensed
that la merde était sur le point de frapper le ventilateur.
Starting last July, GPT began issuing periodic forecasts (Pardon my French.)
for November, a month in which we now know 2.11 million
loaded TEUs arrived at U.S. ports. That represented a Between its November and December forecast updates, it
whopping 23.6% bump over the preceding November. probably struck the forecasters that traffic was going to
be a bit heavier than expected. The December 9 updated
What hint were we given that that might happen?
pegged likely inbound loads at 1.91 million TEUs or 11.0%
GPT’s initial July estimate expected that only 1.68 million up from a year earlier. By its January 8 revision, GPT
TEUs would come ashore in November, a volume which conceded that as many as 2.02 million TEUs had come
would have been on a par with the 1.67 million TEUs through U.S. ports in December, a 17.4% year-over-year
imported in November 2019. In its subsequent forecast bump.
updates in August, September, and October, GPT actually
GPT won’t issue its own after-the-fact December
lowered its outlook for November to between 1.58 million
reckoning until early February, but the McCown Container
TEUs and 1.61 million TEUs. As late as its update issued
Volume Observer concludes that inbound loaded TEU
on November 9, GPT’s still expected the final tally for that
traffic in the year’s final month was up 23.4% year-
very month would total 1.70 million TEUs. Only by its
December 9 update, as the flood of inbound containers over-year. Panjiva, another box-counting outfit, found
was figuratively reaching their knees, did the GPT December container shipments to the U.S. were 20.4%
forecasters come close to hitting the mark by abruptly over a year earlier.
upgrading their November forecast to 2.07 million TEUs. 2020 wasn’t an especially good year for anyone in
But, of course, that warning came much too late for the haruspication business. For their sake – and for
anyone on the ground (or on the docks) to prepare for an everyone’s – let’s pray 2021 turns out to be much calmer
onslaught that was already occurring. and more predictable.
GPT’s forecasts for December were no better. Starting last
August, GPT looked for 1.56 million TEUs to turn up at
U.S. ports in December, a level 9.3% below the preceding Disclaimer: The views expressed in Jock’s commentaries
December. A month later, in September, GPT lowered are his own and may not reflect the positions of the Pacific
that expectation to 1.53 million TEUs. By October, GPT Merchant Shipping Association.
January 2021 Page 10West Coast Trade Report
A Year to Be Proud
By Thomas Jelenić, Vice President, Pacific Merchant Shipping Association
Over the last few months, there has been a number of the importance and the needs of the waterfront. Marine
articles and commentary on the state of congestion in terminals and labor modified work schedules to ensure
the Southern California ports. Much of the discussion has proper sanitization procedures could be put in place and
focused on the deluge of pandemic cargo arriving at the took steps to minimize the risk of the pandemic on the
ports of Los Angeles and Long Beach. With upwards of waterfront. After responding to the crisis by shrinking
30 container vessels at anchorage this winter, the delays capacity, ocean carriers expanded capacity to meet the
being experienced along the entire supply chain have been unexpectedly quick return of cargo demand.
cause for consternation by cargo owners and pontification
While most headlines and trade journals focused on
by pundits. In fact, most of the discussion has missed
congestion and remarked on what had gone wrong, few
the point. No other gateway in North America could have
focused on the amazing feat of what was being achieved.
moved 17.3 million TEU in the face of a pandemic. The
In fact, nothing had gone wrong in the ports. Rather, the
year 2020 should be remembered as a year where nearly
entire supply chain was suffering under the pandemic.
everything went wrong, yet cargo is still flowing.
Through regular communication by port stakeholders,
First, let us start with the strangeness caused by the flexibility between labor and terminals, and simply hard
pandemic. Everyone understands that there were record work, the supply chain never buckled.
cargo volumes in 2020, but many do not understand
We should take a moment to appreciate and be thankful
that 2020 was not a record year for San Pedro Bay. That
for the work put in by everyone on the waterfront. From
distinction is still marked by 2018 when cargo volumes
the ocean carriers to the marine terminal operators to the
exceeded the 2006 peak by 11%. The year 2020 was also
ports of Los Angeles and Long Beach to the ILWU, cargo
remarkable for spring’s severe decline of cargo volumes
flowed all year. Our colleagues, especially the members
and the late year surge that followed as retailers and
of ILWU, have worked under the risk of the pandemic.
manufacturers attempted to simultaneously re-stock
Some have become sick; too many have died. In a year of
shelves, respond to the pandemic-induced on-line
crisis, the men and women on the waterfront ensured that
shift in shopping patterns, and prepare for the holiday
the goods to protect us during a pandemic and keep our
season. The severity of the crash and the swiftness of
economy functioning were always available.
the rebound was incredible. From the low in March, cargo
volumes grew by 85% to its monthly high in October. The impacts to the supply chain have been real, but there
While the ports experience cargo volume seasonality will be plenty of time to examine what could have been
every year, there has never been a year where volumes done to further mitigate the impact of the pandemic.
have fluctuated so dramatically. Looking back to 2017, Many stakeholders will be looking for fault for years to
2018, and 2019, the difference between the lowest month come and while some trade journals will question the
and the highest month was much lower: 37%, 44%, and reliability of Southern California’s ports pointing back for
27%, respectively. Without doubt, the pandemic caused the next decade to the year the supply chain “buckled” in
chaos with the timing and flow of cargo volumes. The real the ports. In fact, no other gateway could have achieved
surprise is that cargo flow did not grind to a halt. what the ports of Long Beach and Los Angeles have
achieved in a year of adversity. The ports of Los Angeles
The fact that cargo flow did not stop was not an
and Long Beach met the needs of the trade community,
accident. From the beginning of the pandemic, the
the local community, and the nation.
ports took immediate action to keep both cargo owners
informed while advocating to public officials on both Thank you.
PMSA Copyright © 2021
It is prohibited by law to forward this publication to any other person or persons. This material may not be re-published, broadcast,
rewritten or distributed without written permission from PMSA. Follow PMSA on Twitter @PMSAShip and Facebook.
January 2021 Page 11West Coast Trade Report
Dwell Time Is Slightly Up for December
January 2021 Page 12You can also read