Investor presentation for the year ended 31 March 2019| 13 May 2019 - AWS
←
→
Page content transcription
If your browser does not render page correctly, please read the page content below

Investor presentation for the year ended 31 March 2019| 13 May 2019
Contents

•    FY19 highlights

•    Market dynamics

•    Strategy update and operational overview

•    FY19 financial review

•    Outlook

                                                                           25 years listed on the NZX – over 11,000% total shareholder return

2.   Investor Presentation for the year ended 31 March 2019| 13 May 2019
3. Investor Presentation for the year ended 31 March 2019| 13 May 2019

4. Investor Presentation for the year ended 31 March 2019| 13 May 2019

FY19 highlights

•    Net Profit after tax of $93 million – down 28%
•    EBITDAF of $222 million – down 9%
•    Retail EBITDAF of $64 million, up 8%
•    Generation EBITDAF of $172 million, down 13%
•    King Country Energy customer base successfully integrated to the Trustpower brand
•    11 Agile teams established
•    Agreement signed with Spark will allow Trustpower to add wireless broadband and mobile offerings to its bundle
•    Fully imputed full year dividend of 34c/share
•    Unimputed special dividends of 40c/share

5.   Investor Presentation for the year ended 31 March 2019| 13 May 2019

6. Investor Presentation for the year ended 31 March 2019| 13 May 2019

Electricity Industry
7.   Investor Presentation for the year ended 31 March 2019| 13 May 2019

Supply and demand is tightening and the market is responding

                                                                    New Zealand Winter Energy Margin                                                              OTA Futures price one year from delivery.
                                                              35%                                                                                          $105
     winter excess of supply capacity over projected demand

                                                                                                                                                           $100
                                                              30%
                                                                                                                                                            $95

                                                                                                                                Settlement price ($/MWh)
                                                              25%                                                                                           $90

                                                                                                                                                            $85
                                                              20%

                                                                                                                                                            $80
                                                              15%
                                                                                                                                                            $75

                                                              10%                                                                                           $70

                                                                                                                                                            $65
                                                              5%
                                                                                                                                                            $60
                                                                                                                                                                   2013   2014      2015     2016      2017     2018   2019   2020
                                                              0%
                                                                    2012 2013 2014 2015 2016 2017 2018 2019 2020                                                                 OTA ASX implied Calendar year price

                                                                     New Zealand Energy Margin
                                                                                                                              OTA prices from end of February the year prior to delivery.
                                                                     Minimum margin required to maintain security of supply   New Zealand Energy Margin from Transpower Security of Supply Annual
                                                                                                                              Assessment the year prior to delivery.

8.                                     Investor Presentation for the year ended 31 March 2019| 13 May 2019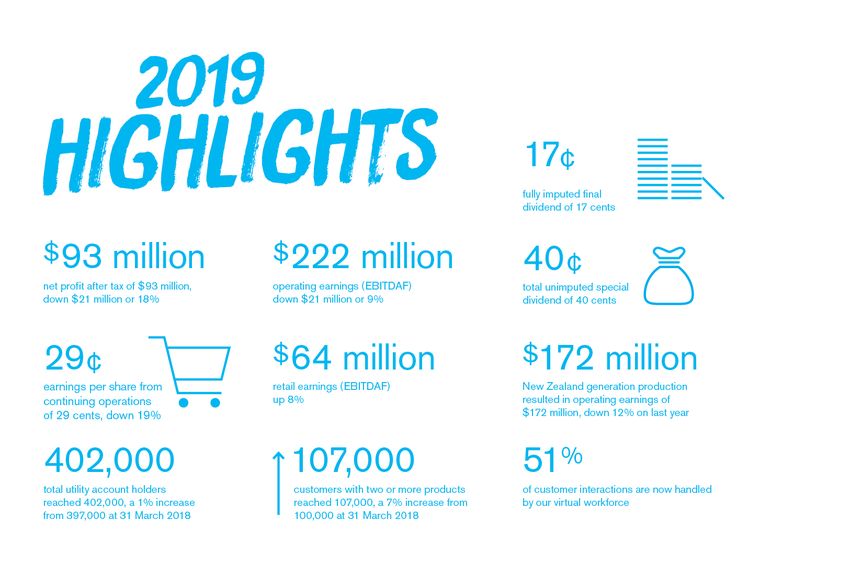
What does this mean for electricity generation?

Similar to most commentators Trustpower thinks a material amount of new generation will be required
to meet demand over the next 2-3 decades
This period will be characterised by:
•    Carbon Zero Bill introduced to Parliament
•    A strong focus on building new renewable generation and closing thermal generation driven by
     government policy and societal demands
•    Short periods of over and under build – considered investment meaning long periods of over/under
     build are unlikely
•    Volatile pricing as the intermittent nature of wind generation is absorbed into the market
•    The overall impact on pricing is hard to predict. Technology cost reductions in renewable generation
     may be offset by security of supply costs to counteract peaking and location factors

                                                                                                            Deep stream

9.   Investor Presentation for the year ended 31 March 2019| 13 May 2019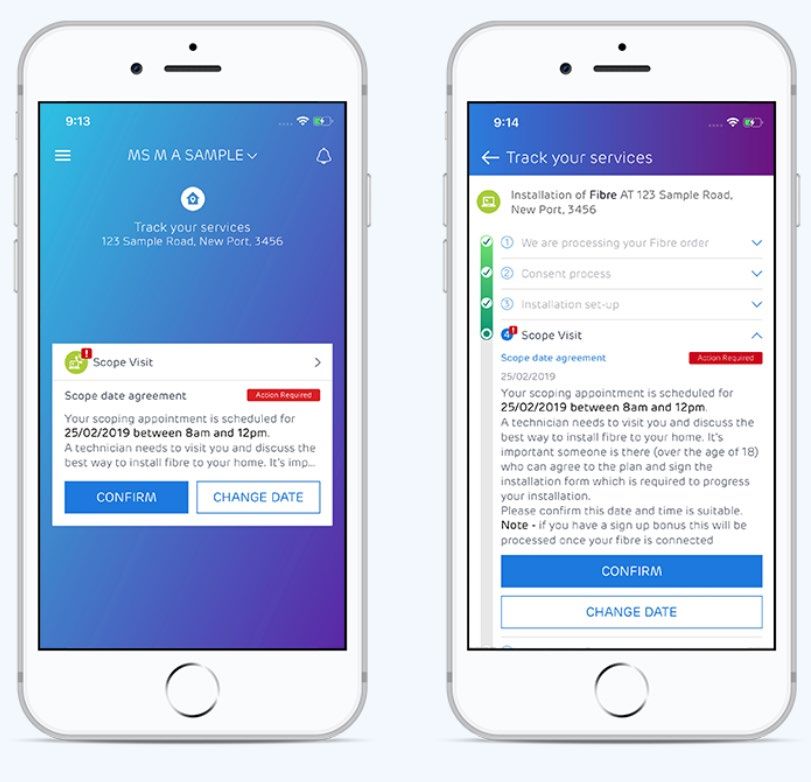
What does this mean for electricity retail?

Wholesale risk management will be critical in the electricity retail      Early signs wholesale prices may be impacting retail competition
market
•   The period of low spot prices driven by oversupply is over.                                        Annualised total electricity ICP market churn
•   Retailers will need to hedge risk and set their retail prices
    accordingly.                                                          35%

•   Increased demand and higher wholesale prices will give
    gentailers more choice about where they place their load.
                                                                          30%
•   There will be industry consolidation and number of retail
    brands will drop from the current high level – over 40
    brands.                                                               25%

Innovation and product differentiation focussed on customer needs
                                                                          20%
will be key to retail success

                                                                          15%

                                                                          10%
                                                                                Apr-16   Jul-16   Oct-16   Jan-17   Apr-17   Jul-17   Oct-17   Jan-18   Apr-18   Jul-18   Oct-18   Jan-19

                                                                                            TPW - Market                       Electricity Market                  Genesis
                                                                                            Mercury                            Contact Energy                      Meridian

10. Investor Presentation for the year ended 31 March 2019| 13 May 2019
Telecommunications Industry 11. Investor Presentation for the year ended 31 March 2019| 13 May 2019
Data consumption and fibre connections are growing

Internet connections                                          Fixed-line broadband connections by technology                Fixed-line broadband data consumption

Source: Commerce Commission, Annual Telecommunications Monitoring Report, 18 December 2018, https://comcom.govt.nz/__data/assets/pdf_file/0016/111292/2018-
Annual-Telecommunications-Monitoring-Report-18-December-2018.pdf

12. Investor Presentation for the year ended 31 March 2019| 13 May 2019
What does this mean for telco retail?

Demand for data and the fibre rollout will continue to drive change
The continuing demand for data will ensure the transition from copper to fibre will continue
for 3-5 years continuing to provide a value led reason for changing providers
Bundling will be commonplace e.g. broadband with one or all of – Mobile, content, electricity,
home appliances etc.
We are already seeing major players moving away from price led offers to value led offers
Quality of service will be critical – the Rugby World Cup will be a key challenge for all service
providers
Having visibility and control over the network is the key to delivering high quality service
Small scale providers (
14. Investor Presentation for the year ended 31 March 2019| 13 May 2019
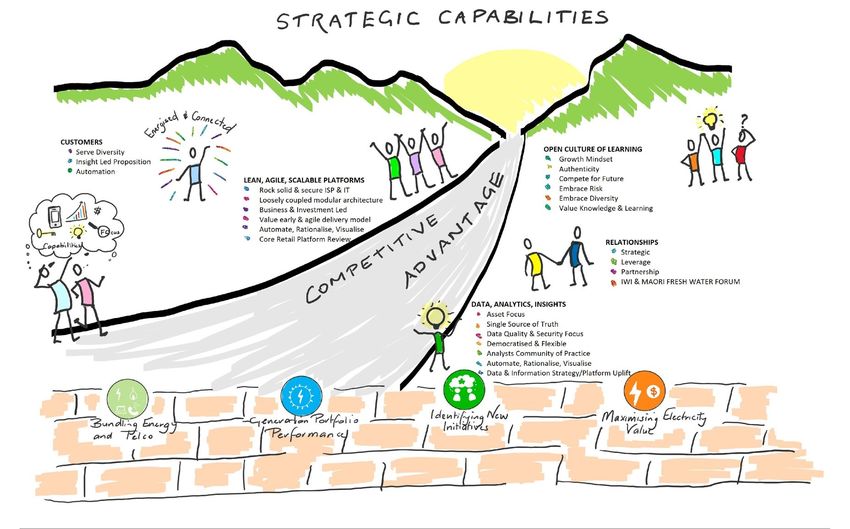
Trustpower’s strategy – to create executable
options driving shareholder returns

                  Bundling Energy and             Generation Portfolio           Maximising Electricity             Identifying New
                         Telco                       Performance                        Value                           Markets
 Strategic
  Pillars

                                                                                                                                           Shareholder
                                                                                                                                                Value
                                                                                                                                             To deliver
                                                                                                                                                a total
                                                                                                                                           shareholder
                Driving action based        Meeting our               Strong, positive      Lean, agile, scalable       Open culture
                                                                                                                                            return (TSR)
                 on data, analytics      customers’ needs.             relationships       technology platforms        with a collective
                                                                                                                                             in the top
 Capabilities

                    and insight.                                                              and processes.           learning focus.
  Strategic

                                                                                                                                             quartile of
                                                                                                                                              the NZX
                                                                                                                                                while
                                                                                                                                            maintaining
                                                                                                                                               a strong
                                                                                                                                              focus on
   Values

                   Passion              Respect               Integrity           Innovation           Delivery             Empower        total societal
                                                                                                                                               impact

15. Investor Presentation for the year ended 31 March 2019| 13 May 2019
16. Investor Presentation for the year ended 31 March 2019| 13 May 2019
Creating a competitive advantage

17. Investor Presentation for the year ended 31 March 2019| 13 May 2019
We have built a carrier grade ISP network & capability

Trustpower has invested $3-5 million per year for the last five years which
means:
•   We have a nationwide network with points of presence in all the major
    cities
•   Our comprehensive mesh network of dedicated optical rings means we
    have high levels of redundancy
•   In addition to our Sydney Points of Presence we are building two new
    sites in the US.
•   All of our offshore sites have dedicated connections
•   In addition to our own sites we have our equipment in all of our service
    providers’ key locations
•   Number one or two in the New Zealand Netflix ranking throughout
    the year
Without a dedicated carrier grade network you cannot provide the level of
service customers are demanding

18. Investor Presentation for the year ended 31 March 2019| 13 May 2019
Building people capability and competing for talent
2013 2014 2015 2016 2017 2018 2019
Shifting to Cross- Open Organisation Process
Leadership Functional Survey to assess Improvement Skills
Charter Second Open
Collaboration how internal training for internal
Developed Organisation
across teams to capability is efficiencies.
describing were survey shows
navigate complex developing and is
we have been great results.
problems. viewed.
and capabilities
needed to Leadership
Shifting to feedback Continue key
navigate Development
culture and changed initiatives to
uncertain future. program initiated. New Ways of remuneration build ability to
Working achieved approach. Agile teams set
attract and
by shift of head up for faster
develop talent.
office to activity Developing significant delivery of key
based working. internal facilitation projects.
capacity.
19. Investor Presentation for the year ended 31 March 2019| 13 May 201920. Investor Presentation for the year ended 31 March 2019| 13 May 2019
Strategic focus - generation portfolio

                                                                          Peaking capacity will
                                     There will be value                  increase in value as    Machine availability
                                      enhancing new                       prices become more       will be critical to
                                      development or                             volatile         capitalise on short
                                        acquisition                                                 periods of high
                                      opportunities as                                                   pricing
                                       demand grows

                                                                          Strategic convictions         Increasing volume
                                  Innovation and                                                        through enhancing
                               automation will lead                                                    existing schemes will
                                to cost efficiencies                                                        add value as
                                                                                                          demand grows

21. Investor Presentation for the year ended 31 March 2019| 13 May 2019
Enhancing generation volume
Continued focus on efficiency and enhancements Long-Run average and actual generation volume
delivers results (excl GSP and Tilt)
• Average generation volume increased by 2,500
50GWh in the decade to FY16 Currently 1,917 GWh
• Average generation forecast to increase by KCE Acquisition
65GWh from FY17 to FY25 2,000
1,500
Annual GWh
1,000
500
0
FY-06FY-07FY-08FY-09FY-10FY-11FY-12FY-13FY-14FY-15FY-16FY-17FY-18FY-19FY-20FY-21FY-22FY-23FY-24FY-25
Actual NZ hydro generation Long-run average
22. Investor Presentation for the year ended 31 March 2019| 13 May 2019Matahina re-runner enhancement project – improving peaking and volume
Background Next Steps
• Matahina produces 270GWh per year
• Installed capacity of 80MW –
2 units @ 40 MW each
Evaluate &
Concept Select
• Replace one runner with high efficiency low
flow runner • Model testing
• Replacing a 40MW with a ~32MW to
• Procurement for Model
improve operating range/efficiency to
Tests
extract more value
Financials • Select Successful
Model/vendor
• Produce and additional – 10.5 GWh
• Material NPV benefits • Prepare Justification
• Confirm costs for
Existing Matahina Runner Define Phase
• Select best option
23. Investor Presentation for the year ended 31 March 2019| 13 May 2019Coleridge G2 and G3 – improving machine availability
Coleridge G2 and G3 Replacement (units ranked 5 & 6th highest
value in Trustpower portfolio):
• Zero harm to people
• International tendering to secure the best value available
• Engineer, procure, construct delivery model to leverage the best
out of international experience and skill
• Focus on project delivery with ‘one team’ attitude
• Delivered ahead of schedule and under budget despite
unexpectedly replacing the units in parallel due to the failure of
the old G2 during the outage for the replacement of G3.
• Technical specification met or exceeded
• Strong relationships built with GE both locally and New G3 being installed Project Team with the new G2
internationally.
24. Investor Presentation for the year ended 31 March 2019| 13 May 201925. Investor Presentation for the year ended 31 March 2019| 13 May 2019
Strategic Focus - Retail

                                                                          Managing electricity
                                        Owning a high                        price risk will be
                                      performing robust                   critical – being under   Profitable growth will
                                     telecommunications                     hedged or under         come through value
                                    network will be critical               priced could lead to     led acquisitions not
                                    to providing customer                   substantial losses        price discounting
                                     service expectations

                                                                                                           Retaining a
                                                                                                       profitable customer
                                         Innovation and                                                 base requires high
                                      automation will lead                 Strategic convictions         quality service,
                                       to cost efficiencies                                             product diversity,
                                                                                                         innovation and
                                                                                                            efficiency

26. Investor Presentation for the year ended 31 March 2019| 13 May 2019
Electricity risk management
Trustpower’s has successfully managed retail price risk for a Trustpower supply/demand balance in a typical year
number of years
• Trustpower understands the risk of retailing without full support
of a generation business.
• The existing risk management tools are sufficient to manage the
risk
• Managing risk requires an active strategy transacted well in Active risk
advance management
• The cost of risk management needs to be considered when
setting retail pricing
Retailers that do not manage wholesale price risk and set prices
accordingly risk business failure
Generation Fixed price sales
27. Investor Presentation for the year ended 31 March 2019| 13 May 2019Focus on execution of proven products with increasing customer acceptance
Total Customers By Electricity Gross Profit Current connections
Region Current By Region - FY-19
Bay of Plenty Metro Regional Bay of Plenty Metro Regional
269,700 electricity
22%
27%
38,700 gas
47% 49%
31% 24% 96,000 telco
Over 107,000 customers have
Comment more than one product
• 2/3rds of all new customers are taking 2 or more products
• We continue to see strong telecommunications growth and we
are creating a diverse and resilient customer base
• We created a new bundled category and plenty of others are
attempting to follow
28. Investor Presentation for the year ended 31 March 2019| 13 May 2019Targeted value based offers outperform simple discounting
Customer persistence Incentive costs aligned to cost of discounting or account credits, however
value based offers outperform:
100%
• Better sales conversion and lower sales leakage
90%
• Lower churn and lower credit risk
80% • Higher energy consumption and larger data plans driving higher margin
per customer
70%
Customers remaining
60%
50%
Value led compared
40% Measure
to price led
30% Customers retained during the switching
3% more
process
20% Customers retained at the end of the
12% more
contract period
10%
Customers leaving in 3 months post Early signs are positive
0% contract ending but limited data
1 2 3 4 5 6 7 8 9 10 11
Years since acquisition Average electricity volume 12% more
Percentage of customers taking higher value
Price-led bundle Value-led bundle Electricity only 7,710% more
broadband offers
29. Investor Presentation for the year ended 31 March 2019| 13 May 2019Lower churn = higher value
Electricity Only vs Multi-Product Churn Electricity Only vs Multi-Product Churn
(Excluding Tauranga)
25% 25%
20% 20%
15% 15%
10% 10%
5% 5%
0% 0%
Mar-17 Jun-17 Sep-17 Dec-17 Mar-18 Jun-18 Sep-18 Dec-18 Mar-19 Mar-17 Jun-17 Sep-17 Dec-17 Mar-18 Jun-18 Sep-18 Dec-18 Mar-19
Electricity Only Dual Fuel Triple Play Electricity and Telco Electricity Only Dual Fuel Triple Play Electricity and Telco
30. Investor Presentation for the year ended 31 March 2019| 13 May 2019Looking to the future
Fixed Wireless Broadband Mobile
• Enables supply of telco bundle to high • Excited to be partnering with Spark
value provincial customers on solid commercial terms
• Improved internet services for existing • Strategically important service due
customers on poor quality copper to convergence
connections • Logical extension to our household
• Provides a convenient ‘casual’ broadband bundle of services
alternative and a stop gap measure during • Our customers have been asking for
slow fibre connections it
Hopsta Solar Buddies
• Prepay Fixed amount power and • Largest P2P electricity trading
broadband bundle solution in NZ
• Simple - no contracts, no credit checks • Allows solar customers to give or
• Targets apartment market through sell excess solar generation to
digital and key influencer channels friends and family
• Initial pilot successfully completed in • Appeals to engaged solar customers
2018 that validated key assumptions • Steady organic growth continues
• Larger scale pilot currently underway
31. Investor Presentation for the year ended 31 March 2019| 13 May 2019Automation providing customers with choice
• 49.8% of all contacts serviced via digital non staffed 0 20 40 60 80 100
channels, our FY20 goal is 60% Phone
• Our bots are being taught to analyse customers
Email
sentiment ,enabling them to personalise their responses
or recognise where human intervention should occur, FY 2019
creating a seamless human – robotic customer Webchat
experience
• Exploring voice interactions as the next iteration of our Virtual Agent
Chatbots which will enable integration with customers
personal assistants Trustpower App
• Satisfaction & reengagement rates are high. The
Trustpower App has reengagement rates of 80% FY 2018
Online account self
service
• Productivity of our staffed workforce has increased from
1 contact centre employee servicing 2,251 products to SMS Balance
now servicing 2,722 products.
IVR Outages
FY 2017 Chat Bot
Facebook (pm)
32. Investor Presentation for the year ended 31 March 2019| 13 May 2019Customer centred services driving satisfaction
Customer Satisfaction
100.0%
90.0%
80.0%
70.0%
60.0%
50.0%
Webchat Agent Phone Agent App Chatbot
33. Investor Presentation for the year ended 31 March 2019| 13 May 201934. Investor Presentation for the year ended 31 March 2019| 13 May 2019
EBITDAF bridge full year 2018 - 2019

        250                                                                                                                Generation volume was 11%
                                                                                                                           lower than the very high
        240                                                                                                                volume achieved in 2018 but
                                                                                                                           still 4% above long term
                                                                                                                           average
        230
                                                                                                                           Retail margin reflects the
                                                                                                                           higher margin from bundled
        220
                                                                                                                           customers

        210

   $M 200

        190

        180

        170

        160

        150
                    2018        Generation volume Generation price     Retail margin   Employee   Other/operating   2019
                                                  (inc trading gain)                   expenses        costs

35. Investor Presentation for the year ended 31 March 2019| 13 May 2019
Solid retail performance
70 Telco margin per customer
includes one-off timing
variance of ~$3m
60 Electricity margin per unit
variance includes internal
hedge settlement variance
of ~$4m (refer additional
$M 50 information on transfer
price)
40
30
Cash based EBITDAF IFRS 15 adjustments
36. Investor Presentation for the year ended 31 March 2019| 13 May 2019Generation earnings
200 Generation volume was 11%
lower than the very high
195 volume achieved in 2018 but
still 4% above long term
average
190
Other revenue increase
185
largely due to strong
reserves market during high
price periods
180
Operating cost variance
includes significant
$M 175 refurbishment work at
Matahina and Coleridge
170 (only some of which was
capitalised)
165
160
155
150
2018 Generation volume Generation price Avoided cost of Other revenue Operating costs 2019
(inc trading gain) transmission
37. Investor Presentation for the year ended 31 March 2019| 13 May 2019Final dividend Final Dividend declared of 17 cps Fully Imputed bringing total ordinary dividends for the year to 34 cps Fully Imputed All ordinary dividends expected to be fully imputed from now onwards. Special Dividend declared of 15 cps Unimputed bringing total special dividends for the year to 40 cps Unimputed 38. Investor Presentation for the year ended 31 March 2019| 13 May 2019
Debt capital management

                                                                               300

                                            133
       202
                                                                               200
                                                                          $M

                                                                               100

                                                                                 -
    114
                                                                                            0-1        1-3        3-5          5-7           7+
                                                                                     Bank         Senior Bonds     Sub Bonds         Unutilised Bank
                                                  311

               Bank                Senior Bonds                            •     FY20 forecast Debt/EBITDAF is circa [X] times following payment of
               Sub Bonds           Unutilised Bank                               dividends
                                                                           •     Trustpower expects to access debt capital markets during the year to
                                                                                 increase debt tenure

39. Investor Presentation for the year ended 31 March 2019| 13 May 2019
40. Investor Presentation for the year ended 31 March 2019| 13 May 2019
In summary

•   Trustpower has achieved a solid FY19 operating result and is now well
    positioned for the future
•   Focused on incremental value creation in generation, cost optimisation
    and volume gains
•   Building a network of partners that create options for participation in
    new generation
•   Trustpower repositioned as a New Zealand focused multi-product
    platform
•   Multi-product platform delivering for customers and shareholders
•   Well positioned in an uncertain and changing world for further
    convergence with proven integration capability
•   Building capability to compete in the digital world

                                                                              Highbank

41. Investor Presentation for the year ended 31 March 2019| 13 May 2019
Market guidance update
FY20 EBITDAF CAPEX
Trustpower expects its FY-20 EBITDAF to be in the range of $205m Trustpower expects its FY20 capex to be in the range of $28m - $34m
- $225m
This is made up of:
The FY-20 forecast is underpinned by the following assumptions:
• Generation capex in the range of $12m - $15m
• Generation volumes for FY-20 of ~1,870 GWh (incl KCE). This is
• IT and telecommunications network capex in the range of
below the expected long-run average of 1,917 GWh, reflecting
$13m - $16m
current below average lake storage levels.
• Other capex ~$3m
• NZ Wholesale prices are in line with current forward pricing for
the year
• Average temperatures and average electricity consumption for Dividends
the year
• Ordinary dividends are expected to be consistent with FY-19 ordinary
• Total average mass market customers between 230,000 and dividends and will be fully imputed. Trustpower does not anticipate any
240,000 including circa 103,000 telco customers further special dividends
42. Investor Presentation for the year ended 31 March 2019| 13 May 201943. Investor Presentation for the year ended 31 March 2019| 13 May 2019
44. Investor Presentation for the year ended 31 March 2019| 13 May 2019
Trustpower key facts

•   Tauranga based national electricity generator and retailer of energy and telco
•   History dates back to 1923 as the Tauranga Electric Power Board
•   Market capitalisation circa $2.2 billon
•   Key shareholders Infratil (51.0%) and TECT (26.8%)
•   New Zealand generation capacity (hydro) 487MW producing an average of circa 1,954 GWh per annum
•   Approximately 250,000 customers
•   107,000 customers have more than one product
•   Approximately 818 FTE employees

45. Investor Presentation for the year ended 31 March 2019| 13 May 2019
Trustpower adds shareholder value

Share price trend driven by underlying                                                                                                  TPW     30.3%
                                                                                Total Shareholder Return - FY-19
value
                                                60%                                                                                     CEN     40.1%
High dividend yield
                                                                                                                                        GNE     45.3%
Sustainable gearing allowing for future
                                                50%
growth                                                                                                                                  MCY     26.6%
Supportive major shareholders                                                                                                           MEL     54.7%
                                                40%
Credible retail growth story
                                                                                                                                        SPK     21.4%
Flexible and geographically diverse             30%
fleet of generation assets that will                                                                                                    NZX50   18.3%
optimise value under a variety of
scenarios                                       20%

                                                10%

                                                 0%

                                               -10%
                                                  Apr-18 May-18 Jun-18 Jul-18 Aug-18 Sep-18 Oct-18 Nov-18 Dec-18 Jan-19 Feb-19 Mar-19

                                                           CEN            GNE         MCY       MEL        TPW      SPK        NZX50

46. Investor Presentation for the year ended 31 March 2019| 13 May 2019
FY19 Overview
Key Drivers Comments
• A very strong result thanks to favourable hydrology and pricing as well EBITDAF of $222.2 million is down 9%
as an improved retail contribution. Underlying Earnings of $103 million down 24%
• Generation above long run average but below last year Generation production of 1,994GWh 11% below last year, up 4% on long
run average
• Retail growth strategy progressing well Electricity connections down 2% to 267,000
Gas connections up 5% to 39,000
• Continued spend on marketing and acquisition Telco connections up 10% to 96,000
Customers with two or more connections up 7% to 107,000
• Generation assets revalued downwards Loss of $153 million recognised in reserves and $11 million in the income
statement. Key driver of valuation movement was a lower view of future
wholesale electricity prices. There is a large degree of uncertainty around
this forecast.
47. Investor Presentation for the year ended 31 March 2019| 13 May 2019Generation volumes
Long-run average
FY-06 FY-07 FY-08 FY-09 FY-10 FY-11 FY-12 FY-13 FY-14 FY-15 FY-16 FY-17 FY-18 FY-19
GWh per annum
Existing Portfolio 1,720 1,679 1,693 1,700 1,701 1,660 1,672 1,690 1,691 1,701 1,691 1,669 1,689 1,684
Esk - - - - - - - - 11 15 15 15 15 14
Deep Stream - - - - - - - 23 22 22 22 20 20 19
KCE - - - - - - - - - - - 200 200 200
TOTAL 1,720 1,679 1,693 1,700 1,701 1,660 1,672 1,713 1,724 1,738 1,728 1,904 1,924 1,917
48. Investor Presentation for the year ended 31 March 2019| 13 May 2019Electricity supply/demand balance The risk of a dry winter has reduced since late March. Significant inflows in the last week of March have lifted national storage above the mean and clear of the hydro risk curves. The sudden change reflects the volatile nature of the market. 49. Investor Presentation for the year ended 31 March 2019| 13 May 2019
Key regulatory issues

Overview
•   We await Government release of the ICCC reports “Planning for the transition to 100% renewable electricity by 2035”
•   Trustpower remains well placed to support the transition to a low emissions and increased renewable electricity future.
Electricity price review (EPR)
•   The EPR Panel is due to make final recommendations to the Minister for Energy and Resources by mid- 2019
•   The Review has provided a valuable opportunity to improve consumer engagement & address energy hardship
•   Trustpower submitted in support many of the wellbeing initiatives and changes that the Panel recommended in their Draft report
•   Trustpower has expressed a view that if any changes to the wholesale market are made, they must be careful not to undermine a system that has largely
    delivered reliability and security for consumers, and to date has produced the right investment outcomes, and supported a renewable growth.
Regulatory frameworks for telecommunications and gas
•   Trustpower would like to see similar issues regulated consistently across the electricity, gas and telecommunications sectors
•   Having attained access, Trustpower will increase activity in the area of mobile regulation.
•   In light of the Christchurch mosque attacks, we expect there will be a regulatory change in response.
Water Reform
•   The Minister for the Environment has acknowledged that hydro generation plays an important role in NZ’s renewable energy future.
•   Trustpower, like other hydro generators, is yet to learn what the Government’s revised programme around Iwi Rights and Interests in Freshwater will entail.

50. Investor Presentation for the year ended 31 March 2019| 13 May 2019
Avoided Cost of Transmission – inline with forecast
ACOT Capacity (MW) and Interconnection Rate (FY20)
300 $140.00
$120.00
250 $100.00
$80.00
200 $60.00
$40.00
MW
150 $20.00
$0.00
100
50 Revenue received from ACOT is a function of both capacity and
Interconnection Rate as set by Transpower.
0
2015 2019 Capacity can change year on year depending on ability to capture demand
peaks and plant availability.
Firm Disputed Lost
Interconnection Rate set in accordance with Transpower revenue
requirement to “run the grid”
Some uncertainty remains around one scheme.
51. Investor Presentation for the year ended 31 March 2019| 13 May 2019Having a robust transfer price is key to measuring retail performance
Trustpower’s methodology
1. Establish a monthly base rate based primarily on ASX pricing (1/3 based 3 years ago,1/3 2 years ago, 1/3 1 year ago).
2. Adjust for location factors and load shape relative to pricing peaks (peaking factor)
3. Adjust for the annual volume option premium provided by the internal trading division and an allowance the transaction costs.
4. Establish a fixed volume for each month and location. If actual volume varies then Retail needs to buy/sell at spot prices.
Industry practice
• Steps 1 & 2 seem to be fairly consistent with market practice for setting transfer prices however steps 3 & 4 seem unique to Trustpower. Others appear to
use variable volume, load following hedges with no premium above ASX.
FY17 FY18 FY19
$000 $000 $000
Reported Retail EBITDAF 44,965 59,593 64,481
Volume settled at spot 4,535 (1,177) (5,632)
Option premium/transaction costs 4,320 4,114 4,529
Retail EBITDAF if hedge volume is variable and no risk premium 53,819 62,529 63,378
52. Investor Presentation for the year ended 31 March 2019| 13 May 2019Netback
FPVV Netback Strong retail profitability reflects:
• Retention of existing customers through excellent service
140
• Targeting of value adding new customers
120
100
80
$/MWh
60
40
20
-
2016 2017 2018 2019
Note: includes Fixed Price Variable Volume (FPVV) commercial and
Total Netback Excluding CTA ASX benchmark
industrial customers
53. Investor Presentation for the year ended 31 March 2019| 13 May 2019Market Guidance Update 54. Investor Presentation for the year ended 31 March 2019| 13 May 2019
Generation asset valuation

                                                                                                            • Price path is ASX initially then $85
                                                Asset valuation movement
                                                                                                              flat real thereafter
               2,500                                                                                        • WACC is 7.45%
                                                                                                            • ACOT revenue as per current EA
                                                                                                              rulings
                                                                                                            • All costs as per Trustpower
               2,000                                                                                          internal plans

               1,500
  $ millions

               1,000

                500

                  -
                       Pre-revaluation   Price path        ACOT           WACC   Other   Post revaluation

55. Investor Presentation for the year ended 31 March 2019| 13 May 2019
Customer acquisition costs
• Trustpower early adopted NZ IFRS 15 Revenue from Contracts with Customers in its March 2017 financial year.
• On initial adoption, certain incentives provided to customers were assessed as being an incremental cost of obtaining a contract with a customer as
described in NZ IFRS 15.
• These costs are now treated as being performance obligations in their own right.
• The most significant impact is to change the period over which these costs are amortised from the expected life of the customer relationship (which
Trustpower has assessed as being four years) to the term of the contract (which averages approximately two years).
• Trustpower has elected to apply the revised treatment from 1 April 2018 only as the impact of the change is immaterial.
• Detail on the amounts capitalised and expensed during the year can be found in Note 4 to the financial statements.
56. Investor Presentation for the year ended 31 March 2019| 13 May 2019Non-GAAP Measures
• Underlying Earnings is a non GAAP (Generally Accepted Accounting Principles) financial measure. Trustpower believes that this measure is an important
additional financial measure to disclose as it excludes movements in the fair value of financial instruments which can be volatile year to year depending on
movement in long term interest rate and or electricity future prices. Also excluded in this measure are items considered to be one off and not related to
core business such as changes to the company tax rate or impairment of generation assets.
• EBITDAF is a non GAAP financial measure but is commonly used within the electricity industry as a measure of performance as it shows the level of earnings
before impact of gearing levels and non-cash charges such as depreciation and amortisation. Market analysts use the measure as an input into company
valuation and valuation metrics used to assess relative value and performance of companies across the sector. The EBITDAF shown in the financial
statements excludes the Australian business which is a discontinued operation.
• Reconciliation between statutory measures of profit and the two measures above, as well as EBITDAF per the financial statements and total EBITDAF, are
given below:
2018 2019
Profit after tax attributable to shareholders of the Company 128,127 90,650
Fair value losses / (gains) on financial instruments 2,675 5,774
Asset impairments 5,099 10,855
Gain on sale of subsidiary (183) -
Changes in income tax expense in relation to adjustments (749) (4,656)
Underlying Earnings After Tax 134,969 102,623
Operating Profit 127,518 158,394
Fair value losses / (gains) on financial instruments 2,675 5,774
Asset impairments 5,099 10,855
Depreciation and amortisation 44,242 47,156
EBITDAF 243,084 222,179
57. Investor Presentation for the year ended 31 March 2019| 13 May 2019Disclaimer While all reasonable care has been taken in the preparation of this presentation, Trustpower Limited and its related entities, directors, officers and employees (collectively "Trustpower") do not accept, and expressly disclaim, any liability whatsoever (including for negligence) for any loss howsoever arising from any use of this presentation or its contents. No representation or warranty, expressed or implied, is made as to the accuracy, completeness or thoroughness of the content of the information. All information included in this presentation is provided as at the date of this presentation. Except as required by law or NZX listing rules, Trustpower is not obliged to update this presentation after its release, even if things change materially. The reader should consult with its own legal, tax, investment or accounting advisers as to the accuracy and application of the information contained herein and should conduct its own due diligence and other enquiries in relation to such information. The information in this presentation has not been independently verified by Trustpower. Some of the information set out in the presentation relates to future matters, that are subject to a number of risks and uncertainties (many of which are beyond the control of Trustpower), which may cause the actual results, performance or achievements of Trustpower or the Trustpower Group to be materially different from the future results set out in the presentation. The inclusion of forward-looking information should not be regarded as a representation or warranty by Trustpower or any other person that those forward-looking statements will be achieved or that the assumptions underlying any forward-looking statements will in fact be correct. This presentation may contain a number of non-GAAP financial measures. Because they are not defined by GAAP or IFRS, they should not be considered in isolation from, or construed as an alternative to, other financial measures determined in accordance with GAAP. Although Trustpower believes they provide useful information in measuring the financial performance of the Trustpower Group, readers are cautioned not to place undue reliance on any non-GAAP financial measures. This presentation is for general information purposes only and does not constitute investment advice or an offer, inducement, invitation or recommendation in respect of Trustpower securities. The reader should note that, in providing this presentation, Trustpower has not considered the objectives, financial position or needs of the reader. The reader should obtain and rely on its own professional advice from its legal, tax, investment, accounting and other professional advisers in respect of the reader’s objectives, financial position or needs. 58. Investor Presentation for the year ended 31 March 2019| 13 May 2019
You can also read