Annual Membership Survey 2021 - Key trends within the In-House Recruitment industry - Forum for In-House ...
←
→
Page content transcription
If your browser does not render page correctly, please read the page content below

Annual
Membership
Survey
2021
Key trends within the
In-House Recruitment industry

About The Forum                                                                                                                 We are:
                                                                                                                                                                          Run by in-house recruiters, for
                                       for In-House                                                                                                                       in-house recruiters
                                       Recruitment Managers                                                                                                               A membership organisation supporting

                                       (The FIRM)                                                                                                                         in-house recruiters since 2007
                                                                                                                                                                          A source of practical, tangible support
                                                                                                                                                                          for recruiters nationwide
                                       We are a thriving community of Talent
                                       Acquisition professionals that provides                                                                                            A community that reflects the full
                                       both tactical and strategic insight and                                                                                            spectrum of in-house recruiters
                                       support to our members.                                                                                                         www.thefirm-network.com

                     Becoming a Premium Member of The FIRM gives you access to:

                                           Actionable Insights                                                                                             Member-Only Resources         An Active Community

              Global Talent Acquisition
              Organisational
                                                                               Onbos Reparortding
              Structures                                                           Key Insight
                                           ort
              Key Insights Rep

                                  Miller
               Prepared by Ruth

                                                                                                 RESEARCH
                                                                                                             ership Survey
                                                                                                 Annual Memb
                                                                                                        2017/2018 (The FIRM)
                                                                                                                                       Managers
                                                                                                                In-House Recruitment

                                                 Research
                                                                                                                                                industry
                                                                                                  The Forum for        the in-house recruitment
                                                                                                     Key trends within

                                                                   arking Report
            fer             ral                  Agency Fees Benchm

Employee Re
Programmes
                  ort
Key Insights Rep

Prepared by
Contents
Executive Summary           4

Key Findings                6

Other Findings             19

Looking Ahead              37

The People We Heard From   39

                                Annual Membership Survey 2020-2021   3
Executive Summary
    In this year’s FIRM membership survey, we heard from        3 | Insight and Measurement
    360 different recruiters from a range of industries and
    with diverse recruiting needs. By bringing together their   Recruiters are looking more to Employee Engagement
    experiences, we can give an insight into the recruitment    and the External Market for insight. But there is
    market for 2020 and look ahead to the future.               more to be done, and the best recruiters are moving
                                                                ahead. They are thinking more about Line Manager
    We see five key trends – taking particular notice of        and Candidate Experience, as well as the Quality
    recruiting teams that feel they have all necessary          of Candidate, alongside the Time / Cost to recruit.
    capabilities (NB: these are a representative group with     Candidate Surveys and Onboarding Data are the
    large and small teams and budgets).                         measures most recruiters want to add.

                                                                There’s a large reliance on the ATS to capture online
    1 | Diversity and Inclusion                                 metrics, recruiters may reflect if their ATS gives them
                                                                all they need, or if they need to add more.
    Despite the pandemic disruption, D&I has moved a
    long way up the agenda, especially for those that
    see themselves as most capable. Recruiters, and the         4 | Areas to Improve
    organisations they represent, aren’t taking a one-
    dimensional approach. They are looking at many              Improving skills around EVP / Employer Brand /
    groups; not just gender or ethnicity, but extending to      Recruiting Manager – both for the recruiter AND hiring
    LGBT, affluence, ability and many others. The best          manager is a priority for most.
    have targets, but also define specific responsibilities,
    create diverse recruitment teams, examine policy, put       Recruiters want to get better at Sourcing and Business
    in training – and more.                                     Partnering, and feel they lack Tech tools or skills.
                                                                The “best” recruiters make more use of Onboarding
    It is worth reflecting that there are more Graduate         Software and AI. Careers sites have improved slightly,
    Programmes this year and less Work Experience.              but half of recruiters still think their Careers Site
    Likewise, Referral and Alumni programmes have               is “average” or worse. Recruiters would like to use
    increased. All of these will need to carefully managed if   Events and Mentoring to improve their skills. They feel
    diversity is to be increased.                               managers have improvements to make in Candidate
                                                                Engagement and Unconscious Bias / D&I.

    2 | Employer Reputation
                                                                5 | COVID-19
    There is an increased use of Employer Branding
    this year and Candidate Experience has become a             Inevitably, the pandemic has affected recruiters, just
    more important measure. And the biggest and “best”          as it has affected every part of daily life. It’s not only
    recruiters have a greater focus here. They’re more          been the biggest single challenge this year, it’s also
    likely to have improved or refreshed their Careers Site,    changed business needs, the market you operate in,
    and to have an Employer Brand that they feel truly          budget, team size, remit, volume of recruitment, how
    reflects them as an employer.                               easy it is to get scare-skilled professionals to move…
                                                                the list goes on. Some organisations have needed
    But a significant minority don’t believe their Employer     to hire more; many more have had their recruitment
    Brand reflects them, especially if they’ve had a big        significantly decreased, and see this continuing.
    change in hiring needs. If they’re to compete, they’ll
    need to address this.                                       One of the effects of COIVD has to been to make
                                                                video interviewing an essential tool, including
    There’s an increased use of Social Media – likely so        asynchronous video.
    that employers can better project their reputation –
    but in terms of hires Linked In remains by far the most
    effective medium.

4     Annual Membership Survey 2020-2021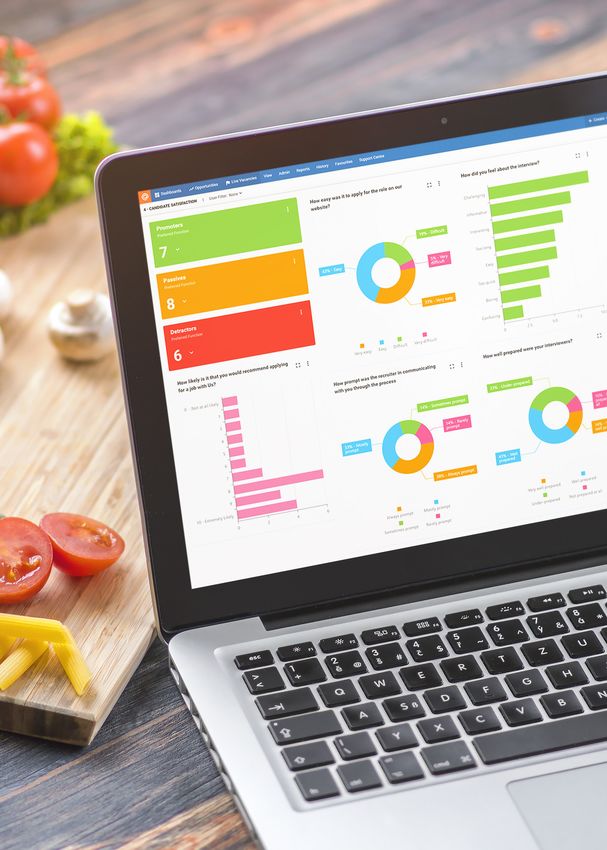
“I’ve worked with a large

       Recruitment
                                                              number of HR Tech providers
                                                                over many years and eArcu

       has changed                                            Always listening for new ideas
                                                                   and implementing them

       Are you keeping up?                                               Liam Reese, Head of HR
                                                                  Operations & Talent Acquisition
                                                                              The Kindred Group

                                                                   JOB

                                                     Analytics
                                    n

                                                           S
                              utatio                               BOARDS
                           Rep

                                                       A
                             g

                                                                    WEBSITE TION
      LinkveedDIensign
                            n

                                   e b oo k                         INTEGRA

                                                    SA
                              Fa  c
                          di

                                                      e   Sig n On
                           CV

                                          1      ing l
                                         0
                         r

                                       0        S
         E

                                     7
                               ISO2 eo Interviewing ng
                        a
FEEDBACK
        T

                       o
       A

                                rc u Vid
      D

                      B

                                                              sti
                             eA                   m et r
                                           Psycho cation
                                                        ic T e
                Responsi
     I

                     -

                                         ATS
   D

                                                                                                 SEARCH TION
                                                                                       SecuErNiGtINyE
                   On

                             Agency                  Communi
  N

                                                       res Referrals
 A

                                                                                                  OPTIMISA
                                                    atu
                           SEO                  Sign
                                              t
C

                                             ic
 Mobility               ia  Re cr u itm    n
                                     Electron
                                         e
        Soc       M  ed
             ial Experience               file
              ate           S ocia l  Pro
 Mobile Candid
                     a n d           e g a t o  rs
     Employ    e r Br
                          E Aggr          IC
                                 SELF SERVIEW               eme n t Tests
                                                          dg
                                   INTERV G Situation Ju nager Integration
                                    BOOKIN          Line Ma

                                                We work with world leading recruiters...

     For information on eArcu’s proven
     and future-proof ATS solution
     email sales@earcu.com or
     call 0800 085 0340.

                                                          Annual Membership Survey 2020-2021     5
     www.earcu.com
6
Diversity & Inclusion
50%
Candidate Experience
39%
EVP & Employer Brand
35%
Direct Sourcing
23%
Strategic Workforce Planning
22%
Recruitment and Succession Planning
18%
Building Talent Pools for future hires
15%
Onboarding
12%
Annual Membership Survey 2020-2021
Key Findings
Internal Mobility
11%
Automation of Recruitment Process
COVID related impacts (i.e restructuring/ virtualisation)
Assessment & Selection
10% 10% 10%
Building recruitment capability
9%
Total Talent Management
8%
Social media/social advocacy
6%
MI and Metrics
6%
In-house Executive Search
4%
Strategic priorities
There’s a clear leader in D&I.
Preparation for Brexit
4%
Use of Artificial Intelligence based tools
3%
Mobile and Technology
Vendor management and review 2%
2%
Taking these three together, this suggests that
service users and any other interested parties).
when – increasingly – the employers’ words and
GDPR Compliance
1%
Employer brand, before a longer tail of challenges.
employer reputation is highly important, especially
This is followed by candidate experience and EVP/
actions are transparent to candidates (and customers,
Contingent labour
1%
25%
                    Diversity & Inclusion
                                                                                                                                50%
                                                                                                                              49%
                  Candidate Experience
                                                                                                                     39%
                                                                                                            33%
                 EVP & Employer Brand
                                                                                                               35%
                                                                                                          31%
                         Direct Sourcing
                                                                                         23%

          Strategic Workforce Planning                                                    24%
                                                                                       22%
                                                                                                    28%
 Recruitment and Succession Planning
                                                                                 18%
                                                                                         23%
   Building Talent Pools for future hires
                                                                           15%

                              Onboarding
                                                                     12%
                                                         6%
                         Internal Mobility
                                                                    11%
                                                                         13%
   Automation of Recruitment Process
                                                                   10%
                   COVID related impacts
        (i.e restructuring/ virtualisation)                        10%
                                                                          14%
                Assessment & Selection
                                                                   10%
                                                                     12%
         Building recruitment capability
                                                               9%

              Total Talent Management
                                                              8%
                                                                                  Last Year
                                                              8%
          Social media/social advocacy                                            This Year
                                                         6%

                          MI and Metrics
                                                         6%
                                                   3%                           We see some differences year on year. But it is the
             In-house Executive Search
                                                    4%                          priority for Diversity and Inclusion that has leapt from
                                                    4%                          25% to 50% of recruiters’ priorities (“Diversity Strategy”
                   Preparation for Brexit
                                                    4%                          was at 23% the year before).
                                                    4%
Use of Artificial Intelligence based tools
                                                   3%                           Even in a pandemic year, there has been a substantial
                                                        5%                      change in priorities – and we can only conclude
                 Mobile and Technology
                                               2%                               that Black Lives Matter has brought organisations’
                                              1%                                responsibilities into sharper relief. It’s not a nice to
       Vendor management and review
                                               2%                               have, it’s a commercial and moral priority.
                                                    4%
                      GDPR Compliance
                                              1%                                We note too that Direct Sourcing has dropped since
                                                   3%                           41% two years ago. Talent Pools have dropped from
                       Contingent labour
                                              1%                                30% 2 years ago.

                                                                                                    Annual Membership Survey 2020-2021       7
We have also looked within the results at 8 segments:                         4. Have EB Function – those that have a separate
                                                                                     Employer Brand team
    1. Increased Hire – those that have hired a lot more
       in 2020                                                                    5. Under 5 in Function – smaller recruiting teams

    2. Decrease Hires – those that have hired a lot less in                       6. Over 20 in Function – larger recruiting teams
       2020
                                                                                  7. Under £250k Budget – recruiting teams with
    3. Have All Capabilities – those that feel their                                 smaller budgets
       recruiting function is fully capable NB – this
       segment reflects the overall spread of size/budget/                        8. Over £1m Budget – recruiting teams with larger
       vacancy numbers” add “i.e. it’s not just the biggest/                         budgets.
       best resourced teams

                                                                                                                                               Under £250k
                                                                                           Capabilities

                                                                                                                     Under 5 in

                                                                                                                                  Over 20 in
                                                                    Increased

                                                                                                                                                             Over £1m
                                                                                Decrease

                                                                                                          Function

                                                                                                                     Function

                                                                                                                                  Function
                                                                                                          Have EB
                                                                                           Have All

                                                                                                                                               Budget

                                                                                                                                                             Budget
                                                          Overall

                                                                                Hires
                                                                    Hire
        Diversity & Inclusion                             50%        47%         42%         51%           56%        47%          64%          49%           59%
        Candidate Experience                              39%        41%         43%         56%           40%        42%          36%          45%           29%
        EVP & Employer Brand                              35%        33%         34%         33%           31%        34%          40%          34%           38%
        Direct Sourcing                                   23%        24%         22%         29%           26%        26%          28%          24%           29%
        Strategic Workforce Planning                      22%        22%         22%         17%           26%        19%          23%          20%           32%
        Recruitment and Succession Planning               18%        24%         17%         24%           21%        25%          13%          27%            6%
        Building Talent Pools for future hires            15%        12%         20%         19%           16%        12%          17%          16%           21%
        Onboarding                                        12%        14%         16%         11%            9%        17%           9%          16%            6%
        Internal Mobility                                 11%         8%         13%          6%           13%        10%          19%           9%           24%
        Automation of Recruitment Process                 10%        16%         14%         13%            9%        13%           9%          11%            9%
        COVID related impacts (i.e
                                                          10%        12%         20%         10%            9%        11%          15%           9%            9%
        restructuring/virtualisation)
        Assessment & Selection                            10%        12%         16%          6%           12%        10%           4%          13%            9%
        Building recruitment capability                    9%        14%          7%          8%           10%         9%          17%          10%           21%
        Total Talent Management                            8%        14%          9%         11%            4%         9%           9%            9%           9%
        Social media/social advocacy                       6%         4%          7%          6%            6%         6%           6%            8%           9%
        MI and Metrics                                     6%         6%          5%          6%            8%         6%          11%            3%           6%
        In-house Executive Search                          4%        16%          4%          5%            6%         5%           6%            6%           9%
        Preparation for Brexit                             4%         8%          8%          5%            4%         4%           4%            6%           9%
        Use of Artificial Intelligence based tools         3%         6%          4%          3%            3%         4%           6%            2%          12%
        Mobile and Technology                              2%         6%          1%          6%            4%         2%           6%            2%           9%
        Vendor management and review                       2%         4%          1%          5%            3%         2%           2%            3%           3%
        GDPR Compliance                                    1%         2%          3%          3%            2%         2%           2%            1%           6%
        Contingent labour                                  1%         4%          1%          3%            2%         2%           2%            1%           6%

         Significantly above the overall average   Significantly below the overall average

    There are two key findings here:

    •     The larger and bigger-budgeted functions - so those                     •    Those that are already feel they are most
          most likely to be in larger organisations are far more                       capable are the ones looking hardest at Candidate
          likely to have Diversity and Inclusion as a priority.                        Experience.

8        Annual Membership Survey 2020-2021
Annual Membership Survey 2020-2021                            9

                                                                           Work in
                                                                          Progress
                                                                            37%
                                                                                                                                           Yes
                                                                                                                                           51%

Does your company have any D&I
Commitments in place?                                                                          NO
88% of companies have made or are working on                                                   11%
Diversity and Inclusion commitments.

                                                                                                                                  Under £250k
                                                                              Capabilities

                                                                                                        Under 5 in

                                                                                                                     Over 20 in
                                                       Increased

                                                                                                                                                Over £1m
                                                                   Decrease

                                                                                             Function

                                                                                                        Function

                                                                                                                     Function
                                                                                             Have EB
                                                                              Have All

                                                                                                                                  Budget

                                                                                                                                                Budget
                                             Overall

                                                                   Hires
                                                       Hire

 Yes                                        51%         44%         43%        60%            60%        41%          67%          38%           63%
 No                                         11%         12%         15%          8%            8%        18%           7%          16%            9%
 Work in Progress                           37%         44%         43%        32%            32%        41%          27%          46%           28%

Recruiters from larger companies, as well as those
that believe they are fully capable and/or have
an EB function are all more likely to have existing
commitments to D&I.
Looking at specifics in our free text question:

     What D&I initiatives does your                                              Multiple                                  24%

     business have in place?                                           Specific Groups /
                                                                               Networks
                                                                                                                     17%

     The most frequent answer is “multiple” initiatives – e.g.         Work in Progress                            15%

     •   Anti-Racisim campaign, a clear Diversity Strategy
                                                                                 Targets                     11%
         published in 2020
                                                                         Team or Person
     •   Transgender Training for all                                                                   8%
                                                                      with Responsibility

     •   Interview panels are mixed gender and ethnicity              Policy and Training              7%

     •   We ensure all shortlisted where possible are                  Diversity Shortlist
                                                                                                   6%
                                                                                  / Panel
         diverse and challenge where not
                                                                                 General          5%
     •   All managers must undergo unconscious bias
         training                                                        “Blind” Process      4%

     •   We are a register Disability Committed Employer              Broadening Appeal      3%
         working towards Level 2 in 2021

     •   We advertise all salaries and we advertise them at
         a circa figure rather than a fixed salary for equality   The next most frequent responses were around:
         and to appeal to the widest of audiences                 •      Looking at groups e.g. by ethnicity, gender,
     •   We never ask current salary and never base offers               affluence e.g.
         on current salary to avoid the perpetuation of                  – Black History month, LGBT communities etc.
         salary gaps                                                     – Employee Networks representing groups such
                                                                             as BAME, LBGTQ+
     •   Networks/strategy/metrics/education/talent                      – Age, Disability and Gender
         management/blind screening/diverse panels/                      – Increase female and BAME volumes from
         pay gap analysis/events/external accreditation/                     application through to hire
         external support                                                – Apprenticeship programme focusing on
                                                                             providing opportunities to students in schools
     •   Stonewall, Disability Confident, e-learning for all                 that have disadvantaged backgrounds. We are
         staff, Unconscious Bias to name a few                               looking into a Returners Programme.
     •   Partnerships with wider range of schools and             As well as:
         universities, blind CVs, unconscious bias training,
         standardised interview questions                         •      Setting targets

     •   Mentoring, Positive Action, focusing on marketing,       •      Giving a person or team specific responsibility for D&I
         remving degree classification for graduates,
         working with specific organsiations to support           •      Creating diverse shortlist and/or panels
         attraction                                               •      Adapting policy and giving training.
     •   Appointed EDI manager, strategy, EDI forum, lots of
         engagement with employees, various groups, lots
         of comms, Policy, resourcing guidance etc.

     This suggests that even if the response has been driven
     by Black Lives Matter – then the response is broad and
     not just focussed on one group, or one tactic.

10       Annual Membership Survey 2020-2021
Annual Membership Survey 2020-2021 11
How many vacancies did your/does                                                       10%
                                                                      up to 50                    15%
     your organisation expect to fill in…?                                                    11%

     Overall, there is very little change in vacancy volumes                                  11%
     from last year, and looking ahead to next.                      51 to 100                      17%
                                                                                                    16%
     As we’d expect, larger employers expect to hire more.
                                                                                                                          37%
                                                                    101 to 500                                            37%
                                                                                                                          37%

                                                                                                    16%
                                                                  501 to 1000               10%
                                                                                                 14%

                                                                                                       18%
                                                                 1001 to 5000                     15%
                                                                                                    17%

                                                                                         7%
                                                                    Over 5000          5%
                                                                                       6%

                                                                           2019          2020                2021

     Is the level of recruitment at your                           Increase by
                                                                  25% or more
                                                                                            9%
     company due to increase or decrease                           Increase by
                                                                                              11%
     compared to last year?                                        11% to 24%
                                                                   Increase by
                                                                                         8%
     For the majority volumes will stay the same.                    up to 10%
                                                                 It will remain
     Perhaps for some for some COVID-19 creates more                                                                30%
                                                               about the same
     roles, for others fewer. Some reported that they also        Decrease by
                                                                                                 13%
     had restructures or transformations – sometimes                up to 10%
     accelerated by COVID.                                        Decrease by
                                                                                                    15%
                                                                  11% to 24%
                                                                  Decrease by
                                                                                                    15%
                                                                  25% or more

     There’s been a sharp decrease in recruiters who expect        Increase by              9%
                                                                  25% or more                 11%
     to recruit more, or even the same number of people
     (and the 2018 picture was similar to 2019, so it’s a          Increase by                11%
     significant drop).                                            11% to 24%                    13%

                                                                   Increase by           8%
                                                                     up to 10%                            21%

                                                                 It will remain                                     30%
                                                               about the same                                                   45%

                                                                  Decrease by                    13%
                                                                    up to 10%            7%

                                                                  Decrease by                     15%
                                                                  11% to 24%        4%

                                                                  Decrease by                     15%
                                                                  24% or more     1%

                                                                             This Year            Last Year

12     Annual Membership Survey 2020-2021
Annual Membership Survey 2020-2021 13
Covid affects volume Increase by
25% or more
4%
When we look at those that ascribe changes to COVID Increase by
8%
11% to 24%
we see the true story – Covid creates a few winners,
but many more losers. Increase by
1%
up to 10%
It will remain
18%
about the same
Decrease by
20%
up to 10%
Decrease by
24%
11% to 24%
Decrease by
24%
25% or more
Have you used any of the following to 72%
Employee engagement 5%
inform your recruitment decisions? 23%
Most people have used these sources, or would like to. 71%
External Market Insight 6%
The likelihood of having used drops off a bit for 23%
Onboarding data (perhaps surprisingly as recruiters
67%
night expect to have good access to this) and Competitor
8%
especially for Candidate Surveys. benchmarking
25%
This perhaps points to a problem or reluctance or lack 65%
of confidence in gaining candidate feedback. Exit interviews 4%
32%
External Market Insight and Market Mapping have
both moved up by 12% pts in each of the last 2 years – 62%
these look like the coming trends. Exit Interviews have Market mapping 12%
moved down by the same amount. 27%
51%
Employee engagement is fairly consistently used as
Onboarding data 10%
insight – but there’s a much more mixed picture for 38%
External Market Insight.
42%
Online candidate
It’s far more used by those with a bigger function, or if surveys
18%
they feel they have all capabilities. 40%
Yes No - no intention No - but I’d like to
Under £250k
Capabilities
Under 5 in
Over 20 in
Increased
Over £1m
Decrease
Function
Function
Function
Have EB
Have All
Budget
Budget
Overall
Hires
Hire
Employee engagement 72% 73% 67% 79% 72% 70% 66% 77% 65%
External Market Insight 71% 45% 75% 79% 75% 62% 89% 63% 74%
Competitor benchmarking 67% 59% 71% 71% 66% 66% 70% 63% 71%
Exit interviews 65% 73% 64% 70% 58% 68% 53% 78% 59%
Market mapping 62% 53% 55% 62% 74% 50% 85% 47% 82%
Onboarding data 51% 47% 49% 56% 58% 42% 55% 48% 59%
Online candidate surveys 42% 37% 46% 40% 44% 30% 55% 35% 56%Do you feel your EVP/Employer Brand 56%
EVP 27%
is reflective of your current company? 18%
Most feel that their EVP and Employer Brand reflect 63%
their organisation, but there’s a significant minority Employer Brand 27%
that don’t. This will be a real impediment to their 10%
recruitment efforts.
Yes No Don’t have one
This year: recruiters are more likely to have an EVP
(+8%pts) or an employer brand (+10%pts).
Under £250k
Capabilities
Under 5 in
Over 20 in
Increased
Over £1m
Decrease
Function
Function
Function
Have EB
Have All
Budget
Budget
Overall
Hires
Hire
Yes 59% 44% 49% 71% 72% 54% 74% 56% 69%
No 27% 28% 38% 21% 19% 32% 19% 26% 22%
Don’t have one 14% 29% 12% 8% 9% 15% 7% 18% 9%
NB: We’ve combined the scores here for clarity.
Interestingly, those that are having the biggest
increase or decrease in hires are much less confident
that their EVP or Employer Brand reflects them.
It’s likely that the change in hiring requirement is
related to changes in the organisation… it appears their
employer branding isn’t always keeping up.
How long ago was your current EVP/ 27%
8%
Employer Brand 12%
First Launched?
15%
We perhaps see why here. 11% of EVP/Employer
20%
Brands are over 2 years since their last refresh and
18%
27% are more than a year since their last refresh.
39%
As we’ve seen, the world, needs and challenges have
20%
changed rapidly. And if an EVP doesn’t reflect your 14%
place in today’s world, it creates a barrier to successful Refreshed?
16%
recruitment. 7%
4%
This is consistent across all segments.
N/A Within the last 6 months 6-12 months
1-2 years 2-4 years 4 years +
14 Annual Membership Survey 2020-2021Annual Membership Survey 2020-2021 15
How do you measure your success Time to Hire
63%
61%
within your business? (tick all that
apply) Cost per Hire
54%
50%
Time and cost, the simplest and arguably most 54%
immediately meaningful metrics, are still priorities. Candidate Experience
44%
But Candidate Experience – potentially much harder to Quality of Hire
46%
make a reliable measure - is equal with Cost 51%
Line Manager 40%
Quality of Hire is close behind in priority too. Experience 7%
Candidate Experience and Quality of Hire will both 37%
Source of Hire
have effects on employer brand and ultimately 36%
business performance.
31%
Vacancy Fill rate
The results are similar from last year, apart from 35%
increasing focus on candidate experience and a huge 14%
increase in measuring the experience of the recruiting Net Promoter Score
11%
manager.
11%
We Don’t...
8%
3%
Other (please specify)
4%
This Year Last Year
Under £250k
Capabilities
Under 5 in
Over 20 in
Increased
Over £1m
Decrease
Function
Function
Function
Have EB
Have All
Budget
Budget
Overall
Hires
Hire
Time to Hire 63% 55% 59% 68% 70% 55% 77% 57% 72%
Candidate Experience 54% 46% 56% 68% 55% 45% 68% 49% 66%
Cost per Hire 54% 48% 51% 58% 59% 52% 64% 53% 53%
Quality of Hire 46% 42% 44% 61% 45% 45% 48% 50% 53%
Line Manager Experience 40% 31% 42% 56% 42% 33% 52% 27% 66%
Source of Hire 37% 21% 35% 42% 42% 32% 48% 32% 41%
Vacancy Fill rate 32% 31% 37% 32% 37% 22% 48% 27% 38%
Net Promoter Score 14% 15% 14% 20% 21% 8% 34% 9% 38%
We Don’t... 12% 21% 17% 8% 11% 20% 9% 16% 9%
Other (please specify) 3% 6% 6% 7% 3% 3% 5% 5% 6%
• Larger, better-resourced functions and those that • Those with increasing hires and those in the
feel they have all capabilities are more likely to have smallest teams are less likely to look at Time to
more measures, including being more likely to look Hire or Candidate Experience.
at Candidate and Line Manager experience.
• Those that feel they have all capabilities are the
segment most likely to look at Quality of Hire.
16 Annual Membership Survey 2020-2021Annual Membership Survey 2020-2021 17
I do not feel
To what extent do you feel that we have the
capabilities
your TA function has the required we need
6%
level of capability to deliver against
I feel we
your priorities? (i.e. in the form of have all the
necessary
technology, skills of recruiters and/or capabilities
required
hiring managers and infrastructure) 27%
I feel
Only just over a quarter of TA functions are seen to be we have
fully capable. some
of the
capabilities
required
67%
If you answered that you feel you Technology 61%
have some or none of the capability Hiring Manager capability 59%
required, what is this due to (click all
that apply) Infrastructure 36%
There’s seen to be a particular deficiency in tech skills Recruiter Skills 35%
or tools and manager capability. “Budget” was the
Other (please specify) 8%
most frequent “other” response.
If you answered that recruiter or hiring Sourcing
72%
43%
manager skills were a concern, which
70%
areas would you say are the biggest Business
Partnering 43%
gaps? 59%
Project
Management 48%
Only in one instance do a majority think there are gaps
for both recruiter and hiring manager and that’s for: Employer branding/ 55%
EVP/Recruitment
Employer branding / EVP / Recruitment Marketing – Marketing 65%
which we’ve already seen is a priority area. So, filling
43%
those skills gaps must be a priority too. Using Networks
74%
• Recruiters need most help with Sourcing and 40%
Onboarding
Business Partnering. 70%
• Managers need most help with Candidate 39%
Recruitment Law
Engagement and Unconscious Bias / D&I 70%
Awareness. 38%
Managing Offers
75%
Selection & 35%
Assessment 80%
Unconscious Bias/ 31%
D&I Awareness 94%
Candidate 28%
Engagement 83%
Recruiter Hiring ManagerWhich of the following do you/your External Resources
34%
55%
team leverage currently or would like
33%
to leverage more? Live Training
56%
There’s a fairly consistent picture - but with mentoring 33%
Networks
and events being the two biggest areas that recruiters 59%
want to use more.
32%
Events
60%
31%
Recorded Training
57%
27%
Mentoring
63%
Currently leverage Would like to leverage more
Under £250k
Capabilities
Under 5 in
Over 20 in
Increased
Over £1m
Decrease
Function
Function
Function
Have EB
Have All
Budget
Budget
Overall
Hires
Hire
Would like to leverage more
Would like to leverage more
Would like to leverage more
Would like to leverage more
Would like to leverage more
Would like to leverage more
Would like to leverage more
Would like to leverage more
Would like to leverage more
Currently leverage
Currently leverage
Currently leverage
Currently leverage
Currently leverage
Currently leverage
Currently leverage
Currently leverage
Currently leverage
External
38% 62% 16% 84% 41% 59% 44% 56% 38% 62% 35% 65% 48% 52% 36% 64% 47% 53%
Resources
Live
37% 63% 33% 67% 37% 63% 40% 60% 37% 63% 28% 72% 48% 52% 29% 71% 56% 44%
Training
Networks 36% 64% 29% 71% 29% 71% 49% 51% 34% 66% 30% 70% 37% 63% 30% 70% 43% 57%
Recorded
35% 65% 24% 76% 47% 53% 39% 61% 37% 63% 23% 77% 57% 43% 23% 77% 60% 40%
Training
Events 35% 65% 26% 74% 43% 57% 40% 60% 36% 64% 30% 70% 40% 60% 31% 69% 52% 48%
Mentoring 30% 70% 23% 77% 24% 76% 43% 57% 33% 67% 27% 73% 46% 54% 24% 76% 42% 58%
Those with bigger functions and larger budgets use
more of these tactics, as do those that feel they have
all capabilities.
Those that feel they have an increased need, feel they
need to utilise more methods – there’s a sense they
feel they need to catch up.
18 Annual Membership Survey 2020-2021Annual Membership Survey 2020-2021 19
Other Findings
What is your ratio of internal to 90% internal,
10% external
7%
external hires (i.e. 80% internals to 80% internal,
5%
20% externals) 20% external
70% internal,
5%
Just over half of respondents have 30% or fewer 30% external
internal hires – mostly external is the norm. 60% internal,
10%
40% external
There’s a slight rise over last year for large majority 50% internal,
6%
external hires (8%pt more at either 80% or 90% 50% external
external). 40% internal,
15%
60% external
Those that feel they have all capabilities are much 30% internal,
23%
more likely (27%) to have 90% external hires. 70% external
20% internal,
14%
80% external
10% internal,
15%
90% external
Do you have separate resource/ 45%
Employer Branding 52%
functions to cover the following areas? 3%
In most cases, most of these areas sit within the main 37%
Contingent/Temp
resourcing team. Recruitment
60%
3%
That’s a bit less true for Contingent and Temp
32%
Recruiting.
Emerging Talent 65%
But for Employer Branding, nearly half of recruiters 3%
have, or are considering, separate resource to create, 32%
present or enhance their brand. Exec Recruitment 66%
2%
32%
Projects 67%
2%
24%
Sourcing 72%
4%
17%
Talent Intelligence 79%
3%
16%
Candidate
82%
Experience
2%
Yes No Considering itDo you have separate resource/ Employer Branding
45%
38%
functions to cover the following areas?
Contingent / Temp 37%
There’s been a big increase in separate resource Recruitment 12%
functions within Exec and Contingency / Temp
32%
recruitment. Emerging Talent
22%
32%
Exec Recruitment
14%
32%
Projects
27%
24%
Sourcing
31%
17%
Talent Intelligence
24%
16%
Candidate Experience
29%
This Year Last Year
Do you currently outsource all or part What percentage of your vacancies
of your recruitment process? were filled by agencies in the last
A large majority keep the process in-house, and just year?
about everyone holds on to at least some - this is very Agencies have a part to play, but for almost 90% of
similar to last year. employers, they can handle 75%+ of roles themselves -
Those with the smallest teams are much more likely this is similar to last year.
(80%) to keep all of their process in-house. This is consistent across all our segments.
76% or more
1%
26 to 50%
8%
part
26% Yes - all 51 to 75%
1% 2%
Yes -
11 to 25%
28%
No
69% Less
than 10%
No, but it
61%
is under
consideration
4%
20 Annual Membership Survey 2020-2021Annual Membership Survey 2020-2021 21
Workload 0-5
6%
7%
Those with smaller teams and budgets also tend to
20%
have smaller requisition workloads. 6-10
30%
31%
11-20
33%
26%
21-30
22%
14%
What is the average requisition workload handled by an individual 31-50
7%
recruiter at any one time?
3%
What would you consider to be the optimum average requisition 51-100
workload handled by recruiter at any one time for your 1%
organisation?
0%
Over 101
0%
At face value, the actual requisition workload tends to
match the optimum workload quite closely.
Optimum
>
However, when we look at the consistency of the Workload
responses, we get a slightly different picture. 21%
• For about half, 48%, their team have about the right
workload.
Workload
=
• But for 31% they have a greater workload than is Optimum
optimum. 48%
• And for 21%, they are perhaps underutilised, at
least now. Workload
>
Optimum
31%
In your organisation, do recruitment Recruitment/ 51%
Resourcing team
budgets sit with…? 47%
19%
Half of the time, the recruitment team holds the HR
33%
recruitment budget. This is slightly more likely in
Line Manager/ 17%
organisations with an EB function, or with larger
Function 12%
resourcing teams and budgets. “Other” arrangements
include a mix of people holding budgets, or being held 6%
Other
by Executive team. 0%
5%
It possibly seems as though HR has a far smaller Finance
0%
hold on recruitment budgets – but we have added
more options this year; this may have allowed a more 2%
Elsewhere
accurate response. 7%
1%
Procurement
0%
This Year Last YearOther
2%
Do you have a separate budget
for recruitment marketing? Yes
32%
Under a third have a separate recruitment marketing
budget.
There’s been a move of about 4%pts from No to Yes
since last year.
Larger teams, those with most budget and those with
No
an EB team are more likely to have their own budget. 66%
Apprenticeship 60%
programme 60%
52%
A graduate programme
42%
Which of the following do you currently An internship 37%
have in place? programme 37%
A work experience 26%
Apprenticeships are consistently offered across programme 35%
segments. Larger teams have more programmes in
place, but those that have a predicted increase in hires A summer placement 20%
are quite a lot more likely (28%) to have none of these programme 23%
in place. 18%
None of the above
18%
There’s a substantial rise in graduate programmes,
with a drop in work experience programmes. A school leaver 13%
programme 12%
8%
An MBA programme
3%
This Year Last Year
Referral schemes are consistently offered across An employee referral 80%
segments. scheme 72%
Larger teams have more programmes in place, but A talent pool/ 56%
community 52%
those that have a predicted increase in hires are quite
a lot more likely (14%) to have none of these in place. Diversity recruitment 31%
programme 27%
There’s been a rise in all these methods, especially
alumni schemes, since last year. Armed Forces veteran 21%
programme 18%
15%
An Alumni scheme
5%
9%
A social referral scheme
7%
7%
None of these
0%
1%
Other (please specify)
6%
22 Annual Membership Survey 2020-2021What percentage of your hires come 0-25% 73%
from your employee referrals scheme? 26-50% 13%
Only a minority of hires come from referral – a
51-75% 0%
consistent result with last year.
Those with the biggest budgets are more likely to get 76-100% 0%
26-50% of their hires from referral (23%).
N/A 14%
Aggregators
Do you ever use any of the following (such as Indeed)
65%
for recruitment…? Online recruitment
45%
marketplaces
Aggregators are the only tactic used by over half of
PPC (Pay per Click) 31%
recruiters – this is a similar result to last year, but with
a 3-4%pt increase for Programmatic/Fixed fee sites/ Fixed fee
28%
PPC/Aggregators. recruitment sites
SEO (Search Engine
26%
Use of aggregators is consistent across segments. Optimisation)
Larger teams, those with bigger budgets and those Programmatic
18%
that feel they have all capabilities are more likely to advertising
use: marketplaces, PPC, SEO. Do not currently
14%
use any
Social Media LinkedIn
87%
99%
Only four platforms are used by over 20% of 9%
recruiters: Instagram, Twitter, Facebook and the Facebook
55%
dominant LinkedIn.
2%
Twitter
Linkedin dominates as the most successful social 43%
media channel for the majority of respondents. 2%
Instagram
29%
Recruiters should perhaps understand other social
channels are less likely to be the most effective 0%
YouTube
recruitment channel. But – given the need to project 15%
and share employers’ reputation – it appears likely
Niche blogs / 0%
these other channels have a crucial role to play. forums etc 14%
All segments use LinkedIn to a high degree. Larger 0%
Google+
recruiting teams use more of the most popular social 8%
media. 0%
Xing
6%
This is a similar result to last year, with a rise of 6-7%
pts in use for Instagram/Niche Blogs/YouTube. 0%
Snapchat
2%
LinkedIn has had a 12% pt rise as most effective,
Facebook has had an 8% decline. 0%
Pinterest
2%
0%
Tik Tok
1% Which of the following
social media
Do not use any of platforms do you
the above 0% use for attractiing,
engaging and recruiting
0% candidates?
Spotify
0% Which social media tool
has been most effective
0% in your recruitment
Tumblr
0% (choose one only)?
Annual Membership Survey 2020-2021 23What types of job boards / Mainly generalist
e.g. CV-Library,
46%
58%
CV databases do you use? Totaljobs, reed.co.uk
Mainly specialist 19%
e.g. industry/role
Most use job boards, with generalist boards used by specific boards 14%
a majority of users – this probably reflects many jobs
23%
being “general” and/or these boards drawing a very About equal
17%
wide range of candidates.
Don’t use job boards/ 12%
Those with lower budgets and those with increased CV databases 11%
hiring needs are more likley to use Generalist boards –
but since last year, there has been a move away from This Year Last Year
generalist boards.
Have you seen an increase or decrease 55%
Linked In 2%
in the number of hires coming from 43%
these sources 32%
Most sources have seen consistent response rates, Job Boards (generalist) 16%
53%
with the largest dip coming from CV databases.
29%
But social media, general job boards and especially Social Media 5%
LinkedIn have all become much more useful sources 65%
of candidates.
18%
There is a fairly consistent picture across all segments, Job Boards (specialist) 14%
but those who feel they have all capabilities have seen 68%
less of an increased response from LinkedIn, instead 13%
seeing it stay the same. CV databases 18%
70%
11%
PPC 10%
78%
Increased Decreased Stayed the same
Increased number of hires coming Linked In
55%
52%
from these sources
32%
Job Boards (generalist)
There’s been a 10% pt increase in general job boards 23%
being seen to generate more candidates. LinkedIn has
29%
consistently generated more candidates, but the rate Social Media
35%
has perhaps slowed for social media.
18%
Job Boards (specialist)
We should bear in mind that volume of candidates has 15%
been an issue for some this year; more response may
13%
not always be a good thing. CV databases
16%
11%
PPC
14%
This Year Last Year
24 Annual Membership Survey 2020-2021Annual Membership Survey 2020-2021 25
No
     Do you currently have a corporate                                                      6%

     careers site?
     Almost everyone has a careers site, and 1%pt more
     than last year.

     For smaller teams and those with less budget the rate
     is 90-91%.

                                                                                                          Yes
                                                                                                          94%

     How would you rate your careers site?                                Very Good                    15%

     Opinions are mixed. Just over 50% think that think                       Good                                             36%
     their careers site is Good/Very Good, last year that
     was 46%, so there’s some improvement.                                  Average                                      30%

     Those that have all capabilities, have an EB function, or                 Poor                12%
     a larger resourcing function rate their site as better.
                                                                          Very Poor      4%

                                                                      Not Applicable   2%

     How long ago was your current careers                                                  6%
     website...                                                                                9%
                                                                                                    14%
                                                                     First launched?
     Many sites are starting to show their age with 63%                                                            26%
     being over 2 years old.                                                                                                   37%
                                                                                              8%
     However, content has tended to have been refreshed
     more recently, with 61% refreshed in the last year.                                                     20%
                                                                                                          19%
     Those that have the largest budget are most likely to                                                         25%
                                                                       Re-designed?
     have refreshed this year, those that feel they have all                                     10%
     capabilities are most likely to have redesigned this year.                           5%
                                                                                                              22%
     There was a similar result last year, but we have seen a
     slight slowdown in work on careers sites this year.                                                                             41%
                                                                                                             20%
                                                                                                       16%
                                                                  Content refreshed?
                                                                                         4%
                                                                                       2%
                                                                                                         18%

                                                                             Within the last 6 months               6-12 months
                                                                       1-2 years       2-4 years             Over 4 years              N/A

26     Annual Membership Survey 2020-2021
How would you rate your career site in 21%
41%
terms of…? 25%
Visibility
7%
For a majority, their site is good or very good for all
2%
these features.
4%
They rate all of these features very similarly – perhaps
23%
suggesting a lack of maturity / understanding in the
39%
difference that these can make to the performance of
27%
the careers site. Ease of Application
6%
2%
4%
21%
34%
30%
Appearance
9%
3%
4%
20%
40%
27%
Accessibility
8%
2%
4%
23%
40%
23%
Mobile Friendly
8%
1%
4%
23%
38%
22%
Mobile Optimised
11%
1%
6%
Very Good Good Average
Poor Very Poor N/A
And looking at the consistency it shows the same story. All the same 23%
5 the same 49%
Consistency
4 the same 17%
72% give their site the same rating across five or more
features. All Others 11%
Annual Membership Survey 2020-2021 27How would you rate your career site in Very Good
22%
20%
terms of…?
39%
Good
Looking at the overall averages versus last year. Then 37%
we see that people tend to be a little happier with their
26%
career sites with a greater % of Very Good and Goods. Average
31%
26%
Poor
31%
8%
Very
10%
2%
Poor
5%
This Year Last Year
What is your average annual cost Under £1000
($1600)
53%
per hire (attraction and selection £1000 to £2500
30%
($1600 - $4000)
costs only)?
£2501 to £4000
12%
($4000 - $6500)
This is a very similar result to last year.
Over £4000
5%
Those with the biggest changes in recruitment ($6500)
(increase and decrease) and those with the smallest
budget have a smaller average cost per hire.
What is your average time to hire? Under 4 weeks
15%
17%
75% can get the job done in under 2 months.
58%
4 - 8 weeks
There’s a similar result for all, but those with the 49%
largest budgets tend to take longer to hire. 21%
8 - 12 weeks
27%
There’s been a reasonable shift from 8-12 weeks to
4-8 weeks – hence it would appear that recruitment Over 12 weeks
5%
processes have become more efficient and quicker. 6%
This Year Last Year
What is your vacancy fill rate? Less than 10%
3%
3%
A large majority of recruiters are filling a large majority 7%
of vacancies. 11-25%
8%
Those that feel they have all capabilities have the best 16%
51-75%
success rate, 86% say they fill 76-100%. 27%
73%
This seems to suggest that there are greater 76-100%
61%
efficiencies being seen through in-house recruitment
teams. This Year Last Year
28 Annual Membership Survey 2020-2021Annual Membership Survey 2020-2021 29
What do you use to track online My ATS 54%
metrics?
we don’t... 19%
The ATS is by far the most commonly used to track
metrics – so the capability of the ATS has a big impact Google Analytics 12%
on how well these metrics can be followed.
Excel 8%
“Other” is usually a mix of the above and/or use of data
analysis/visualisation tools. Other (please specify) 7%
The smallest functions are most likely to not make Omniture 0%
measurements, those with the largest budgets use
Google Analytics more. Webtrends 0%
This is a similar result to last year, but with more Access 0%
recruiters making measurement (and fewer using
Excel).
Do you use an Applicant Tracking No
System (ATS) or other recruitment 7%
platform?
A large majority use an ATS or similar – with a similar
picture across segments - and that’s up from 88% last
year.
Yes
93%
Do you use an applicant tracking
system for onboarding?
Just under half follow this through to onboarding.
Larger teams, those with bigger budgets, those that
have all capabilities and separate EB function are all
quite a lot more likely to use an ATS for onboarding.
“Yes” is up from 46% last year. No Yes
51% 49%How likely is your organisation to We already use
stand-alone
12%
11%
adopt onboarding software in the next onboarding software
12 months? We already use
onboarding module
32%
of our ATS 31%
Most already are using an ATS/other software for
onboarding – but nearly a quarter have no plans to. We are actively 17%
investigating
onboarding software 26%
Those with larger budgets and a separate EB function
are more likely to use onboarding software now. We’re interested in 16%
onboarding but not
actively investigating 13%
Compared to last year, recruiters appear more fixed in
their choices re: Onboarding software – if they don’t
We have no plans to use 22%
have it now, they’re less likely to get it compared to onboarding software 19%
last year.
This Year Last Year
Lets look at the use of AI... Do you currently use 8%
a bot for candidate 79%
Currently there’s very little uptake for the use of bots attraction? 12%
across the attraction and selection process, but some
Do you currently use 10%
consideration.
a bot for candidate 76%
engagement? 15%
The larger and bigger budgeted functions and those
that feel they have all capabilities are far more likely to Do you currently use 7%
use AI in this way. a bot for candidate 82%
screening? 11%
8%
Do you use a bot for
81%
scheduling purposes?
11%
Yes No Considering it
How would you rate… Very Good
26%
28%
The ATS as product and service are equally well-
37%
regarded - in both cases 63% find them Good or Very Good
35%
Good. This is a similar result to last year.
19%
The results are similar across segments, but those Average
16%
that see an increase in hiring rate their ATS more
7%
highly. Poor
10%
8%
Very
7%
3%
Poor
5%
Your ATS as a product Your ATS provider as a service
30 Annual Membership Survey 2020-2021BE A TALENT ACQUISITION MASTER CHEF
The recipe for hiring perfection
There’s a wealth of data locked inside your Applicant Tracking
System, but just how easy is it to get the insights you need?
Eploy’s ATS & Recruitment CRM includes award-winning
self-service dashboard technology that will help you to serve up
a storm in your next team meeting.
Whether you need to know where best to advertise your
vacancies, track your progress toward your D&I goals or
understand what candidates really think about your recruitment
process, Eploy has all the ingredients you need.
Download our free Recruitment Metrics Cookbook today
and see what delicious data insights you can create:
https://eploy.co.uk/cookbook
Annual Membership Survey 2020-2021 3132 Annual Membership Survey 2020-2021
Which Applicant Tracking System eArcu 27%
(ATS) or other recruitment platform Eploy 12%
do you use? Other (state in comments section) 12%
Workday 9%
There’s a wide range used, but eArcu is a clear
preference, a similar pattern to last year. Successfactors 7%
No “Other” response had more than three mentions. Taleo 6%
Avature 5%
TribePad 3%
Greenhouse 3%
Workable 2%
Oleeo (formerly WCN) 2%
Smartrecruiters 2%
Hireserve 2%
Modern Hire 1%
Yes - Cornerstone SABA Talent Link 1%
iCIMS 1%
Talent Source 1%
Yes - Cornerstone Recruiting 1%
Kenexa 1%
Jobvite 1%
hireful 1%
webrecruit 0%
Virtual Edge 0%
Peoplefluent 0%
Lever 0%
Jobtrain 0%
Jobs2Web 0%
Yes - Recruitive 0%
Peopleclick 0%
Change Work Now 0%
Ceridian 0%Annual Membership Survey 2020-2021 33
34     Annual Membership Survey 2020-2021

     Which applicant tracking system do                                           eArcu                          28%

     you use for onboarding?                                                      Eploy                    20%

                                                                               Workday                   16%
     eArcu is also the preference for onboarding – and
     again we saw similar results last year.             Other (state which in comments)            8%

                                                                                  Taleo          6%

                                                                         Successfactors          5%

                                                                            Greenhouse         4%

                                                                               TribePad     2%

                                                                                  iCIMS     2%

                                                                               Hireserve    2%

                                                                               Workable     1%

                                                                              webrecruit    1%

                                                                   Oleeo (formerly WCN)     1%

                                                                           Talent Source    1%

                                                                                Jobtrain    1%

                                                                                  hireful   1%

                                                                                Ceridian    1%

                                                                                Avature     1%

                                                                            Virtual Edge 0%

                                                                         Smartrecruiters 0%

                                                                              Recruitive 0%

                                                                             Peopleclick 0%

                                                                            Peoplefluent 0%

                                                                            Modern Hire 0%

                                                            Cornerstone SABA TalentLink 0%

                                                             Yes - Cornerstone Recruiting 0%

                                                                                 Kenexa 0%

                                                                                 Jobvite 0%

                                                                             Jobs2Web 0%

                                                                      Change Work Now 0%
…and with these changes have come a host Hiring teams were
of new challenges for hiring teams. Things
like getting to the quality with ever increasing
already busy, have always
volumes of applications, living the values of needed to be agile and
an empathetic, transparent brand in a period
of heightened public scrutiny and candidate
that candidate experience
angst or even scaling up and down and building a diverse,
recruitment operations across different
regions, brands and hiring types (think more
'skills-first' workforce has
digital people, less physically onsite) to meet always been a priority
changing business needs. These changes are
affecting all businesses differently.
…and our shift to support clients has just
The amazing thing amongst all this change been a continuation of the journey we were
is how we have adapted. The question is already on. So, if you want a technology that
can grow with you, whatever comes next –
chose: TalentLink – the platform built for
Did your tech adapt smarter recruiters.
with you?
At Cornerstone, through our enterprise class
Talent Acquisition platform – TalentLink, we
have helped organisations not only adapt, but
thrive. We understood:
Find out more
Cornerstone is the global talent management software provider that is pioneering
solutions to help organisations realise the potential of the modern workforce.
For more info, visit csod.co.uk/recruiting
Annual Membership Survey 2020-2021 35Do you use any of the following online Live Video Interviewing
(i.e. skype, google
53%
19%
testing techniques as part of your hangout)
selection process? Psychometric Tests
45%
52%
Over 50% use live video interviewing and psychometric 32%
tests – with personality/aptitude/situational judgement Personality Tests
26%
tests used by between a quarter and a third.
30%
Aptitude Tests
• Video interviewing is used consistently across all 22%
segments. Situational Judgment 27%
Tests 18%
• Those with the largest budget and those with an
increase in hires are more likely to use more of the None of the above
17%
more popular methods. 27%
Asynchronous Video 14%
• Those that have seen an increase in hires are much Interviewing 8%
more likely to use asynchronous video interview.
8%
There have been variations since last year – but Realistic Job Preview
7%
there has been a huge rise in the use of Live Video
5%
Interviewing (and a small rise for asynchronous too). Job Profile Gamification
2%
Virtual 4%
Reality assessment 1%
This Year Last Year
Do you use any of the following as part Telephone Interviewing
87%
76%
of your selection process?
Competency Based 84%
Telephone and video interviews, along with Assessment 74%
competency assessment are used by a large majority.
79%
Video Interviewing
Perhaps surprisingly, assessment centres – 35%
traditionally run in-person – are used by >50%. Perhaps 53%
there has been a quick switch to online and/or an Assessment Centres
53%
intention to revert once Coronavirus poses less risk.
Strength Based 21%
This is a fairly consistent picture across segments Assessment 21%
except that: 0%
None of the above
0%
• Those with increased hires and all capabilities are
more likely to use telephone interviews This Year Last Year
• Bigger teams / budgets are more likely to use video
interviews
• Those that have all capabilities or smaller budgets
are more likely to use Assessment Centres.
Again, there’s been a big rise in video interviewing year-
on-year.
36 Annual Membership Survey 2020-2021Looking ahead
We’ve seen that recruiters want to address Diversity But… Covid is – inevitably - a dominant challenge
and Inclusion, they want to better manage their
Employer Reputation, they want to examine and
measure their practice more, and they have other What would you say is the biggest
areas for improvement. recruitment challenge you’re facing?
Annual Membership Survey 2020-2021 37What would you say is the biggest Covid 27%
recruitment challenge you’re facing? Quality/Scarce Skills 14%
As well as being – by far – the biggest challenge
Resources and Budget 12%
by itself, it has a big influence on many of the other
categories of challenge.
Changing Business Needs 8%
• “The biggest challenge would be the current
pandemic. Our industry was greatly affected by this Diversity and Inclusion 6%
since we provide workspace solutions. COVID-19
Changing Market 6%
restricts our employees and clients from working
or gathering in a shared workspace”
Remote working 6%
• “Market impact due to COVID-19”
Volume of applications 4%
• “Covid and the effect on recruitment levels and the
wider Group budgets” Processes 4%
• “Uncertain climate due to Covid-19 and it has had Attraction 4%
an adverse effect on the retail and travel industry”
Attrition 3%
• “Unsurprisingly Covid. Firstly for the pause in hiring,
then subsequently for the volume of applications of Capabilities 2%
poor quality post lockdown”
Candidate Inertia 2%
• “Covid and the element of the unknown that this
introduces in terms of the job market” Candidate Experience 1%
• “Impact on number of vacancies due to COVID” Brexit 1%
• “Obviously COVID has had a huge impact on our
business. The challenge we face is not being able
to plan effectively for the future and budgets being
very tight”
The effect of the pandemic has:
• cut into resources and budgets
• forced remote working
• means business needs have changed – perhaps
drastically
• often created a much greater volume of
applications
• whilst meaning that the hardest-to-find candidates
are less likely to move
…and that’s not the end of the impact.
Whilst the end may be in sight for the virus – its
effects will be felt for a long time yet.
On the other hand, who, a year ago, would have
believed that Brexit would be a concern for only a tiny
minority?
38 Annual Membership Survey 2020-2021Annual Membership Survey 2020-2021 39
The people we heard from
How many countries are you 1
49%
57%
personally responsible for recruiting
for? (or managing the recruitment up to 5
30%
29%
processes for)
8%
6 to 10
6%
3%
11 to 15
3%
10%
more than 15
7%
This Year Last Year
How many members of staff do you 1
10%
have working in your Recruitment 10%
Function? 2 to 5
38%
48%
18%
6 to 10
17%
16%
11 to 20
13%
9%
21 to 50
9%
5%
51 to 100
3%
4%
101 or more
2%
This Year Last Year
What is your recruitment budget Under £250K 34%
($400k) 50%
for 2021?
Under £500k 15%
($800k) 20%
£501k - £1m 16%
($801k - $1.6m) 13%
£1m - £2m 6%
($1.6m - $3.3m) 10%
£2m - £3m 2%
($3.3m - $4.9m) 5%
Over £3m 5%
($4.9m) 2%
22%
N/A
This Year Last YearWhat most accurately describes your
industry?
Accountancy 3.1%
Advertising / PR 0.6%
Agriculture / Fisheries / Farming 0.0%
Banking / Financial Services 10.4%
Charity / Voluntary 5.5%
Civil or Structural Engineering 4.9%
Consulting / Strategy 2.5%
Consumer goods – FMCG 5.5%
Consumer goods – non FMCG 0.6%
Design / Creative 0.0%
Education 2.5%
Engineering / Manufacturing 3.7%
Health / Care 4.3%
Hospitality / Catering 2.5%
Housing / Regeneration / Environment 0.0%
IT 5.5%
Law 4.3%
Local Government 1.2%
Marketing 1.2%
Media 0.0%
Pharmaceutical 1.2%
Property 1.2%
Recruitment 1.8%
Research / Science 1.2%
Retail 4.9%
Telecoms 2.5%
Transport and logistics 8.0%
Utilities / energy (gas, nuclear, oil, etc.) 2.5%
None of the above 1.2%
Other (please specify) 17.2%
40 Annual Membership Survey 2020-2021Annual Membership Survey 2020-2021 41
Make smarter decisions.
Slash recruitment spend and time-to-hire,
improve the candidate experience, understand
your ED&I data and ramp-up team productivity.
Applicant Tracking System
Video Interviewing
Onboarding
CRM & Sourcing
Contractor Management
See how we can help you.
tribepad.com/demowww.thefirm-network.com
info@thefirm-network.com
@thefirmrecruits
The Forum for In-House Recruitment ManagersYou can also read