DPDHL Group Presentation - Investor Relations August 2018 - Deutsche Post DHL Group
←
→
Page content transcription
If your browser does not render page correctly, please read the page content below
DPDHL Group Presentation
Investor Relations
August 2018

Q2 2018 HIGHLIGHTS
Q2 development in line with recently adjusted full-year expectations
DHL: unchanged positive momentum in all divisions
- Express continues going from strength to strength
- DGFF recovery progressing well
PeP Q2 performance in line with recently adjusted 2018 guidance
- Planned measures on direct & indirect costs and yield initiated
- Some sequential improvement but principal challenges remain in Q2
Good Q2 OCF performance brings YTD FCF development closer to last year - while we
continue to invest into our growth businesses
PeP issues being addressed, DHL performance on track,
2018 & 2020 EBIT guidance confirmed
DPDHL GROUP INVESTOR RELATIONS PRESENTATION | AUGUST 2018 PAGE 2
GROUP PORTFOLIO STRONGLY DIVERSIFIED IN TERMS OF TOPLINE
DRIVERS AND MANAGEMENT OF BUSINESS CYCLES

                                        B2C

                            High
                                       Parcel
                                      Express
                                                                   B2B
                                                                 Express
                            Growth
                                                                           DGFF
                                                  Supply
                                                  Chain

                                      Post
                            Low

                                     Low             Exposure to GDP         High

         Well balanced and diversified portfolio of businesses and their respective drivers
DPDHL GROUP INVESTOR RELATIONS PRESENTATION | AUGUST 2018                                     PAGE 3
CONTINUOUS MARGIN IMPROVEMENT REMAINS TOP PRIORITY ON
DIVISIONAL AGENDAS

Further potential to optimize divisional profitability – esp. in DGFF

              Asset intensive: Express and PeP                                          +                    Asset light: DGFF and DSC
 EBIT                                                                                       EBIT
 Margin1)                                                                                   margin1)

                                                                                11.9%                                                    4.1%
   8.1%

                                                                                7.4%          2.7%                                       2.5%
   4.4%
                                                                                              1.8%

          Q4 2010                                                        Q2 2018                       Q4 2010                           Q2 2018
                                  PeP             Express                                                             DSC     DGFF

 1) Rolling 12 month EBIT margins, DGFF adjusted for NFE write-off in Q3 2015

            Group margin of 6.1% is up +270bp since 2010; +110bp since 2013
DPDHL GROUP INVESTOR RELATIONS PRESENTATION | AUGUST 2018                                                                                   PAGE 4
REMINDER & CONFIRMATION:
OVERVIEW OF OUR PEP MEASURES
PeP P&L Parcel Germany Post
Revenue 1• BALANCE GROWTH & YIELD •1 REGULATORY PRICE REVIEW
PRODUCTIVITY MEASURES – supported by
Direct costs 2
further automation / digitalization
Indirect costs • OVERHEAD RESTRUCTURING PROGRAM
3
Reporting alignment Shift of selected growth initiatives from PeP to Corporate Incubations
Taking significant measures in 2018 to establish sustainable cost structure for ongoing
structural shift in PeP portfolio
DPDHL GROUP INVESTOR RELATIONS PRESENTATION | AUGUST 2018 PAGE 5PEP MEASURES: CURRENT STATUS SUMMARY
Problem Measures Measures Cost
Identification Developed Initiated (Q2 18)
1
Pricing
Measures
Direct cost
2 € -10m
(Productivity)
Indirect Cost
3 € -51m
(Restructuring)
To come Executed
DPDHL GROUP INVESTOR RELATIONS PRESENTATION | AUGUST 2018 PAGE 6PEP EBIT BRIDGE TOWARDS CONFIRMED 2020 GUIDANCE
EBIT contribution, in EUR m
2020 vs 2018 240
+150-250
~1,700
1 + 0-100
1,000 +150-250
2 + >200
3
~1,000
EBIT 2018 Revenue Staff Costs Material costs Productivity Overhead cost Parcel EBIT
base1) improvement improvement International Guidance
(staff & material (staff costs) 2020
costs)
1) excl. ~ EUR -500m restructuring costs and EUR +108m pension revaluation
DPDHL GROUP INVESTOR RELATIONS PRESENTATION | AUGUST 2018 PAGE 72018 & 2020 GUIDANCE
EBIT,
2018 2020
€ bn
PeP ~0.6 ~1.7
DHL ~3.0 ~3.7
Corporate
~ -0.42 ~ -0.35
Functions
Group ~3.2 >5.0
FY 2018:
Free Cash Flow: > € 1.0bn (excl. debt-financed Express intercontinental fleet renewal)
Tax rate: ~ 14% (from ~18%)
Gross Capex (excl. leases): ~ € 2.5bn plus ~ € 0.2bn for debt-financed Express intercontinental fleet renewal
DPDHL GROUP INVESTOR RELATIONS PRESENTATION | AUGUST 2018 PAGE 8GROUP STRUCTURE: ALL DIVISIONS FINANCE THEIR OWN GROWTH
CAPEX AND CONTRIBUTE TO FREE CASH FLOW & DIVIDEND
EUR m OCF Capex
OCF vs Gross Capex by Division, 2010-17
2000 PeP 2000 Express
1500 1500
1000 1000
500 500
0 0
2010 2011 2012 2013 2014 2015 2016 2017 2010 2011 2012 2013 2014 2015 2016 2017
2000 DGFF 2000 DSC
1500 1500
1000 1000
500 500
0 0
2010 2011 2012 2013 2014 2015 2016 2017 2010 2011 2012 2013 2014 2015 2016 2017
All divisions are self-financing and contribute to Group shareholder return
DPDHL GROUP INVESTOR RELATIONS PRESENTATION | AUGUST 2018 PAGE 9TURNAROUND IN CASH GENERATION ALLOWS US TO FINANCE
GROWTH INVESTMENTS AND SHAREHOLDER RETURNS
in m EUR
1,9271) FCF more than covering (rising)
dividend payment since 2013
1,724
1,669 Cash Flow turnaround mainly
driven by
1,4441) 1,432
1,345 EBIT growth
1,270
Tailing off of provision outflows
968 1,030 1,027 (esp. US domestic Express
1,030 846 restructuring)
725 749 786 7232)
Increased CF focus and
management incentives
484
444 Sustainable FCF performance is
basis for continued investments in
organic growth and attractive share-
holders returns – in line with our
Finance Policy
2010 2011 2012 2013 2014 2015 2016 2017
FCF Dividend payment
1) Adjusted for pension funding (2016: 1bn, 2017: 0.5bn); 2) Adjusted for pension funding (EUR 2bn) and non-recurring items
DPDHL GROUP INVESTOR RELATIONS PRESENTATION | AUGUST 2018 PAGE 10DPDHL GROUP FINANCE POLICY
MAIN PRINCIPLES CONFIRMED AND EXECUTED UPON
Dividend of EUR 1.15 for FY2017
FINANCE POLICY
Underlying Payout Ratio 1)
€1.15
Target / maintain rating BBB+ €1.05
€0.85 €0.85
€0.80
Dividend payout ratio to remain €0.65
€0.70 €0.70
between 40–60% of net profit 60%
(continuity and Cash Flow 59% 58%
53% 50% 52% 40%
performance considered) 49% 46% 48%
2010 2011 2012 2013 2014 2015 2016 2017
Excess liquidity will be used for
share buybacks and/or
extraordinary dividends Dividend payments of EUR ~1.4bn to DPDHL shareholders
on April 27, 2018
1) Adjusted for Postbank effects as well as non-recurring items when applicable
DPDHL GROUP INVESTOR RELATIONS PRESENTATION | AUGUST 2018 PAGE 11WRAP UP
Q2 confirmed expected and known trends, positive as well as negative…
DHL Divisions have the right agenda and are executing successfully
PeP issues identified, measures initiated in all three focus areas
Cash flow generation allows to maintain growth investments independent of current PeP
challenges
…PeP issues in Germany are being thoroughly addressed, all further priorities also
remain in focus!
Fully committed to deliver on our Strategy 2020 targets
DPDHL GROUP INVESTOR RELATIONS PRESENTATION | AUGUST 2018 PAGE 12Divisional Information DPDHL GROUP INVESTOR RELATIONS PRESENTATION | AUGUST 2018 PAGE 13
DPDHL GROUP AT A GLANCE
                                             Network businesses – asset intensive                Brokerage & Outsourcing – asset light

                         Divisions
                                        Post - eCommerce-                                    Global Forwarding
                         -EUR m -                                        Express                                         Supply Chain
                                               Parcel                                             Freight

 2017
                         Revenue                18.168                    15.049                    14.482                   14.152
 Group revenues
 € 60.4bn                EBIT                    1.502                    1.736                       297                      555
                         Margin                  8.3%                     11.5%                      2.1%                     3.9%
 EBIT
 € 3.741bn               Staff (FTE)            179.600                   86.313                    42.646                   149.042

                                        USO Provider for letter   Core product Tide-        Brokerage of transport   Customized,
 Market                  Products                                                           services in Air, Ocean   outsourced logistics
                                        products in Germany.      Definite International
 capitalization                         Parcel operations in      (TDI): premium cross-     and Road freight         solutions through full
 € 49bn per                             Germany, Europe and       border parcels and                                 value chain
 31.12.2017                             selected international    document delivery
                                        markets

                         Geographies    Germany - Europe          220 countries and         >150 countries and       >50 countries and
                                        Americas -Asia Pacific    territories               territories              territories
 Approximately
 500,000 employees                      61% letter mail           34% global market         # 1 in air freight       #1 globally
                         Market Share                                                       # 2 in ocean freight     6.2% market share
 in more than 220                       Germany                   share
                                        45% parcel Germany        # 1 Europe, MiddleEast,
 countries/territories                                            Africa and Asia, # 3 US

DPDHL GROUP INVESTOR RELATIONS PRESENTATION | AUGUST 2018                                                                             PAGE 14
DISRUPTION IS EVERYWHERE: INNOVATION IS THE SOLUTION
DHL Trend - Radar
In order to stay ahead of the curve, we have to think in a creative way and not be
afraid to self-disrupt
DPDHL GROUP INVESTOR RELATIONS PRESENTATION | AUGUST 2018 PAGE 15DPDHL INVESTMENT PROFILE
Global Powerhouse of Logistics Clear Strategic Direction Sustainable Growth Momentum
Our roadmap for margin and profit Unique position for e-commerce
improvement
Increasing Margins and Returns Investing for Growth Delivering Attractive Returns
Divisional self-help agendas Innovation, quality & customer Committed to FCF growth and
centricity improving shareholder returns
DPDHL GROUP INVESTOR RELATIONS PRESENTATION | AUGUST 2018 PAGE 16Focus. Connect. Grow.
POST, E-COMMERCE & PARCEL
DPDHL GROUP INVESTOR RELATIONS PRESENTATION | AUGUST 2018 PAGE 17PeP: KEY VOLUME TRENDS INTACT
Q2 2018
Letter volume (MC & DM) decline of -3.2%
Germany Volume yoy Revenue yoy
reflects stable e-substitution trends and 1.0 more
Mail 1,808m -2.8% € 1,484m -1.1% working days
Communication
2017 comparison base including election benefit
Dialogue 2,001m -3.5% € 530m -2.4%
of ~2% explains higher than usual decline of
Marketing
letter volume/working day of -4.8%. Long-term
Parcel 350m +10.4% € 1,310m +9.3% assumption remains 2-3% decline p.a.
Germany
Parcel Germany continues strong trajectory with
ongoing slightly negative pricing/mix effects
yoy,
International Revenue yoy
excl. FX
International expansion continues at good pace
DHL Parcel € 546m +13.3% +14.5%
Europe as we build out our networks in strongly growing
ecommerce markets outside Germany
DHL eCommerce € 397m +7.6% +14.1%
DPDHL GROUP INVESTOR RELATIONS PRESENTATION | AUGUST 2018 PAGE 18PeP – DIVISIONAL RESULTS Q2 2018
€m Q2 2017 Q2 2018 Chg. Management comments
Organic growth of +4.1% with +1.0 more WD, stable mail decline trend
Revenue 4,267 4,410 +3.4%
and ongoing strong Parcel growth in Germany and International
Decline in line with recently adjusted full-year guidance – includes first
EBIT PeP 260 108 -58.5% costs for overhead restructuring (€ -51m) and productivity improvement
measures (€ -10m)
Excl. costs for restructuring and productivity measures (€ -61m),
t/o Germany 265 102 -61.5% operating performance slightly improved vs Q1 - but headwinds from
higher staff and transport costs continue
t/o International
International EBIT remains around break-even levels as planned -
eCommerce - -5 6 >100%
small yoy increase partly balancing out Q1 development
Parcel
Excluding IFRS16 effect (€ 28m), improvement mainly due to working
Operating Cash Flow 269 375 +39.4%
capital management. Restructuring costs not cash relevant
Mainly driven by investments into StreetScooter fleet expansion and
Capex 96 200 >100%
parcel networks in Germany and abroad
DPDHL GROUP INVESTOR RELATIONS PRESENTATION | AUGUST 2018 PAGE 19PEP 2018 EBIT BRIDGE – REMINDER
Pension revaluation, Implied FY18 EBIT contribution, in € m
2018 vs 2017
Q1 18: € +108m operating cost
(as shown on June 8, 2018)
overrun: ~ € -350m
1,503
-250 -150
~ 1,100 -500
~ 600
2017 Operating Additional opex NEW 2018 Restructuring 2018 PeP EBIT
PeP performance investment in PeP EBIT costs guidance
EBIT vs initial business expectation
targets improvement (before
restructuring
costs, incl.
pension
revaluation)
DPDHL GROUP INVESTOR RELATIONS PRESENTATION | AUGUST 2018 PAGE 20PEP 2018 EBIT BRIDGE – EXPECTED QUARTERLY PHASING
Operating cost overrun
in € m
Q1 Q2 Q3e Q4e FY18e
-[0-50]
-91 -[50-100]
-142
Q2 17: 260
Q2 18: 108
Restructuring -51
Q1 17: 425
Prod. meas. -10 ~-350
Q1 18: 391
yoy: -91
Pension +108
yoy: -142
• 1st contribution
• Lower sickness Restructuring and from cost
rate productivity initiatives and
• International EBIT measures early retirement
better yoy expected to start • First impact from
• No significant cost delivering initial parcel yield
improvement in benefits initiatives
Germany yet
DPDHL GROUP INVESTOR RELATIONS PRESENTATION | AUGUST 2018 PAGE 21STATUS UPDATE, PEP MEASURES
1 PRICING MEASURES
Post Parcel
Expected timeline for new price regulation: Measures decided:
Above average general price increase
• Regulator publishes draft of benchmark - Effective 1.1.2019, partly already as of 1.9.2018
Oct
decision for comments
- In particular for bulky and heavy goods
• Regulator publishes final benchmark decision
Nov
• Application for approval of the 2019 tariffs Ship-to-profile expertise from DHL Express now
being applied by Parcel Germany
Dec • Tariff approval by regulator
4. New pricing
- Ensure stronger contract compliance
Jan • New pricing implemented 1st January
1st Jan 2019
- Customer review boards for active yield
management
In scope: Ex-ante regulated mail with revenue
- Reflecting customer-specific volume volatility
base of € ~2.9bn
over the course of the year
Improved peak season planning in alignment with
business customers to best prepare peak season
uplift in current tight market environment
DPDHL GROUP INVESTOR RELATIONS PRESENTATION | AUGUST 2018 PAGE 22STATUS UPDATE, PEP MEASURES
2 PRODUCTIVITY MEASURES, DIRECT COSTS
Hubs Transport Last mile
Process Stabilizing of operations
1)
stabilization based on existing SOP Individual measures being evaluated and
scoped – first measures already initiated
Examples:
Transfer best practices to low performing
Apply 1st Choice and lean operational entities
Process
management tools to Increase performance dialogues
improvement improve SOP
1)
Re-accelerate Certified training
Improve volume prognosis based on enhanced
data analytics
Optimize tour management to avoid overtime
Drive structural process More frequently adjust district sizes according to
Process volume
enhancements through
renewal automation and digitalization
1) SOP = Standard Operating Procedure
DPDHL GROUP INVESTOR RELATIONS PRESENTATION | AUGUST 2018 PAGE 23STATUS UPDATE, PEP MEASURES
3 RESTRUCTURING MEASURES, INDIRECT COSTS (1/2)
a) Redesign of organization b) Refocus on core business c) Reduction of expenses
Simplification Shutdown of activities, e.g.
Right-sizing e.g Reduction of
No duplications marketing spend
Review of IT
projects
DPDHL GROUP INVESTOR RELATIONS PRESENTATION | AUGUST 2018 PAGE 24STATUS UPDATE, PEP MEASURES
3 RESTRUCTURING MEASURES, INDIRECT COSTS (2/2)
Civil Servant early retirement program, scope & process:
Civil servants, minimum age 55
Employed in an indirect function with no need to refill position
Legal basis and process have been used successfully in the past
P&L and cash flow effects: Full P&L charge upfront in 2018; positive FCF effect
€m Q2 H2 2018 `19 vs `18 `20 vs `18
P&L one-offs -51 -349 -400 - -
P&L benefits - € 200m annual indirect cost reduction identified
DPDHL GROUP INVESTOR RELATIONS PRESENTATION | AUGUST 2018 PAGE 25Focus. Connect. Grow.
EXPRESS
DPDHL GROUP INVESTOR RELATIONS PRESENTATION | AUGUST 2018 PAGE 26EXPRESS: UNCHANGED STRONG TDI DEVELOPMENT
Time Definite International (TDI)
Shipments per day ‘000s
TDI shipment/day growth remains well diversified
with all regions contributing: Europe +11.1%,
MEA +9.6%, Americas +8.8% and APAC +4.3%
+8.4%
Yield management and yoy higher fuel surcharge
890 965 drive stronger revenue vs shipment/day growth
Order for 14 Boeing 777 signed, in line with
Q2 2017 Q2 2018 intentions announced at May CMD:
Revenues per day1) in € m
- € 0.2bn incremental capex in 2018
- Significant operating and financial benefits: EBIT
margin accretion of 50 bps upon completion of
+9.7%
program
46.5 51.0
- Whilst impacting capex and FCF, debt-financing
means no impact on Group excess liquidity
Q2 2017 Q2 2018 considerations
1) Currency translation impacts are eliminated. Data aggregated with same currency rate
DPDHL GROUP INVESTOR RELATIONS PRESENTATION | AUGUST 2018 PAGE 27EXPRESS – DIVISIONAL RESULTS Q2 2018
€m Q2 2017 Q2 2018 Chg. Management comments
Adjusted for significant adverse FX effects organic increase of +12.1%
Revenue 3,750 4,046 +7.9% reflecting unchanged strong TDI volume growth, strict yield management as
well as higher fuel surcharges
Strong operating performance given that IFRS16 benefit was more than
EBIT 469 517 +10.2%
offset by significant FX headwind. Margin up +30bps to 12.8%
Operating Excl. IFRS16 effect (€ 169m), strong OCF reflects excellent operating
542 753 +38.9%
Cash Flow performance
Strong yoy increase mainly driven by first installment related to Boeing 777
Capex 130 218 +67.7%
order
DPDHL GROUP INVESTOR RELATIONS PRESENTATION | AUGUST 2018 PAGE 28EXPRESS GROWTH SUPPORTED BY BALANCED GLOBAL FOOTPRINT
Quarterly growth ranking, TDI volume growth
Consistent strong
#1 EU EU MEA AM AP AP MEA EU MEA EU EU EU EU AM AM EU EU MEA MEA MEA MEA EU
volume growth in
global TDI
AP MEA AP AP MEA AM AM MEA EU MEA MEA AP AM EU EU AM MEA EU AM AM AM MEA
#2 network
#3 MEA AP AM EU AM MEA AP AP AP AP AP MEA AP AP MEA MEA AM AM EU EU EU AM Constant variation
in regional
#4 AM AM EU MEA EU EU EU AM AM AM AM AM MEA MEA AP AP AP AP AP AP AP AP patterns reflects
movements
in global trade
880 890 863 978 904 965
615 647 618 693 662 700 661 748 709 760 723 821 764 820 771 824 flows
Q1 Q2 Q3 Q4 Q1 Q2 Q3 Q4 Q1 Q2 Q3 Q4 Q1 Q2 Q3 Q4 Q1 Q2 Q3 Q4 Q1 Q2
2013 2014 2015 2016 2017 2018
+8.4% +7.8% +8.7% +7.4% +9.9% +9.0%
TDI Shipments/ day EU Europe MEA Middle East Africa AM Americas AP Asia Pacific
DPDHL GROUP INVESTOR RELATIONS PRESENTATION | AUGUST 2018 PAGE 29FOCUS ON TDI IS OUR KEY TO SUCCESS
Leading global network & „insane“ customer centricity & certified employees =
consistent strong TDI growth and market share expansion
DHL EXPRESS, TDI SPD YOY TDI, GLOBAL MARKET SHARE
10.2% 9.9%
9.4%
8.7% 9.0%
8.4%
7.8% 7.6% 11% 12% 11%
7% 30% 6% 34%
38%
22% 1
23% 22%
29% 26% 29%
2010 2014 2016
2011 2012 2013 2014 2015 2016 2017 H1 2018 DHL Fedex UPS TNT
1) includes 4% TNT
DPDHL GROUP INVESTOR RELATIONS PRESENTATION | AUGUST 2018 PAGE 30E-COMMERCE IS A PROFITABLE GROWTH DRIVER FOR DHL EXPRESS
Portion of B2C TDI shipments has increased We grow B2C profitably because 90% of the KPIs
over time perfectly suit our network
>10%1) >23%1) Volume growth drives better utilization
SpD
of existing network
WpS Lower weight per shipment
RpK Higher RpK related to lower WpS
2013 2017
First mile More pieces per stop at pickup
We treat B2C/e-commerce shipments as a TDI vertical Better utilization of existing infrastructure,
Hub sort
applying the same yield discipline with high degree of conveyables
using B2C requirements to enhance the overall TDI service Better utilization of existing capacity,
Airlift
and capabilities with lower WpS being advantageous
equipping our sales force to effectively sell to e-commerce customers Last mile Residential delivery to private households
engaging in partnerships to grow cross-border e-commerce
1) Indications based on medium to large B2C customers of top 30 countries
X-Border e-commerce has developed into an important TDI vertical and profitable growth driver
DPDHL GROUP INVESTOR RELATIONS PRESENTATION | AUGUST 2018 PAGE 31INTERCONTINENTAL FLEET: USE REPLACEMENTS AS OPPORTUNITY
TO MOVE TOWARDS HIGHER OWNERSHIP STRUCTURE
Dedicated fleet (w/o feeders)
2010-17: fleet expansion
2010: ~150 planes 2017: >200 planes Expansion based on successful virtual airline model – gradual
shift in mid-sized, regional segment from leases to ownership
Today: well balanced fleet regarding ownership and maturity –
ownership structure of intercont fleet still more tilted towards
leases
Outlook: intercont replacements by new, owned planes
Order for 14 Boeing 777s signed, in-line with intentions
announced at May CMD – first delivery expected in 2019
New aircraft are capacity neutral but bring significant cost,
efficiency and reliabilility benefits
Owned Lease
Any further fleet expansion to be carefully considered in line
with market growth expectations
DPDHL GROUP INVESTOR RELATIONS PRESENTATION | AUGUST 2018 PAGE 321. AVIATION NETWORK STEERING APPROACH UNCHANGED –
OPPORTUNE TIMING TO SHIFT INTERCONT TOWARDS MORE OWNERSHIP
Significant benefits of Buy vs Lease for intercont
How we look on own vs lease:
replacements
Cost (operation&ownership) – SIGNIFICANT SAVINGS
Asset Intensity • Savings reflect lower cost over lifetime & fuel efficiency,
driving >50bp margin improvement potential
• Expect EUR ~ 0.2bn incremental capex in FY18
• Financed by separate debt vehicle – no burden on excess
liquidity
Cost Position Asset intensity – NO CHANGE
• No difference in asset recognition under IFRS 16
Flexibility – OPERATIONAL BENEFITS
Flexibility
• Better flexibilty to match supply capacity to demand changes
• Higher reliability and fuel efficiency of new planes are most
relevant on intercon fleet given most intense utilization
Using balance sheet strength to unlock further structural Express margin potential
DPDHL GROUP INVESTOR RELATIONS PRESENTATION | AUGUST 2018 PAGE 33Focus. Connect. Grow.
FORWARDING, FREIGHT
DPDHL GROUP INVESTOR RELATIONS PRESENTATION | AUGUST 2018 PAGE 34GLOBAL FORWARDING, FREIGHT: AIR AND OCEAN GP INCREASING
Q2 Gross €m
GP/t ; GP/TEU Selective approach toward lower margin
Volume customer volumes and trade lanes limits volume
2018 Profit Yoy change
performance – paying off with strong GP/unit
Air 943k t € 227m +12.8%
freight (-4.7%) (+8.1%)
improvements especially in AFR segment
Ocean 811k TEU1) € 168m +2.2% GP margin DGF up to 23.7%
freight (-1.6%) (+0.6%)
DGF GP Conversion (lhs) DGF EBIT Margin (rhs) Simplify program delivering visible progress
20% 5% First countries successfully running on new TMS
15% 4% for OFR, further roll-out continuing smoothly
3%
10% EBIT margin and GP conversion trending back
2%
toward pre NFE levels
5% 1%
0% 0%
Q2 2013 Q2 2014 Q2 2015 Q2 2016 Q2 2017 Q2 2018
1) Twenty Foot Equivalent Unit
DPDHL GROUP INVESTOR RELATIONS PRESENTATION | AUGUST 2018 PAGE 35GLOBAL FORWARDING, FREIGHT– DIVISIONAL RESULTS Q2 2018
Q2 Q2
€m Chg. Management comments
2017 2018
Growth held back by selectivity and adverse FX effects, still very good
Revenue 3,612 3,702 +2.5%
organic growth of +6.0% incl. +5.8% in Freight
Strong improvement in Air Freight as selling rates reflect tight markets, also
Gross Profit 872 907 +4.0%
good progress in Ocean and Road Freight
Successful recovery clearly visible in improving operating and financial
EBIT 67 105 +56.7% performance, even despite negative currency impact. Strong margin
improvement of ~100bps to 2.8%
Operating Excl. IFRS16 effect (€ 48m), cash flow improvement reflects strong
-36 200 >100%
Cash Flow operating performance and working capital improvements
Capex 19 25 +31.6% Phasing effects on usual very low capital intensity levels
DPDHL GROUP INVESTOR RELATIONS PRESENTATION | AUGUST 2018 PAGE 36THE LIFECYCLE OF A SHIPMENT IS A COMPLEX PROCESS
Forwarding is more than brokerage of transport, it is managing all the steps along the way
Take control Create documents
Plan route of goods from for export compliance Manage transport
& organize customer & customs to port/airport
Quotation Consolidation Manage loading
shipment
Process & export process
Ensure goods
Goods
are shipped
to be shipped
Ensure
shipment
stays on track
Billing
& payments Transport to warehouse Accept delivery
or final destination Manage documents for import at port/airport
compliance & customs process
Success in Forwarding is built on experience, customer relationships, processes and in some
aspects, such as consolidation, is also a function of scale
DPDHL GROUP INVESTOR RELATIONS PRESENTATION | AUGUST 2018 PAGE 37SIMPLIFY STRATEGY AIMS TO CLOSE THE GAP TOWARDS
BENCHMARK PROFITABILITY
30%
25% Benchmark Conversion Ratio Range
20%
DGF EBIT/GP
15% Conversion
DGFF EBIT Margin
10%
5%
0%
2010 2011 2012 2013 2014 2015 2016 2017 2018 2019 Mid-term target
No structural barriers – we have the right combination of people, business model, processes
and IT renewal to achieve benchmark conversion ratios over time
DPDHL GROUP INVESTOR RELATIONS PRESENTATION | AUGUST 2018 PAGE 38IT RENEWAL ROADMAP UPDATE
LEGACY SYSTEMS
CRM Tool Upgrade CRM
SALES
Legacy Quote
tool 1 Legacy System Enhance Customer Portal
Legacy Quote
tool 2 Legacy System Harmonized Quotation Tool
Legacy Quote
tool 3 Legacy System Online Quotation & Booking
EDM (US) EDM Global Roll-out
OPERATIONS
Maximize scope
Legacy Transport OFR Roll Out of use,
Transport Mgmt System
Management System OFR Pilot integration,
(POC)
LOGIS AFR Pilot AFR Roll Out automation
Operational Irregularities
Legacy Legacy Management
Legacy Legacy Shipment Visibility Tools
Significant progress/completed; now business as usual Initiated and demonstrating progress; further rollout ongoing
Significant progress has been made across all initiatives, further rollout on-going
DPDHL GROUP INVESTOR RELATIONS PRESENTATION | AUGUST 2018 PAGE 39FORWARDING IS AN ASSET-LIGHT AND HIGH RETURN INDUSTRY
DHL Global, Forwarding, Freight: ROCE, GP and EBIT margin, 2010-17
60%
53.8%
50% 44.1% 45.3%
40%
30% 23.7% 1)
22.6% 23.50% ROCE excl. GW
20%
DGF GP Margin
7.9% 9.7%
10% 6.0% ROCE incl. GW
1)
5.0%
0% 3.2%
5.0% 2.7% 2.1% EBIT Margin
0.0%
2010 2011 2012 2013 2014 2015 2) 2016 2017
1) Divisional ROCE: EBIT / Rolling 12m net segment assets (Business Operating Assets + Goodwill), 2) Adjusted for 2015 write-off
Steady GP margins show that DGFF business quality remains at benchmark levels.
Simplify strategy aims to unlock benchmark conversion and EBIT margin levels
DPDHL GROUP INVESTOR RELATIONS PRESENTATION | AUGUST 2018 PAGE 40Focus. Connect. Grow.
SUPPLY CHAIN
DPDHL GROUP INVESTOR RELATIONS PRESENTATION | AUGUST 2018 PAGE 41SUPPLY CHAIN – DIVISIONAL RESULTS Q2 2018
€m Q2 2017 Q2 2018 Chg. Management comments
Disposal of Williams Lea Tag and FX effects explain reported decline,
Revenue 3,515 3,212 -8.6%
organic revenue growth is +2.7%
Solid operating performance - positive EBIT effect from IFRS16 is roughly
EBIT 124 128 +3.2%
offset by adverse yoy effects from FX and WLT disposal
Operating
139 131 -5.8% Positive effects from IFRS16 (€ 145m) offset by phasing of working capital
Cash Flow
Capex 75 67 -10.7% In line with usual low capital intensity on owned assets
DPDHL GROUP INVESTOR RELATIONS PRESENTATION | AUGUST 2018 PAGE 42DHL SUPPLY CHAIN: SOLUTIONS OVERVIEW
Offering Customized Solutions Across the Entire Supply Chain
Revenue by Service Area
FY 2017
Value Added
Services
Transportation
20%
33%
47%
Warehousing
DPDHL GROUP INVESTOR RELATIONS PRESENTATION | AUGUST 2018 PAGE 43LIMITED ASSET INTESITY DRIVES ATTRACTIVE AND RISING ROCE
DHL Supply Chain: ROCE and EBIT margin, 2010-17
60%
50% 51.5%
39,3%
40%
1)
30% 24.4% ROCE excl. GW
20% 13.9% 17.6% 1)
7.9% ROCE incl. GW
10%
6%
0% EBIT Margin
5%
Target EBIT Margin
4%
3.9%
3%
1.8% 3.1%
2%
1%
0%
2010 2011 2012 2013 2014 2015 2016 2017
1) Divisional ROCE: EBIT / Rolling 12m net segment assets (Business Operating Assets + Goodwill)
Focus on Strategy 2020 initiatives provides sustained growth in EBIT, EBIT margin and ROCE.
EBIT margin moving into the target band accompanied by strong & improving return profile.
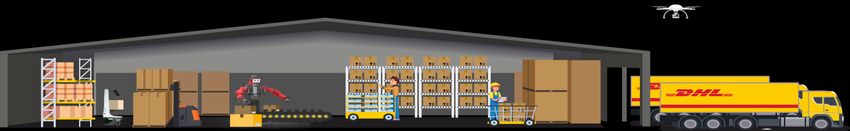
DPDHL GROUP INVESTOR RELATIONS PRESENTATION | AUGUST 2018 PAGE 44CLEAR DIGITALIZATION STRATEGY
Smart Scanning/ Surveillance
Smart Watches with Drones
Collaborative Smart Sensors
Automated Stationary for Real Time
Picking Robots Robots Visibility
Automated Storage and
Vision Picking
Retrieval Systems
• Digitalization is a strategic pillar for DSC
with a clear roadmap in terms of
overarching goals and target use cases
• Technologies are being deployed across
regions by local experts, in close
cooperation with our customers and the
technology providers
DPDHL GROUP INVESTOR RELATIONS PRESENTATION | AUGUST 2018 PAGE 45Appendix DPDHL GROUP INVESTOR RELATIONS PRESENTATION | AUGUST 2018 PAGE 46
GROUP P&L Q2 2018

€m                                Q2 2017          Q2 2018     Chg.   Management comments

                                                                      Continued good organic growth of +6.2% after adjustment for adverse FX effects,
Revenue                             14,813          15,026   +1.4%
                                                                      Williams Lea Tag disposal and contributions from small bolt-on acquisitions

                                                                      EBIT decline due to operating performance and first restructuring costs in PeP.
EBIT                                     841          747    -11.2%   Expected strong EBIT contribution from DHL Divisions. Corporate Functions at
                                                                      € -111m, incl. € -22m Corporate Incubations
                                                                      Operating performance slightly improves vs Q1, but still too high cost base;
t/o PeP                                  260          108    -58.5%
                                                                      € -61m costs for restructuring and productivity measures included
                                                                      Strong Express performance continues, DGFF shows strongest Y-o-Y growth as
t/o DHL                                  661          750    +13.5%
                                                                      operating turnaround progresses

Financial result                          -89         -135   -51.7%   Increase due to first-time recognition of interest expenses on leases (IFRS16)

                                                                      Tax rate at 8.8%, driving H1 rate to 14.0%. This reflects the lowered full year
Taxes                                   -113           -54   +52.2%
                                                                      guidance (from 18% to 14%) due to reduced expected profit in Germany
                                                                      Mainly reflecting EBIT decline as higher financial costs are largely balanced by
Cons. net profit1)                       602          516    -14.3%
                                                                      lower taxes
EPS (in €)                              0.50          0.42   -16.0%

1) Attributable to Deutsche Post AG shareholders

DPDHL GROUP INVESTOR RELATIONS PRESENTATION | AUGUST 2018                                                                                            PAGE 47
Q2 2018 IFRS 16 P&L IMPLICATIONS OVERVIEW
Delta IFRS 16
€m Q2 2017 Q2 2018 Chg.
LY effect
EBIT effect due
Revenue 14,813 15,026 +1.4% +213 to IFRS 16
Material Expense / Staff PeP +10
cost /Net other operating -13,598 -13,472 +0.9% +126 +508
expenses DHL +37
EBITDA 1,215 1,554 +27.9% +339 +508
- EXP +19
Depreciation &
-374 -807FREE CASH FLOW Q2 2018
Good OCF performance – FCF nevertheless lower due to higher capex and M&A spend
Reminder: IFRS16 has significant impact on individual lines, but none on final FCF line
Q2 Q2 Delta IFRS 16
€m
2017 2018 LY effect
EBIT 841 747 -94 +47
Depreciation/ Amortization 374 807 +433 +461 Significant increase in depreciation due to IFRS16
Cash from operating activities
838 1,485 +647 +508
before changes in WC Adjusted for IFRS16 accounting effects, good OCF
Changes in Working Capital -112 -130 -18 -10 generation reflecting ongoing strong operating
performance in DHL divisions as well as non-cash PeP
Net cash from operating restructuring costs
726 1,355 +629 +498
activities after changes in WC
Net Capex -303 -485 -182 Decline in FCF (€ -97m) driven by higher cash out for
Net Cash for Leases 0 -498 -498 -498 capex and M&A
Additional “Net Cash for Leases” line ensures FCF is
Net M&A 3 -61 -64 fully comparable to previous years under new IFRS16
Net Interest -41 -23 +18 accounting
Free Cash Flow 385 288 -97 FFO/Debt at 27.8% ( 29.9% in March 18)
DPDHL GROUP INVESTOR RELATIONS PRESENTATION | AUGUST 2018 PAGE 49NET DEBT (-)/LIQUIDITY (+)
€1.4bn cash out for dividend explains usual seasonal net debt increase in Q2
in € m
-1,938 1,723 -2,005
-1,414 -269
-11,915
-9,472 -13,375
Net debt OCF Net capex incl. net Dividend paid Other effects Balance sheet Net debt Net debt
(Dec 31, 2017) Cash for Leases recognition of (June 30, 2018) (Mar 31, 2018)
lease liabilities
DPDHL GROUP INVESTOR RELATIONS PRESENTATION | AUGUST 2018 PAGE 50IFRS 16: MAJOR P&L IMPLICATIONS
1)
EUR m Expected IFRS16 effect on 2018
Revenuenue No changes
Decrease as lease expenses to be recognized as depreciation and interest
Materials expense ~ -1,950 costs – only exemptions for short-term leases and low-value assets, which
stay in material costs
EBITDA ~ +1,950 Increase due to lower materials expenses
D&A ~ +1,800 Increase due to new depreciation of capitalized operating-lease-assets
EBIT increase as operating lease expense replaced by depreciation
EBIT ~ +150
and interest
Net finance costs ~ -350 Increase due to interest cost component booked in finance cost
Income taxes ~ -50 Lower during first years due to higher deferred tax assets
Whilst neutral over time, timing effect due to higher interest during
Cons. net profit ~ -150
first years
Main P&L effects: increase in EBITDA and EBIT, long-term neutral to net profit
1) Based on leases as per 1.1.2018
DPDHL GROUP INVESTOR RELATIONS PRESENTATION | AUGUST 2018 PAGE 51IFRS 16: EXPECTED IMPLICATIONS FOR DPDHL GROUP
Scope at DPDHL Group: >25,000 leasing contracts, covering >35,000 assets
Expected major impacts on 2018 numbers:
P&L EBIT: expected increase of EUR ~ 150m
Current internal estimates:
to be further validated
Balance sheet Net debt: Expected increase of ~ EUR 9bn
FCF: no change based on new definition: OCF – redemption of lease liabilities - net
FCF
capex - net M&A - net interest
Credit Rating No impact on rating and related metrics expected
No effect on actual cash generation and debt rating
DPDHL GROUP INVESTOR RELATIONS PRESENTATION | AUGUST 2018 PAGE 52EBIT GROWTH IS AND REMAINS THE MOST IMPORTANT FCF DRIVER
EXPECTED
CASH FLOW STATEMENT MAIN DRIVERS
TREND
EBIT Group EBIT guidance, 2020: EUR >5bn
Step change due to 1st time application of IFRS 16 in 2018,
Depreciation
thereafter gradual increase reflecting capex spend
Total provisions still expected to come further down through net utilization
Change in provisions
Cash-outs expected to trend flat to slightly down yoy
Working capital Increasing as business grows but strong focus on working capital management
Income taxes Increase reflecting EBIT growth
Further modest yoy increases based on growth opportunities, excluding debt-financed
Net capex
Express intercont fleet renewal
Redemption of lease liabilities NEW due to 1st time application of IFRS 16 in 2018 (offsetting change in depreciation)
Net M&A Remains opportunistic & bolt-on
FCF Expect to generate excess liquidity every year (FCF > dividend payment)
EBIT increase allows to balance growth investments and rising shareholder returns
DPDHL GROUP INVESTOR RELATIONS PRESENTATION | AUGUST 2018 PAGE 53P&L TAX RATE AND CASH TAXES PAID EXPECTED TO INCREASE
25%
Main difference between P&L tax
20% P&L tax rate expense and cash taxes paid arise
15% from deferred tax assets
10% No additional tax loss carryforwards
5% to be capitalized as deferred tax
0%
assets in Germany in 2018
2010 2011 2012 2013 2014 2015 2016 2017 Not yet capitalized tax loss
carryforwards amount to
700 EUR 6.4bn, most of it in the US
600
In EUR m Cash taxes paid
Cash taxes paid will increase in line
500
with anticipated growth in profitability
400
300
P&L tax expense
200
100
2010 2011 2012 2013 2014 2015 2016 2017
P&L tax rate expected to reach mid-to-high 20% range by 2020
DPDHL GROUP INVESTOR RELATIONS PRESENTATION | AUGUST 2018 PAGE 54FX MOVEMENTS ARE PART OF BEING THE MOST GLOBAL COMPANY IN
THE WORLD
FX effects are mainly translational
EUR appreciation => lower revenue and
EBIT
Other positive exposures Direct USD exposure actually more than
offset by USD-correlated block => USD
Other larger currencies depreciation = positive stand-alone, but in
with positive exposure
(e.g. GBP, JPY, KRW, AUD, practice most often offset by FX
PLN, RUB, SEK, MXN) movements in the USD block
More than 50% of FX effects in 2017
CZK, MYR came from outside of the big currencies
USD Block1)
(CNY, HKD, INR, TWD, THB,
SAR, AED, PHP, VND) Ultimately, FX volatility is unavoidable
USD
and best managed by the business
We do only opportunistic hedging (e.g.
Net Short FX Net Long
Exposure FX Exposure Brexit)
Difficult to model FX externally due to the
many cross currency dependencies
1) Currencies with a correlation to the USD above 75%
DPDHL GROUP INVESTOR RELATIONS PRESENTATION | AUGUST 2018 PAGE 55CAPEX: RECENT HISTORY AND OUTLOOK
Slight upward trend
Increase driven by Low levels
2017 peak, from new business – GROUP CAPEX
investments in B2C
national/international
+ plateauing in 2018 + reflecting minimal
capital intensity
+ still remains mostly = (excl. leases)
asset light
Capex,
EUR m
1,049
666 FY 2018 guidance
EUR ~2.5bn
277
70
PeP Express Global Forwarding, Supply Chain
Freight
FY 2013 FY 2014 FY 2015 FY 2016 FY 2017 FY 18e
DPDHL GROUP INVESTOR RELATIONS PRESENTATION | AUGUST 2018 PAGE 56DISCIPLINED GROWTH INVESTMENT HAS LED TO RISING RETURNS
ROCE
16% Group ROCE2)
14.7%
14.1%
14% ROCE rebased
IFRS16 for IFRS16
12.3% 11.9%
11.6%
12% 11.1% 11.6%1) WACC
10%
8.5%
8%
6% Gross capex
6.8%
2,074 2,277 +200
4% 1,876 2,024
1,716 1,697 1,747 2,000 Gross Capex,
1,262 EURm
2% 2,500 1,000
0
0%
2010 2011 2012 2013 2014 2015 2016 2017 2018E
1) 2015 EBIT adjusted for NFE-write off; 2) Group ROCE = Group EBIT / (Total assets – current liabilities)
Although IFRS 16 implementation means that absolute return numbers will change, we remain
committed to unchanged capital allocation discipline and sustained growth of all return metrics
DPDHL GROUP INVESTOR RELATIONS PRESENTATION | AUGUST 2018 PAGE 57DPDHL GROUP PENSIONS - DBO, DCO, CIVIL SERVANTS
in EUR m Defined 2012 2013 2014 2015 2016 2017
Benefit
17,493 Total DBO (DB):
17,439 Change in
Staff costs + provisions 410 282
Net Pension Change in 268 264 266 230
4,467 4,530 Provision provisions Current service
costs 156 186 163 193 162 187
Plan 542 538 531
516
13,026 12,909 Assets
Civil 493
servants (in
461
GER)
Defined
contribution
MAR 31, 2017 JUN 30, 2018 (DC):
Cash out =
staff costs in Hourly
EBIT workers and
Discount Rate Germany UK Other Total salaried
employees
Mar 31, 2018 2.00% 2.75% 2.12% 2.24% mainly 286 276 317 305 300
Jun 30, 2018 2.00% 2.75% 2.15% 2.24% outside GER 238
DPDHL GROUP INVESTOR RELATIONS PRESENTATION | AUGUST 2018 PAGE 58DISCLAIMER THIS PRESENTATION CONTAINS CERTAIN STATEMENTS THAT ARE NEITHER REPORTED RESULTS NOR OTHER HISTORICAL INFORMATION. THESE FORWARD-LOOKING STATEMENTS ARE SUBJECT TO RISKS AND UNCERTAINTIES THAT COULD CAUSE ACTUAL RESULTS TO DIFFER MATERIALLY FROM THOSE EXPRESSED IN THE FORWARD-LOOKING STATEMENTS. MANY OF THESE RISKS AND UNCERTAINTIES RELATE TO FACTORS THAT ARE BEYOND DEUTSCHE POST AG’S ABILITY TO CONTROL OR ESTIMATE PRECISELY, SUCH AS FUTURE MARKET AND ECONOMIC CONDITIONS, THE BEHAVIOR OF OTHER MARKET PARTICIPANTS, THE ABILITY TO SUCCESSFULLY INTEGRATE ACQUIRED BUSINESSES AND ACHIEVE ANTICIPATED SYNERGIES AND THE ACTIONS OF GOVERNMENT REGULATORS. READERS ARE CAUTIONED NOT TO PLACE UNDUE RELIANCE ON THESE FORWARD-LOOKING STATEMENTS, WHICH APPLY ONLY AS OF THE DATE OF THIS PRESENTATION. DEUTSCHE POST AG DOES NOT UNDERTAKE ANY OBLIGATION TO PUBLICLY RELEASE ANY REVISIONS TO THESE FORWARD- LOOKING STATEMENTS TO REFLECT EVENTS OR CIRCUMSTANCES AFTER THE DATE OF THIS PRESENTATION. THIS PRESENTATION DOES NOT CONSTITUTE AN OFFER TO SELL OR THE SOLICITATION OF AN OFFER TO SUBSCRIBE FOR OR BUY ANY SECURITY, NOR SHALL THERE BE ANY SALE, ISSUANCE OR TRANSFER OF THE SECURITIES REFERRED TO IN THIS PRESENTATION IN ANY JURISDICTION IN CONTRAVENTION OF APPLICABLE LAW. COPIES OF THIS PRESENTATION AND ANY DOCUMENTATION RELATING TO THE OFFER ARE NOT BEING, AND MUST NOT BE, DIRECTLY OR INDIRECTLY, MAILED OR OTHERWISE FORWARDED, DISTRIBUTED OR SENT IN OR INTO OR FROM AUSTRALIA, CANADA OR JAPAN OR ANY OTHER JURISDICTION WHERE TO DO SO WOULD BE UNLAWFUL. THIS DOCUMENT REPRESENTS THE COMPANY‘S JUDGMENT AS OF DATE OF THIS PRESENTATION. DPDHL GROUP INVESTOR RELATIONS PRESENTATION | AUGUST 2018 PAGE 59
INVESTOR RELATIONS CONTACTS

                Martin Ziegenbalg, Head of Investor Relations
                • +49 228 182 63000
                • E-mail: m.ziegenbalg@dpdhl.com

                Robert Schneider
                • +49 228 182 63201
                • E-mail: robert.schneider1@dpdhl.com

                Sebastian Slania
                • +49 228 182 63203
                • E-mail: sebastian.slania@dpdhl.com

                Sarah Bowman
                • +1 914 226 3437
                • E-mail: sarah.bowman@dpdhl.com

                Christian Rottler
                • +49 228 182 63206
                • E-mail: christian.rottler@dpdhl.com

DPDHL GROUP INVESTOR RELATIONS PRESENTATION | AUGUST 2018       PAGE 60
You can also read