Estimating economic benefits of the Single Market for European countries and regions - Policy Paper
←
→
Page content transcription
If your browser does not render page correctly, please read the page content below

Estimating economic benefits of
the Single Market for European
     countries and regions
           Policy Paper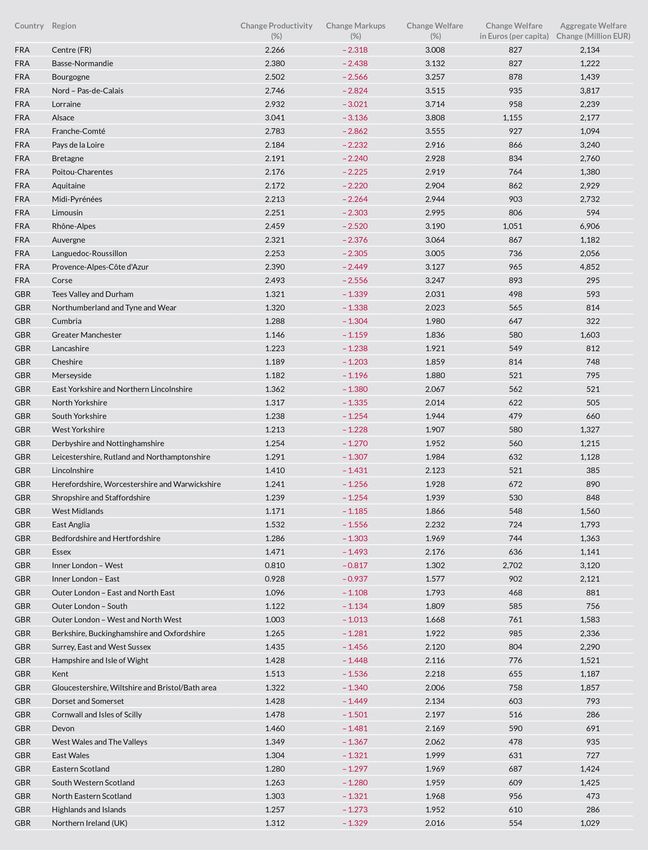
Estimating economic benefits of
             the Single Market for European
                  countries and regions
                                          Policy Paper

Imprint
© 2019 Bertelsmann Stiftung

Authors
Prof. Giordano Mion (University of Sussex, CEP, CEPR, CESifo, NIESR)
Dr. Dominic Ponattu (Bertelsmann Stiftung, Programme Europe’s Future)

Responsible
Dr. Dominic Ponattu
Project Manager
Programme Europe’s Future
Bertelsmann Stiftung
Telephone +49 5241 81-81495
Mobile     +49 160 8473611
Fax        +49 5241 81-681495
dominic.ponattu@bertelsmann-stiftung.de
www.bertelsmann-stiftung.de

Title image: © JeanLuc - stock.adobe.com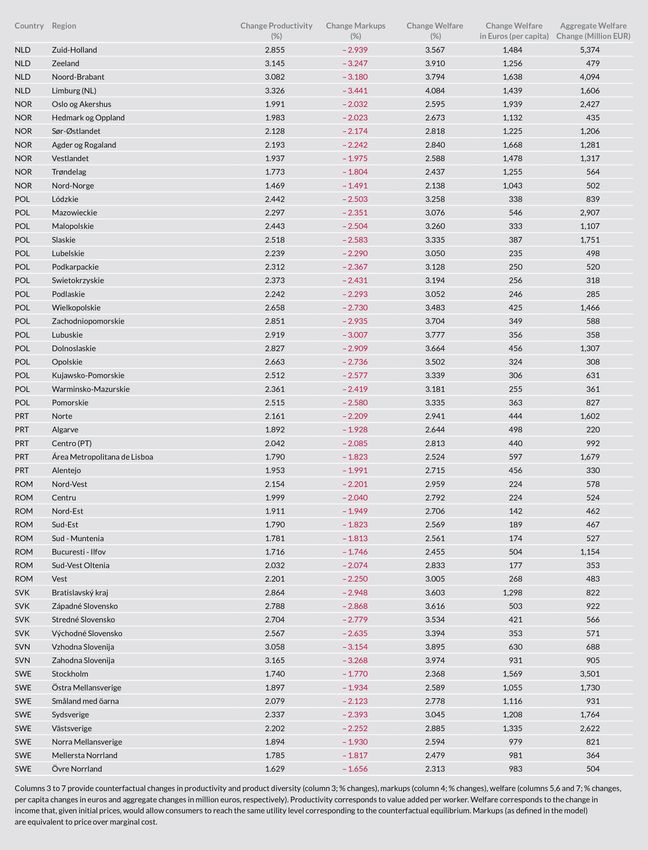
Estimating economic benefits of the Single Market for
                    European countries and regions*

                                    Giordano Mion†
                                   Dominic Ponattu‡

                                        May 2019
                                           Abstract
               This study provides insights into the economic benefits of the Eu-
           ropean Single Market (SM) for countries and regions across Europe.
           Specifically, we evaluate the impact of the trade boosting effects of the
           SM on productivity, markups, product variety, welfare and the dis-
           tribution of population across European countries and regions. We
           employ a model characterized by costly trade, love of variety, hetero-
           geneous firms, labour mobility as well as endogenous markups and
           productivity. The model is quantified using trade as well as GDP and
           population data for European countries and regions as well as other
           countries. We compute counterfactual economic changes stemming
           from changes in trade costs related to the SM. The findings suggest
           that on average, EU citizens’ per capita welfare gains from the SM
           amount to 840 euros per year. We uncover a strong heterogeneity of
           gains: Countries and regions in the geographic core of the EU see
           gains of up to 3,600 euros per capita (a 4.7% increase) while gains
           in some peripheral regions can be as small as 150 euros (about 2%).
           We also shed light on regional variation of welfare gains from the SM
           within individual EU countries.

           Keywords: Europe; Regions; EEA; Single Market; Firm heterogene-
           ity; Endogenous markups; Gravity equation; Labour mobility.
           JEL Classification: F12; R12; F15; F17
  * We  thank Kristian Behrens for helpful comments and suggestions. We also thank Katharina
Gnath and Christian Kastrop for insightful comments.
  † University of Sussex, UK; CEP, UK; CEPR, UK; CESifo, Germany; NIESR, UK.
  ‡ Bertelsmann Stiftung, Germany.

                                              3
1    Introduction
The agreement on the European Single Market entered into force in 1993 and to-
day forms the world’s biggest single market area. It goes well beyond traditional
free trade agreements as it extends the full rights and obligations of the common
market to its member states. It allows more than 500 million people to freely move
and travel, and the businesses in the EU to easily trade and invest. This way, the
internal market has not only strongly contributed to increasing living standards in
the EU, but it has also become a key pillar of tangible EU integration – which can
be perceived by virtually all citizens in their everyday lives. Yet, there is an ongoing
debate about growing regional disparities in Europe. Indeed, a number of regions
appear to enjoy strong growth in their gross domestic product (GDP), productivity
and wages along with a high level of public goods provision, while other regions are
lagging behind. In this context, some have argued that the Single Market may have
a differential impact on welfare across EU regions, thereby potentially exacerbating
widening gaps between regions.
    In this paper we provide quantitative insights into the economic benefits of the
European Single Market (SM) for countries and regions across Europe. More specif-
ically, we evaluate the impact of the trade boosting effects of the SM on productivity,
markups, product variety and welfare across European countries and regions. We
focus on the economic impact of the SM on its current members: the 28 EU member
states as well as the non-EU member states Iceland, Norway and Switzerland, added
to the SM via the European Economic Area (EEA) and bilateral trade agreements.
In order to achieve this, we employ a model characterized by costly trade, love of
variety, heterogeneous firms, labour mobility as well as endogenous markups and
productivity. We quantify the model using international goods and services trade
data as well as GDP and population for countries/regions that are members of the
SM, and we also include BRIC countries and other OECD countries in our analysis.
We finally compute, starting from the observed initial situation in the year 2016,
counterfactual economic changes stemming from changes in trade costs related to
the SM. The analysis allows us to break down any welfare effects of the SM not only
to the country level, but also to the regional level across Europe.
    The model used in our analysis builds upon the tradition of the so-called “gravity
models of trade”, i.e., models where a key feature of trade is that its volume is in-
creasing in the size of the exporting and importing countries/regions and inversely

                                           4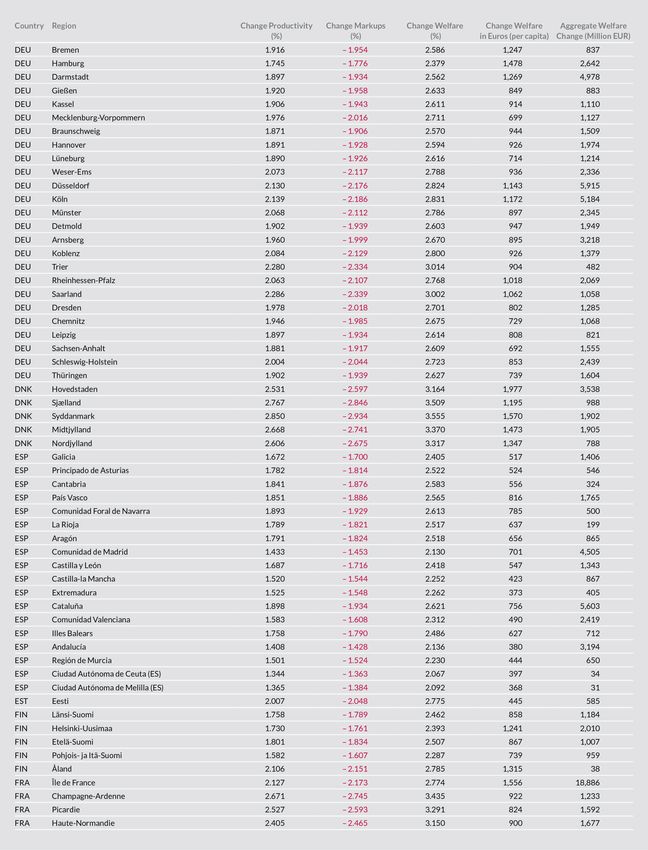
related to the distance and trade costs between the two countries/regions. In this
respect, abundant research and empirical evidence has demonstrated the robustness
and accuracy of these models that represent nowadays a standard in international
trade. These models are also very versatile and modern versions like ours incor-
porate several channels via which trade affects the economy. More specifically, we
build upon Behrens et al. (2014) and Behrens et al. (2017) to develop a gravity model
characterized by costly trade, love of variety, heterogeneous firms, labour mobility as
well as endogenous markups and productivity. We quantify the model using goods
and services trade data as well as GDP and population for a large number of coun-
tries and regions.1 In the first part of our analysis we run counterfactual analyses at
the country-level. In the second part, we decompose SM member countries into the
corresponding NUTS2 regions to uncover effects on European regions. We assess
the importance of the SM by performing a counterfactual experiment assuming the
effects following a de-facto removal of the SM agreement. From the counterfactual
we then derive the impact of the trade boosting effects of the SM on productivity,
markups, product variety and welfare across European countries and regions.
    Specifically, we obtain the trade costs equivalent to the SM from the estimation of
a trade gravity equation from which we recover a parameter measuring the amount
of additional trade that members of the SM do with each other controlling for other
determinants of bilateral trade flows (such as distance, language, adjacency, past
colonial ties). Such a parameter is an indicator of the trade boosting effects of the SM
and is the key to our counterfactual analysis. In our counterfactual scenario, we set
this parameter to zero between SM countries and regions and subsequently compute
a counterfactual equilibrium that we then compare with the one we observe in 2016.
Differences in productivity, markups, welfare, etc., between the counterfactual and
observed equilibria represent our estimates of the economic impact of the SM on
countries and regions.
    Moving to the results of the study, we first show that the Single Market provides
higher welfare, higher productivity and lower markups to all members of the SM
program while at the same time countries outside the common market are actually
(slightly) worse off because of the existence of the SM. Per capita percentage wel-
fare gains for SM countries vary from 2.07% in Iceland all the way up to 4.35% in
   1 Beyond members of the Single Market, we also include the following OECD and BRIC nations:
Australia, Brazil, Canada, Chile, China, India, Israel, Japan, Korea, Mexico, New Zealand, Russia,
Turkey and the US.

                                                5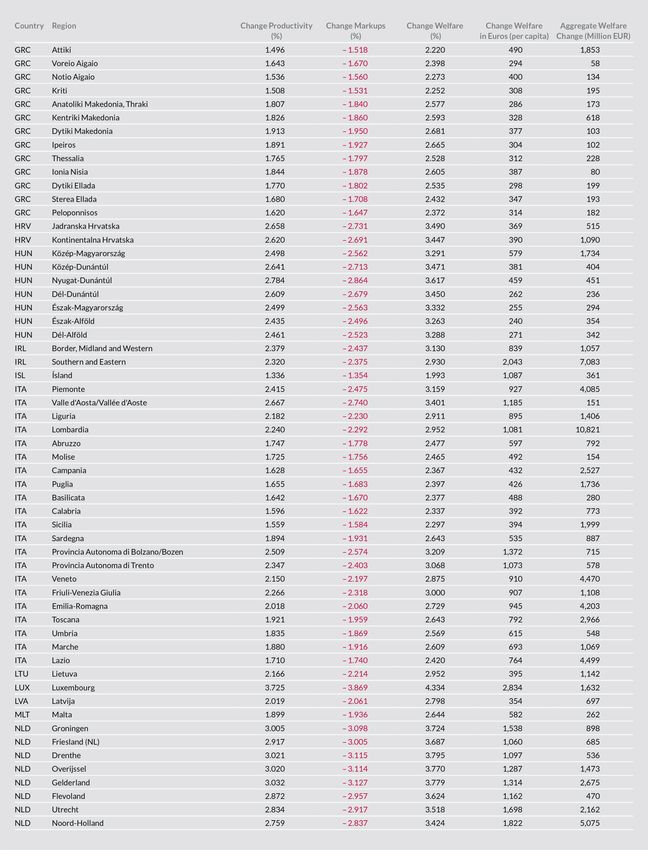
Belgium. In terms of monetary values (2016 euros), they instead range from 193 eu-
ros per capita for Bulgaria to a maximum of 2,914 euros per capita for Switzerland.
Total aggregate welfare gains, computed as per capita gains times population, for
all countries belonging to the Single Market sum up to 461 billion euros – for EU
members states alone, the aggregate benefit of SM membership amounts to about
427 billion euros. In this respect, it is important to note that these are yearly gains.
For example, in the above mentioned case of Belgium, welfare would every year be
4.35% higher than what it would have been without the SM. Therefore, the one-off
equivalent gain related to the SM would be considerably higher than the 461 bil-
lion euros provided here. The same applies to costs and gains for other countries.
As far as changes in markups and productivity are concerned, their ranking across
countries follows the same ranking of welfare changes albeit with somewhat smaller
numbers. Overall, our results at the country level are broadly consistent with other
works analyzing welfare effects related to the SM (e.g., Felbermayr et al., 2018).
    When moving from countries to regions we unveil rich and very heterogeneous
patterns. In terms of the interpretation of such patters we find that, for example, wel-
fare changes are stronger for regions closer to the center of Europe (higher market
access effect), regions that are small and/or belong to a small country (for smaller
regions and/or countries trade in the SM area is more important quantitatively) and
regions with better technology (more productive and innovative regions gain more
from trade). These observed trends are largely consistent with the widely discussed
"core-periphery" pattern across EU regions.
    Specifically, we find that citizens of the Zurich region (3,592 euros), London (2,702
euros) and the Brussels region (2,473 euros) show the greatest per-capita monetary
gains. Other regions with a robust services or manufacturing sector and a relatively
high share of exports also benefit strongly. For instance, regions where the auto-
motive industry is strong in Germany and France see particularly strong welfare
gains. Regions in southern Europe and in some of the eastern European countries,
however, show significantly lower welfare gains ranging from 117 to a maximum of
500 euros. This pattern of differential welfare gains from the SM is, by and large,
consistent with the view of a "core-periphery" pattern where economic activity is
primarily concentrated on the geographic core of the EU. We also take a closer look
at within-country variation: Our findings within countries suggest that gains from
the SM may be yet another factor reinforcing pre-existing north-south divides (in
Italy and the UK) as well as east-west divides (in France and Germany).

                                           6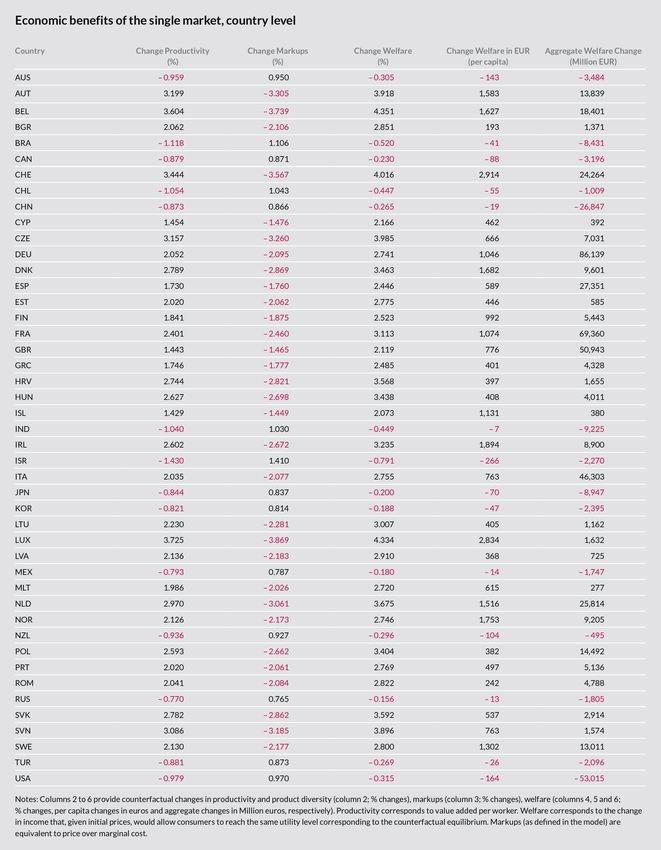
The building blocks of our analysis are the models developed in Behrens et al.
(2014) and Behrens et al. (2017). As stated in Behrens et al. (2014), many general
equilibrium models of international trade yield equivalent results about the aggre-
gate impact of trade liberalization for welfare and trade flows as captured by the
gravity equation (Arkolakis et al., 2012). However, models differ in their specific pre-
dictions along which margins an economy adjusts to freer trade. Recent workhorse
frameworks have focused on combinations of wages, productivity, and consump-
tion diversity as adjustment mechanisms, triggered by firm selection and market
share reallocations. Yet, those models do not come to grips with the fact that trade
integration also changes firms’ price-cost margins.
    In this respect there has been vastly growing empirical interest in markups re-
cently, and important contributions by De Loecker (2011), De Loecker et al. (2016),
Feenstra and Weinstein (2017), Simonovska (2015) and others, have established some
basic facts: (i) markups differ substantially across firms even within industries, and
firms with lower marginal costs tend to charge higher markups; (ii) firms apply dif-
ferent markups across different markets; and (iii) trade integration affects price-cost
margins. The main contribution of Behrens et al. (2014) is to develop a general equi-
librium quantifiable model of trade under monopolistic competition with variable
demand elasticity, heterogeneous firms, and multiple asymmetric countries. Wages,
productivity, and consumption diversity are all endogenously determined, and in
line with the facts (i)–(iii), markups differ across firms and across markets, and re-
spond to trade integration. We use this model in our analysis and further allow for
mobility of workers across space along the lines of Behrens et al. (2017). Finally,
note that we use the concept of equivalent variation in order to measure changes in
welfare drawing upon the results laid down in Arkolakis et al. (2018).
    The remainder of this paper is structured as follows. In the next section, we first
give a non-technical account of the methods used in this study.2 We then discuss
welfare gains at the country and, afterwards, at the regional level. Our analysis
will also focus on individual countries to uncover even more regional heterogeneity.
Last, section 4 discusses the highlights of our findings and draws implications for
policymakers.
  2 The   full model derivation is available for download at https://bit.ly/2JkdFQM.

                                                  7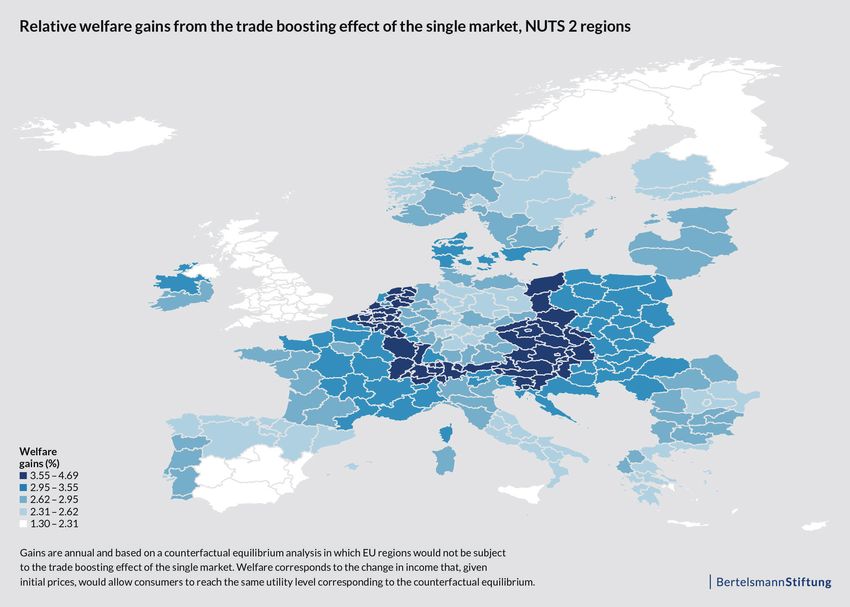
2      Method and approach
In this section, we provide a non-technical outline of the model used for the analyses
throughout this study. The full derivation of the model as well as a detailed de-
scription of the quantification procedure and the construction of the counterfactual
scenarios are available for download.3 To estimate the economic impact of the Sin-
gle Market (SM) on European countries’ and regions’ productivity, markups and
welfare we use a modern quantitative trade model of the global economy based on
Behrens et al. (2014) and Behrens et al. (2017). Quantitative trade models incorporate
the channels through which trade affects consumers, firms and workers and provide
a mapping from trade data to welfare. The model provides numbers for how much
countries and regions are affected by different trade policies, using readily available
data on trade volumes, GDP and potential trade barriers. The trade data we use
are from the COMTRADE (ITS) database provided by the United Nations (Eurostat)
for the period 2010-2016. We also consider data from a set of relevant factors to
be used in our gravity regression, provided by the Centre d’Etude Prospectives et
d’Informations Internationales (CEPII). Using data on trade costs and based on a
gravity regression, we derive a measure of "freeness of trade" that mirrors the trade
boosting effect of the Single Market. For the analysis here, we derive a counterfac-
tual freeness of trade-parameter that reflects, all else equal, the weakened projected
trade between countries in case of a hypothetical abolishment of the SM – i.e., a
situation in which no EU country benefits from any trade facilitation policies that
currently apply to members of the SM/EEA agreement. To construct the counter-
factual freeness, we update the dummy variable on SM membership – derived by
a gravity regression – by setting it equal to zero, essentially reflecting higher trade
costs. We then use the counterfactual freeness to shock the initial equilibrium and
let the system settle into a new equilibrium, taking into account all general equi-
librium effects. The resulting shift in welfare (and other quantities) would thus be
an indication of what would be lost if there were no SM anymore – it is this yearly
loss that we consider the value of the SM (from today’s point of view) and thus the
welfare gain compared to a scenario of non-existence of the SM.
    The model used in our analysis builds upon the tradition of so-called "gravity
models of trade", i.e., models where a key feature of trade is that its volume is in-
    3 Please   follow this link to download the technical appendix: https://bit.ly/2JkdFQM.

                                                    8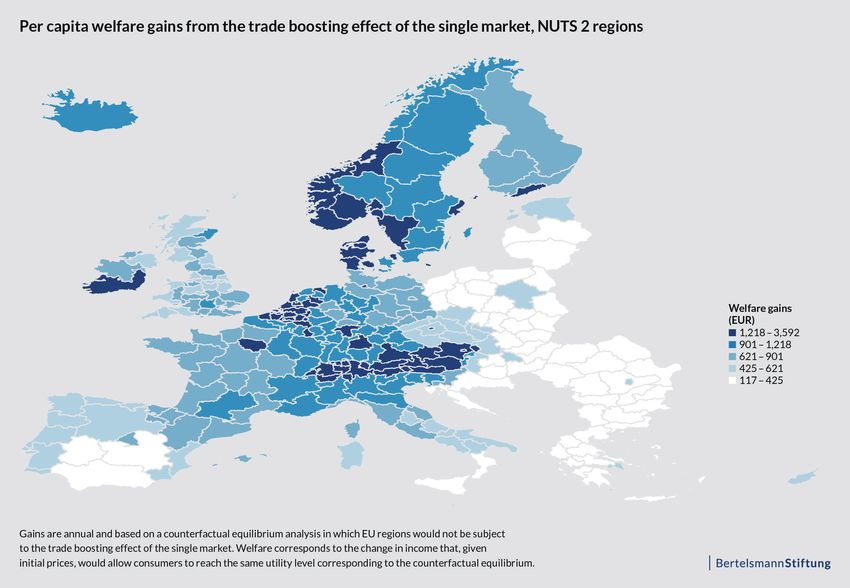
creasing in the size of the exporting and importing countries/regions and inversely
related to the distance and trade costs between the two countries/regions. In this re-
spect, abundant research and empirical evidence have demonstrated the robustness
and accuracy of these models that represent nowadays a standard in international
trade. These models are also very versatile and modern versions like ours incorpo-
rate several channels via which trade affects the economy.
    For example, our model features countries/regions that are more or less com-
petitive depending on the productivity of their firms and/or the cost of their labour
force as well as consumers buying differentiated varieties of products and services
produced anywhere in the world. It also allows for firms in each country/region
to be heterogeneous in their productivity and size and to be differentially affected
by trade exposure while at the same time incorporating the impacts of trade on
the degree of competition among firms and so ultimately on markups and prices.
Finally, it allows for entry and exit of firms to affect and be affected by trade and
for country size to be a determinant of trade patterns. Countries and regions in
our model trade with each other and trade is subject to trade costs. Any change in
trade barriers affects all countries/regions in a general equilibrium fashion via the
above channels and our model pins down these interdependencies and quantifies
the impact of changes in trade barriers on key economic outcomes: productivity,
markups, welfare and population. Our analysis of welfare changes is based on the
concept of equivalent variation as in Arkolakis et al. (2018). More specifically, we
compute the change in income that, given initial prices, would allow the represen-
tative consumer to reach the same utility level corresponding to the counterfactual
equilibrium. Loosely speaking, this corresponds to the income reduction/increase
equivalent to the counterfactual scenario in which the SM would have been removed.
    However, despite being rich and versatile our model, like any modern quanti-
tative trade model, is based upon assumptions that limit its capacity to be able to
speak about other important aspects. For example, our model has nothing to say
about how countries’/regions’ trade balances would be affected as we assume that
trade is balanced. At the same time, our model does not feature growth and so the
impact of trade on the speed of innovation is not accounted for. In the same vein, the
positive effects that European integration has on other important dimensions (i.e.,
innovation, education, culture and national security, to name a few) are not part of
our analysis either. Finally, our model also abstracts from the distribution of welfare
gains and losses due to changes in trade costs. Indeed, our model provides insights

                                          9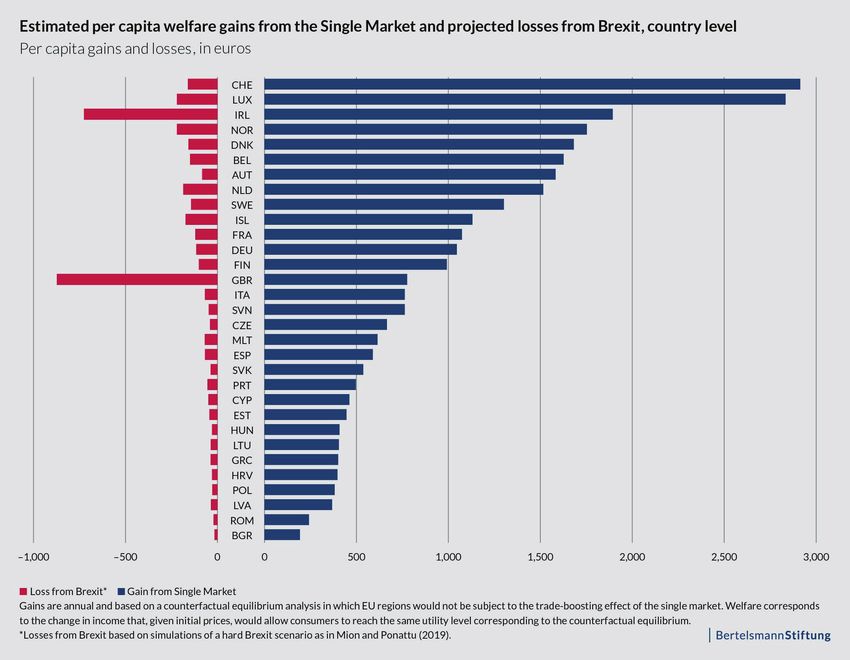
into overall gains and losses at the country/region level but has nothing to say about
who will be positively and/or negatively affected within a country/region. Finally,
the model does not consider "second-round" effects. For instance, an abolishment
of the SM could lead to a recession and a further contraction of trade, thereby fur-
ther reinforcing losses from weakened intra-EU trade. In this case, the estimated
welfare gains would understate the true size of the gains. By the same token, the
effects may be overstated, e.g., if countries were to respond to the sudden lack of the
SM by negotiating free trade agreements. In any case, it is important to note that
second-round effects can go into either direction.

3     Results
We present two sets of results. First, we work at the country level and document
the welfare gains stemming from the SM. In our analyses of welfare effects through
the SM, we focus on the 28 EU member states as well as the non-EU member states
Iceland, Norway and Switzerland added to the SM via the European Economic
Area (EEA) and bilateral trade agreements.4 Second, we focus on the regional level
and shed light on within-country heterogeneity of welfare gains through the Single
Market. We also discuss productivity and markup gains, suggesting that these are
the channels driving the welfare effect. Note that the counterfactual simulations
for countries and regions are separate simulations – that is, the country simulations
treat SM member countries as country units, while the region-wide quantification
treats the same set of countries as a collection of their respective regions.5

3.1 Countries
Table 1 summarizes our key results at the country level. Overall, we find that the
SM provides higher welfare, higher productivity and lower markups to all its mem-
bers while at the same time countries outside the SM are actually (slightly) worse
off because of the existence of the common market. Total aggregate welfare gains
(computed as monetary per capita gains times population) for countries in the Sin-
    4 Theonly country in the SM we do not cover in our analysis is Liechtenstein.
    5 Thus,the estimated economic impact for the same country can slightly differ across the simu-
lations. Whenever we refer to gains at the country level, we refer to the country-wide simulations.
When we refer to regional gains, we base our analysis on the region-wide simulations.

                                                10
gle Market sum up to 461 billion euros. In this respect, it is important to note that
these are yearly gains. Therefore, the one-off equivalent gain would be considerably
higher than the 461 billion euros estimated here. In terms of yearly per capita wel-
fare gains (in euros), the countries benefiting the most are Switzerland (2,914 euros),
Luxembourg (2,834 euros) and Ireland (1,894 euros). These gains can clearly be at-
tributed to the relatively high level of productivity in these countries, combined with
small population sizes and a high degree of openness of these economies. Gains in
monetary values are, however, also high for big economies with large population
sizes. For instance, France and Germany would be among the top 10 countries with
welfare gains of 1,074 and 1,046 euros per capita, respectively.
In terms of relative per capita welfare gains (in %) the results vary from 2.07%
of Iceland all the way up to 4.35% in Belgium. Again, Luxembourg (4.33%) and
Switzerland (4.02%) are among the top three countries. Notably, some Eastern Eu-
ropean countries see strong relative welfare gains, while monetary gains in absolute
terms are low – for example, the Czech Republic comes fourth with a relative welfare
gain of 3.99% due to gains from the SM. However, other countries in the periphery
like Greece and Bulgaria see both low welfare gains in absolute and relative terms,
suggesting that, at least partly, gains from the SM follow a core-periphery logic:
Countries in the southern and eastern European periphery do not appear to gain in
the same way that countries in the core do. These patterns will be discussed in more
detail when examining gains at the regional level in the following sections. The wel-
fare effects are mainly driven by changes in markups and productivity induced by
the SM. Thus, the productivity and markups ranking broadly follows the ranking of
relative welfare changes, albeit with somewhat smaller numbers.
11Table 1 12
3.2 Regions
While Table 1 summarizes our key results at the country level, it also masks a
substantial amount of within-country heterogeneity. Regions within countries are
asymmetrically exposed to trade integration, depending on their geographic posi-
tion, competitiveness, size, and the country they belong to. We hence now present
results for our counterfactual scenario by breaking down countries of the SM area
into their NUTS2 regions. Together with the rest-of-the-world countries we hence
run the model for 297 regions in total (283 NUTS2 regions, and 14 other OECD and
BRIC trading partners).
    Figures 1 and 2 depict per capita welfare gains (in euros) and relative gains (per-
centage changes in welfare), respectively, stemming from the SM for NUTS2 regions.
Such figures highlight the richness of the level of detail and heterogeneity that our
analysis can capture. A detailed table containing the information on regional gains
is provided in the Appendix. Based on both figures, we first observe strong het-
erogeneity in gains from the SM across Europe. Overall, it appears that regions
closer to the center benefit more strongly than those in the periphery. Indeed, Swiss
regions like Zurich (3,592 euros) and Ticino (3,238 euros) as well as the Brussels
region (2,473 euros) and Austrian regions like Voralberg (2,062 euros) and Salzburg
(2,038 euros) show the highest per capita gains. At the same time, regions in coun-
tries like Bulgaria, Greece and Romania indicate the lowest per capita welfare gains,
ranging from 117 euros to just about 500 euros. These observations give rise to a
core-periphery pattern across EU regions, where regions closer to the geographi-
cal core (i.e., countries like Germany, France, Belgium, Netherlands and Denmark)
benefit more strongly than regions in the southern and eastern periphery of Europe.
    Looking at relative welfare gains, however, slightly mitigates this pattern with
respect to Eastern Europe: relative to their GDP per capita level, regions in countries
like Hungary and Poland show strong welfare gains – which is consistent with the
catch up in Eastern Europe following the end of the Cold War and the accession
to the EU 15 years ago. However, both absolute and relative gains remain low for
regions in Bulgaria and Romania. Similarly, regions in Southern Italy, Greece and
Southern Spain are lagging behind in terms of both relative and absolute welfare
gains. We have further investigated the overall findings by relating, via a linear
regression, percentage changes to a group of covariates specific to each region. This
regression analysis underpins the aforementioned core-periphery pattern in that,

                                          13
for example, welfare changes are stronger for regions closer to the center of Europe
(higher market access effect).
Moreover, the regression results suggest that welfare gains are higher for re-
gions that are small and/or belong to a small country (for smaller regions and/or
countries trade in the SM is more important quantitatively) and regions with better
technology (more productive and innovative regions gain more from trade). Overall
these covariates explain about half of the variation in the data. The same regression
analysis reveals that population gains are stronger for regions experiencing higher
welfare gains, regions that are larger and regions that have less favourable climate
amenities (especially Northern Europe).
3.2.1 Within-country analyses
Figures 1 and 2 capture the regional heterogeneity from an aggregate EU-view. In-
stead, looking at regions within individual countries allows us to capture even more
within-country differences. It also enables us to uncover some patterns of regional
divergence in gains from the SM that are specific to certain countries. In this sec-
tion, we focus on the EU’s largest economies – Germany, the UK, France and Italy –
and discuss our results of regional SM gains and some of the potentially underlying
factors owing to these results.
Figure 3 depicts our findings on per capita gains from the SM (in euros).6 We
first consider Germany, in panel (a). It is evident that regions in the western
part of the country show significantly higher gains – with the region Oberbayern,
which includes Munich and the Ingolstadt area (Audi’s headquarters), exhibiting
the strongest gains of 1,489 euros, followed by Hamburg (1,478 euros) and Stuttgart
(1,304 euros), where Mercedes Benz is headquartered. Conversely, gains from the
SM are significantly lower in the eastern part of the country, with Brandenburg,
Saxony-Anhalt and Mecklenburg-West Pomerania exhibiting per capita gains rang-
ing between just 672 and 699 euros. The east-west divide also broadly holds when
assessing relative welfare gains, i.e., the gains from the SM relative to the current
level of real incomes – we document relative income changes in Figure 6 (in the Ap-
pendix). These differences between gains in the eastern and western parts primarily
stem from structural differences between the two sets of regions – with economies
6 See Figure 6 (in the Appendix) for graphical depictions on relative income changes due to the
SM.
14Figure 1 15
Figure 2

16
in the western regions being much more export-oriented and also more competi-
tive than those in the eastern regions. Thus, the trade boosting effect of the SM
is particularly pronounced in the west – with productivity increases and markups
reductions as the main drivers of the welfare effects.
    Turning to the UK, we first note that the variance of regional welfare gains (in
euros) is by far the highest among the largest EU economies – suggesting that re-
gional differences are the highest in the UK. Moreover, we document another spatial
pattern of SM gains in the UK. Specifically, by and large, regions in the south fea-
ture higher gains compared to regions in the north. Apart from the London NUTS2
regions with gains greater than 2,000 euros per capita, it is also regions like Oxford-
shire (985 euros) and Surrey/West Sussex (804 euros) that benefit greatly. Note that
the overall differences between the north and the south become even more evident
when looking at relative welfare gains (see Figure 6 in the Appendix). That is, gains
relative to income levels suggest that regions closer to the European continent gain
significantly more, which may well be due to better market access. Note that inner
London can be seen a special case in that per capita gains in euros are high, but
its per capita GDP is disproportionately high, so that relative gains appear to be
low. Strikingly, some UK regions that appear to have benefited quite strongly from
the SM have overwhelmingly voted for the UK to leave the EU in the 2016 Brexit
referendum. One example is the region of Kent, which features the highest relative
gain from the SM in the UK, but which overwhelmingly voted leave.
    France and Italy also reveal spatial patterns of welfare gains. In France, we ob-
serve that per capita gains appear to be higher in the east than in the west. Naturally,
the Paris region (Île-de-France) benefits greatly as it is a multinational hub within
the centralized France (yet, its high level of GDP implies a low relative change in
welfare). The Champagne-Ardenne and Alsace regions, both close to Germany, also
show high gains, essentially profiting from market access and positive spillovers
from cross-country trade due to the SM. In the west, however, regions like Poitou-
Charentes, Limousin and Basse-Normandie are all in the lowest quintile of gains
ranging from 736 to 827 euros. In Italy, gains from the SM differ as to whether
a region is part of the Mezzogiorno, the southern Italian regions, or the northern
ones. Gains from the SM are consistent with the well-studied socioeconomic divide
between the north and the south: While northern regions such as Bolzano (1,372
euros), Lombardy (1,081 euros) and Trento (1,073 euros) see strong welfare improve-
ments, gains from the SM in southern regions such as Calabria (392 euros) and Sicily

                                          17
(394 euros) are substantially lower. Since one of the channels through which welfare
increases materialize is productivity, our results suggest that gains from the SM may
have widened the productivity differences between the North and the South.
Finally, recall that our country analyses in the previous section show that regions
in small nations like Switzerland indicate the highest welfare gains from the SM.
Looking into Swiss regions, for instance, shows that the monetary gains are fairly
consistent with little variation across the seven regions at NUTS2 level: While Zurich
tops the ranking with welfare gains amounting to 3,592 euros per inhabitant, the
lowest welfare gain is recorded in the region of Eastern Switzerland at about 2,800
euros and thus about a 20% difference. Clearly, smaller countries are less likely
to exhibit strong regional differences in terms of the structure of the economy and
socioeconomic factors.
3.3 The impact of Brexit
The UK’s vote to leave the European Union (Brexit) is likely to exhibit a significant
impact on the UK economy (e.g., Dhingra et al., 2016). Previous works suggest that
living standards in the UK will strongly decline as a result of Brexit. In Mion and
Ponattu (2019), we use a gravity model of trade to estimate the economic impact
of both a soft and a hard Brexit for the same set of regions analyzed in this study.
We find that the UK alone would incur per capita income lasses of almost 900 eu-
ros annually in case of a hard Brexit scenario. On aggregate, the UK would see
income losses of about 57 billion euros annually – more than all other EU countries
combined. In this sub-section, we analyze gains from the Single Market and at the
same time investigate projected losses related to (a hard) Brexit – we thereby seek to
uncover any remarkable pattern of SM gains and Brexit losses across countries and
regions.
In Figure 4 we study the country level. First off, we observe that losses from
Brexit make up a small portion relative to the gains in incomes from the SM for
most countries. This reflects that, while the UK is an important trading partner, it is
clearly not the only significant one for most countries. Moreover, we observe that,
roughly, a decline in income gains from the SM is also associated with a decline in
Brexit losses – this pattern is consistent with the idea that both Brexit losses and SM
gains are sensitive to trade relationships and openness. However, among the upper
half of the countries gaining from the SM, we can note some significant deviation
18from this pattern. The UK and Ireland are clearly standing out, showing significant
income losses. The UK is the only country for which losses from Brexit even exceed
the gains from the SM. This of course reflects the country being hard hit by Brexit
– however, it also reflects that gains for the SM are among the lowest among large
economies in the EU. In the case of Ireland, high losses are clearly due to dense trade
relationships with the UK, which would suffer as a result of a hard Brexit scenario.
There are also other notable cases. For instance, Austria shows a particularly
low level of loss relative to the strong income gain from the SM; countries with
lower gains from the SM than Austria (e.g., the Netherlands, Sweden and Iceland)
indicate about double the loss (in per capita terms) from a hard Brexit than Austria
does. This finding could reflect the fact that Austria is, firstly, located further away
from the UK, which is consistent with a gravity model of trade. Secondly, for Austria
countries like Germany are a relatively more important trading partner than the UK.
Conversely, for countries like the Netherlands and Sweden, the UK appears to be
a more important trading partner than for Austria. To a weaker extent, this also
holds for the country gaining the most from the SM, Switzerland. Compared to its
followers in the SM ranking of income gains (Luxembourg, Norway and of course
Ireland), Switzerland’s Brexit losses are comparatively low.
Figure 5 takes a look at regional gains from the SM and Brexit losses. Here the
picture appears to be even more inconsistent: With a decline of per capita income
gains from the SM across regions, Brexit losses even slightly increase. This result,
however, owes to the fact that seven out of the 20 strongest gaining regions are Swiss
– where, as we state above, income losses due to Brexit are comparatively low. A
similar logic holds for the Austrian regions of Voralberg and Salzburg, which also
feature a low loss of Brexit relative to gains from the SM. Finally, we note that apart
from Ireland, regions in Luxembourg as well as in Norway (like Oslo) and in the
Netherlands (like Noord-Holland) appear to lose the most from Brexit relative to
income gains from the SM.
19Figure 3
(a) (b)
(c) (d)
20Figure 4 Figure 5 21
4   Conclusion
In this paper we provide quantitative insights into the economic benefits of the Eu-
ropean Single Market (SM) for countries and regions across Europe. More specifi-
cally, we evaluate the impact of the trade boosting effects of the SM on productivity,
markups, product variety and welfare. We use a gravity model approach and a
modern macroeconomic model of trade to estimate the value of the SM for citizens’
welfare across European countries and regions.
    The key highlights of our findings can be summarized as follows: First, the SM
provides higher welfare, higher productivity and lower markups to all its members
while at the same time countries outside are actually (slightly) worse off because of
the existence of the SM. Second, per capita percentage welfare gains for members
vary from 2.07% in Iceland up to 4.35% in Belgium while total aggregate welfare
gains (computed as per capita gains times population) for members of the SM pro-
gram amount to 461 billion euros. Yet, it is important to recall that these are yearly
gains and so one-off equivalent gains related to SM membership would be consid-
erably higher.
    Third, we document some evidence for a core-periphery pattern in gains from
the SM. Assessing regions, we find that welfare gains are stronger for regions closer
to the geographic center of Europe (due to the effect of higher market access). Also,
we find that regions that are small and/or belong to a small country benefit dispro-
portionately (for smaller regions and/or countries trade in the SM is more important
quantitatively). In addition, our results suggest that regions with better technology
benefit to a greater extent from the SM – since more productive and innovative
regions gain more from trade. Fourth, we also uncover and discuss regional dif-
ferences within countries. Specifically, we document differential gains from the SM
along differences between eastern and western regions (in Germany and France) as
well as broad differences between northern and southern regions (in Italy and the
UK). The results suggest that the SM may reinforce differential trends in productiv-
ity between regions and could thus contribute to widening regional disparities.
    Our model is based upon assumptions that leave aside other, potentially equally,
relevant factors. For example, we assume that trade is balanced and the model
does not include investment and growth – so the impact of trade on, for example,
the speed of innovation and other "second-round" effects is not accounted for. In
addition, the effect of European integration on other relevant factors such as values,

                                         22
political stability and national security are not part of our analysis either. Finally,
we also abstract from the distribution of welfare gains due to changes in trade costs.
Indeed, our model provides insights into overall gains, but does not specify who
will be positively or negatively affected within a country or region. Studying such
distributional effects of regional SM effects appears to be a promising avenue for
future research.
While the limitations of our approach could affect the magnitude of the results,
the relative differences between countries and regions are very likely to hold. These
differences should be of relevance to policymakers. Our results suggest that gains
from the SM may further reinforce pre-existing regional differences, this way adding
to the core-periphery pattern and inequality more generally. Since the channels via
which welfare effects operate in our model are productivity and markups, it is im-
portant for policy to focus on productivity-enhancing measures in regions where
gains from the SM appear to be low. This includes investment in (digital) infras-
tructure and upskilling in these countries and regions. These measures should all
be coherently put together in the context of the EU regional policy framework. In
addition, these measures could also be assessed in the current debate on a EU-wide
industrial policy approach. Moreover, promoting competition is vital to make sure
that all countries and regions reap the benefits of the SM with respect to both higher
productivity as well as lower prices. At the EU level, this calls for a level playing
field in many areas of competition policy. All such measures are particularly impor-
tant as some factors (like proximity to other economies) are unchangeable. Finally,
the SM may allow for even more welfare gains to materialize in the future. Almost
75% of EU-wide value added are based on services, yet, only about a third of all
EU exports are services. Better regulation on services trade could thus allow for an
even greater size of the economic pie to be achieved through the SM.
23References
Arkolakis, C., Costinot, A., Donaldson, D. and Rodriguez-Clare, A. (2018), ‘The
elusive pro-competitive effects of trade’, The Review of Economic Studies 86(1), 46–
80.
Arkolakis, C., Costinot, A. and Rodriguez-Clare, A. (2012), ‘New trade models, same
old gains?’, American Economic Review 102(1), 94–130.
Behrens, K., Mion, G., Murata, Y. and Südekum, J. (2014), ‘Trade, wages, and pro-
ductivity’, International Economic Review 55(4), 1305–1348.
Behrens, K., Mion, G., Murata, Y. and Suedekum, J. (2017), ‘Spatial frictions’, Journal
of Urban Economics 97, 40–70.
De Loecker, J. (2011), ‘Product differentiation, multiproduct firms, and estimating
the impact of trade liberalization on productivity’, Econometrica 79(5), 1407–1451.
De Loecker, J., Goldberg, P. K., Khandelwal, A. K. and Pavcnik, N. (2016), ‘Prices,
markups, and trade reform’, Econometrica 84(2), 445–510.
Dhingra, S., Ottaviano, G. I., Sampson, T. and Reenen, J. V. (2016), ‘The consequences
of Brexit for UK trade and living standards’, CEP Brexit Analysis No. 2.
Feenstra, R. C. and Weinstein, D. E. (2017), ‘Globalization, markups, and US welfare’,
Journal of Political Economy 125(4), 1040–1074.
Felbermayr, G., Gröschl, J. and Heiland, I. (2018), ‘Undoing europe in a new quanti-
tative trade model’, ifo Institute Working Paper No. 250.
Mion, G. and Ponattu, D. (2019), ‘Estimating the economic impact of Brexit on Eu-
ropean countries and regions’, Bertelsmann Stiftung Policy Paper 03/19.
Simonovska, I. (2015), ‘Income differences and prices of tradables: Insights from an
online retailer’, The Review of Economic Studies 82(4), 1612–1656.
24Appendix
25Table 2 26
Continuation of Table 2

          27
Continuation of Table 2
28Continuation of Table 2
29Continuation of Table 2
30Figure 6
(a) (b)
(c) (d)
31Address | Contact Bertelsmann Stiftung Carl-Bertelsmann-Straße 256 33311 Gütersloh Telephone +49 5241 81-0 Dr. Dominic Ponattu Project Manager Programme Europe’s Future Telephone +49 5241 81-81495 Fax +49 5241 81-681495 dominic.ponattu@bertelsmann-stiftung.de www.bertelsmann-stiftung.de
You can also read