Tick-Borne Encephalitis Virus and Its European Distribution in Ticks and Endothermic Mammals - MDPI
←
→
Page content transcription
If your browser does not render page correctly, please read the page content below
microorganisms
Article
Tick-Borne Encephalitis Virus and Its European
Distribution in Ticks and Endothermic Mammals
Melanie Walter        , Janna R. Vogelgesang, Franz Rubel         and Katharina Brugger *
 Unit for Veterinary Public Health and Epidemiology, University of Veterinary Medicine Vienna,
 1210 Vienna, Austria; melanie.walter@vetmeduni.ac.at (M.W.); janna.vogelgesang@vetmeduni.ac.at (J.R.V.);
 franz.rubel@vetmeduni.ac.at (F.R.)
 * Correspondence: katharina.brugger@vetmeduni.ac.at

 Received: 24 June 2020; Accepted: 15 July 2020; Published: 17 July 2020

 Abstract: Tick-borne encephalitis (TBE) is the most common viral tick-borne disease in Europe
 causing thousands of human infections every year. Available risk maps in Europe are solely based
 on human incidences, but often underestimate areas with TBE virus circulation as shown by several
 autochthonous cases detected outside known risk areas. A dataset of more than 1300 georeferenced
 TBE virus detections in ticks and mammals except for humans was compiled and used to estimate the
 probability of TBE virus presence in Europe. For this, a random forests model was implemented using
 temperature- and precipitation-dependent bioclimatic variables of the WorldClim dataset, altitude,
 as well as land cover of the ESA GlobCover dataset. The highest probabilities of TBE virus presence
 were identified in Central Europe, in the south of the Nordic countries, and in the Baltic countries.
 The model performance was evaluated by an out-of-bag error (OOB) of 0.174 and a high area under
 the curve value (AUC) of 0.905. The TBE virus presence maps may subsequently be used to estimate
 the risk of TBE virus infections in humans and can support decision-makers to identify TBE risk areas
 and to encourage people to take appropriate actions against tick bites and TBE virus infections.

 Keywords: tick-borne disease; TBE; Ixodes ricinus; exposure; hazard; risk; map; species distribution
 model; random forests

1. Introduction
     In Europe, tick-borne encephalitis (TBE) is the most common viral tick-borne disease of the
central nervous system. The causative agent, the TBE virus, is transmitted to humans mainly by
the widespread tick species Ixodes ricinus, but it may also be acquired via consumption of infected
unpasteurized dairy products [1]. In the European Union, around 3000 human TBE cases are reported
annually [2]. It is estimated that these are one-third of all TBE virus infections, which manifested in
severe clinical neurological conditions and laboratory confirmed. The other two-thirds of human TBE
virus infections remain asymptomatic or have mild-clinical symptoms [2]. More detailed information
on pathogenesis, clinical picture, case definition, and other interesting aspects are reviewed by
Růžek et al. [3] recently.
     The European Centre for Disease Prevention and Control (ECDC) provides regularly updated
standardized TBE incidence maps [2]. Using the European Union TBE case definition [4], the incidence
is given as numbers of cases per population of 100,000 summarized on socio-economic regions at
NUTS-2 or NUTS-3 level. Another European TBE distribution map is a combination of national risk
maps depicting TBE endemic regions [5]. These maps are provided by national health authorities and
are based on different TBE case definitions and risk assessments (an overview for each country is given
in Dobler et al. [6]). Previously, human cases were seen as an indicator for the occurrence of future
infections as TBE virus circulates in certain areas over many years. Nevertheless, each year several

Microorganisms 2020, 8, 1065; doi:10.3390/microorganisms8071065            www.mdpi.com/journal/microorganisms
Microorganisms 2020, 8, 1065                                                                         2 of 12

autochthonous cases have been detected outside the official risk areas. For example, in Germany about
15% of all TBE human cases since 2001 acquired their infection outside the official risk areas [7,8].
     In addition to these case-based approaches, a comprehensive spatial risk assessment for human
tick-borne diseases needs the identification and quantification of the hazard, i.e., the potential source of
harm, and characterisation of the exposure, i.e., the intensity of contact with the hazard [9]. As depicted
in Figure 1, the hazard in case of TBE is on the one hand TBE virus presence and on the other hand
tick presence or density. Exposure means human occupational or recreational activities outdoors
which is influenced e.g., by behavioural factors, attractiveness of the landscape, demography, or
vaccination rate against TBE virus [10,11]. Here, we are focusing on the hazard of TBE virus presence.
Instead of human TBE cases we compiled published TBE virus detections in both ticks as vectors and
endothermic mammals as hosts. Mapping these data provides an insight into the spatial distribution
of TBE virus. A so-called species distribution model (SDM) was then implemented to compile a
high-resolution map of the probability of TBE virus presence. For this, the locations of TBE virus
detected in ticks and endothermic mammals were used as response variables and environmental
variables as predictors. SDMs have been introduced in the mid eighties [12] to estimate the potential
(continental) distribution of plant or animal species depending on climate parameters [13]. In the
past 15 years, SDMs have been increasingly used for predicting the potential distribution of infectious
diseases as part of risk assessments [14]. For this, either the distribution of pathogens or disease cases
themselves (e.g., West Nile Fever [15], Usutu virus [16], or chikungunya virus [17]) was modelled
or—in the case of vector-borne pathogens—solely the vectors such as mosquitoes [18] or ticks [19].
In the case of species distribution models for TBE recent publications are focusing only on limited
areas e.g., Finland [20] or the so called DACH region, i.e., Germany, Austria, Switzerland [21].

     Figure 1. Assessing the spatial risk for human tick-borne encephalitis results from a combination
     of hazard (virus presence and tick presence/density) and exposure (e.g., human outdoor activity,
     vaccination rate) triggered by abiotic and biotic environment.

2. Materials and Methods

2.1. Tick-Borne Encephalitis Virus Detections in Ticks and Endothermic Mammals
     A comprehensive literature search on TBE virus detections in ticks and endothermic mammals
was conducted to compile a dataset of georeferenced locations. The search was performed on the
Scopus, PubMed, and Web of Science databases for the period from the inception of these databases
to September 2019. The search terms included ‘tick-borne encephalitis’, ‘tick-borne disease’, ‘TBE’,
and ‘tick + encephalitis’. In addition the terms were also used in the European national languages,
Microorganisms 2020, 8, 1065 3 of 12
e.g., ‘Frühsommer-Meningoenzephalitis’ and ‘FSME’ for the German literature, ‘kleszczowe zapalenie
mózgu’ for the Polish literature, ‘Fästing-buren encefalitviruset’ for Swedisch literature, or ‘encéphalite
à tiques’ for the French literature. Furthermore, additional publications were added by reviewing
the article references. The herein accepted virus detection methods ranged from molecular (direct) to
serological (indirect) techniques and improved constantly over the past decades [22]. Although the
comparability of detection methods is discussed controversially regarding the reliability of on-going
TBE virus circulation [23], all of them were included in the dataset as a qualitative virus present/absent
decision, which is of main interest here rather than a quantitative indication of prevalence. Locations of
TBE virus detections were given as exact geographical coordinates, precise site descriptions (i.e., place
and town names), or maps. In case of the latter two, the geographical coordinates were estimated or
the exact coordinates were provided by the authors upon request. Focusing on the main endemic area
of TBE in Europe, we concentrated on the geographical region of 2.5◦ –25.0◦ E/45.0◦ –62.5◦ N.
2.2. Environmental Variables
In this study, mapping the distribution of TBE virus in ticks and endothermic mammals included
bioclimatic variables, altitude, and a classification of land cover. All variables are available with a high
spatial resolution throughout Europe. The bioclimatic variables were taken from the WorldClim
database version 2 [24]. Derived from high-resolution monthly temperature and precipitation
data, this dataset comprises 19 bioclimatic variables such as annual mean temperature and annual
precipitation. We used the dataset with a spatial resolution of 2.5 arcmin, corresponding to a mean grid
cell size of about 13 km2 . To avoid multicollinearity and known spatial artefacts [25] the variable set
was reduced to 6 bioclimatic variables (Table 1). The altitude of the locations with TBE virus detections
ranged from 0 to 1500 m (median 247 m).
Table 1. Median and range of bioclimatic variables observed at the locations of tick-borne encephalitis
virus detections in both ticks and endothermic mammals.
Bioclimatic Variables Abbr. Min. Median Max. Unit
Mean annual temperature bio01 2.9 8.3 13.0 ◦C
Mean diurnal temperature range bio02 4.7 8.0 11.2 ◦C
Isothermality bio03 20.9 29.7 36.0 ◦C
Temperature seasonality bio04 488.5 701.6 868.4 ◦C
Annual precipitation bio12 483.0 710.0 3451.0 mm/a
Precipitation seasonality bio15 8.8 26.6 49.3 mm/a
Additionally, the satellite-based ESA GlobCover 2009 dataset was used [26]. This dataset provides
22 land cover types worldwide and 20 land cover types in the model area, respectively. Here, the types
were combined into 7 main classes: (A) agriculture areas, (B) broad-leaved forest, (C) coniferous
forest, (M) mixed forest, (V) low vegetation, (U) urban areas, and (X) unsuitable areas (Table 2).
As the GlobCover data have a higher spatial resolution of 10 arcsec, they were aggregated to the map
resolution of 2.5 arcmin by calculating modal values.Microorganisms 2020, 8, 1065 4 of 12
Table 2. GlobCover land cover types [26] occurring in the model area were combined into 7 main
classes: (A) agriculture areas, (B) broad-leaved forest, (C) coniferous forest, (M) mixed forest, (V) low
vegetation, (U) urban areas, and (X) unsuitable areas.
Class GlobCover Global Legend Value
(A) Post-flooding or irrigated croplands 11
Rainfed croplands 14
Mosaic cropland (50–70%)/vegetation (grassland, shrubland, forest) (20–50%) 20
Mosaic vegetation (grassland, shrubland, forest) (50–70%)/cropland (20–50%) 30
(B) Closed to open (>15%) broadleaved evergreen and/or semi-deciduous forest (>5 m) 40
Closed (>40%) broadleaved deciduous forest (>5 m) 50
Open (15–40%) broadleaved deciduous forest (>5 m) 60
(C) Closed (>40%) needleleaved evergreen forest (>5 m) 70
Open (15–40%) needleleaved deciduous or evergreen forest (>5 m) 90
(M) Closed to open (>15%) mixed broadleaved and needleleaved forest (>5 m) 100
Mosaic forest/shrubland (50–70%)/grassland (20–50%) 110
(V) Mosaic grassland (50–70%)/forest/shrubland (20–50%) 120
Closed to open (>15%) shrubland (15%) grassland 140
Sparse (>15%) vegetation (woody vegetation, shrubs, grassland) 150
Closed to open (>15%) vegetation (grassland, shrubland, woody vegetation) on 180
regularly flooded or waterlogged soil – Fresh, brackish or saline water
(U) Artificial surfaces and associated areas (urban areas >50%) 190
(X) Bare areas 200
Water bodies 210
Permanent snow and ice 220
2.3. Random Forests Model
The random forests model is a machine-learning algorithm based on classification trees and
so-called bagging methods, i.e., bootstrapping and aggregating [27]. Classification trees combine the
idea of data splitting to develop a binary tree and subsequent error minimization at each knot. In a
recent study, the random forests model performed best for predicting virus presence in unsampled
areas compared to other species distribution models [16]. The random forests model is used to
interpolate the observed locations of TBE virus presence in ticks and endothermic mammals on a
regular grid indicating the probability of the TBE virus being present in a given cell. This probability
ranges from 0 to 1 on a continuous scale and the traditional threshold of 0.5 was set. A value greater
than 0.5 implies that TBE virus is rather present than absent. Moreover, the threshold can be interpreted
as distinction between endemic and non-endemic areas for TBE virus.
Besides environmental predictors, the random forests model also needs presence and
(pseudo-)absence grid cells of the response variable. A grid cell is defined as a presence cell, if at
least one TBE virus-positive tick or endothermic mammal was found in it. As absence grid cells were
usually not available, they were generated synthetically. Grid cells with virus absence were randomly
selected with numbers equal to grid cells with virus presence, but at least 12 grid cells away from a
presence cell. The selection of absence grid cells has an impact on model performance [28], so we ran
the model 1000 times in order to receive a representative average. Further, the model was tuned using
a number of 1000 trees and an inflation of 1.5 of the variable number at each step.
The out-of-bag (OOB) error was used for quantifying the model prediction error. This measure
utilizes bootstrapping and aggregating to sub-sample the observation data into training samples.
Then the mean prediction error of each sample, using only the trees that did not have it in their
bootstrap sample, is calculated [27]. Additionally, the model performance was evaluated by calculating
the threshold-independent area under the receiver operated curve (AUC) value, defined within the
range of 0.5 and 1.0, where 0.5 implies totally random predictions [29].Microorganisms 2020, 8, 1065 5 of 12
The implementation of the random forests model and all calculations were conducted using
the open-source statistical software R [30]. The package raster was used for compiling the gridded
datasets and mapping the results [31], the package randomForest for implementing the random forests
model [32], and the package spThin for spatially thinning clustered TBE virus locations [33].
3. Results
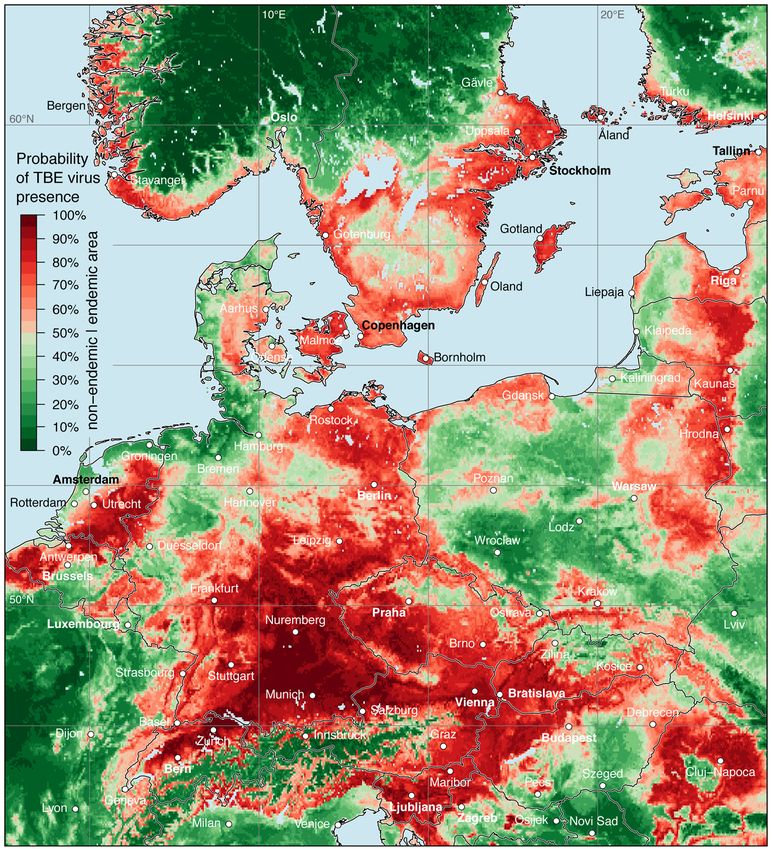
The georeferenced locations of TBE virus detections in both ticks and endothermic mammals
exept for humans are shown in Figure 2. Focusing on the main endemic area in Europe, 889 locations
with TBE virus detections in endothermic mammals and 444 locations with detections in ticks were
taken from of a total of 133 publications. The complete list is given in the Supplementary Materials.
Figure 2. Georeferenced tick-borne encephalitis (TBE) virus detections in ticks (blue), mainly the castor
bean tick Ixodes ricinus, and endothermic mammals except for humans (purple). Additionally, the sort
of national notification system for human TBE cases is given.Microorganisms 2020, 8, 1065 6 of 12
Georeferenced detections of TBE virus-infected ticks were mostly Ixodes ricinus (n = 350, 78.8%).
Virus detections in endothermic mammals include wild mammals such as rodents, deer, or wild
boars (n = 372, 41.8%) as well as domestic animals such as dogs, horses, or cattle (n = 517, 58.2%).
Please note that at some locations TBE virus was detected in more than one species. By using a spatial
thinning algorithm, the dataset was optimized to address the known problems with spatial sampling
biases, e.g., due to clustered data [34]. With an appropriate distance of 20 km the dataset was reduced
to 447 (35.5%) of previously 1333 locations where TBE virus was detected. As depicted in Figure 3,
the majority of the selected locations lay in the land cover class agriculture areas (n = 217, 48.5%),
followed by broad-leaved forest (n = 92, 20.6%) and coniferous forest (n = 40, 8.9%).
Figure 3. Frequency distribution of locations with tick-borne encephalitis virus detections in both ticks
and endothermic mammals of the subsample used for the random forests model (n = 447). Absolute
frequencies depict the number of locations, relative frequencies the fraction of locations in the different
land cover classes.
The result of the random forests model, i.e., the distribution map of the probability of TBE virus
presence in Europe is shown in Figure 4. As discussed above, the spatial probability of TBE virus
presence was predicted based on virus detections and environmental predictors. A probability between
0.5 and 1.0 indicates that an area (grid cell) is more likely to be categorized as a virus presence/endemic
cell than an absence/non-endemic cell by the random forests model. On the other hand, a probability
lower than 0.5 indicates an area, that is more likely to be categorized as an absence than a presence cell.
For several regions a high probability of TBE virus presence was identified and TBE virus
circulation can reasonably be assumed. Starting from the western part of the model area, a high
TBE virus presence was predicted for the eastern part of France (mainly Alsace), Belgium except
northern Wallonia, the Netherlands, and Denmark. Only along the coastal areas of the North Sea the
probability was lower. Major parts of Germany were indicated as TBE virus-endemic area, with highest
probabilities determined for Bavaria and Baden-Württemberg. The western part of the federal state
Schleswig-Holstein, East Frisian Peninsula, and Oldenburg Münsterland in Lower Saxony, as well as
the Ruhr region and Münsterland in North Rhine-Westphalia were indicated as non-endemic areas.
Apart from the Alpine region, high probabilities of TBE virus presence were predicted for
almost all of Switzerland, Austria, Slovenia, and the northern part of Italy along the foothills.
High probabilities were also calculated for large parts of the Czech Republic, Slovakia except the
Western Carpathians, the northern parts of Hungary, along the eastern and western border of Poland,
and in the Baltic countries. In the northern part of the model area, high probabilities were predictedMicroorganisms 2020, 8, 1065 7 of 12
for the south-western coast of Norway, in Sweden south of the biogeographically boarder traditionally
named Limes norrlandicus, the southern coast of Finland, and the Åland Islands.
Figure 4. Probability of tick-borne encephalitis virus presence in both ticks and endothermic mammals
except for humans. Endemic areas, i.e., a probability from 0.5 to 1.0, are indicated in light red to dark
red and non-endemic areas are indicted from dark green to light green.
The model performance was evaluated by an out-of-bag error of OOB = 0.174, that means only
17.4% of all OOB observations (not used for fitting a specific tree) were classified incorrectly by
the random forests model, but 82.6% were classified correctly. Further, a verification measure of
AUC = 0.905 indicates a good model performance as well as a sensitivity of 0.842 and a specificity
of 0.813.
Random forests models provide a ranking of the most important environmental variables for
model fitting and prediction by means of decrease in accuracy. High values of mean decrease in
accuracy indicate variables that are important for model performance [35]. As shown in Figure 5,Microorganisms 2020, 8, 1065 8 of 12
mean annual temperature, altitude, and temperature seasonality were most important to predict the
probability of TBE virus presence. Removing the mean annual temperature from the set of possible
environmental predictors would result in a mean decrease in model accuracy of 15.5%, for altitude of
9.0%, and temperature seasonality of 7.6%.
Figure 5. Ranking of the eight used environmental variables according to the mean decrease in accuracy.
4. Discussion
Here, we present a newly compiled dataset of georeferenced TBE virus detections in ticks and
endothermic mammals. This dataset together with environmental variables was used for mapping
the probability of TBE virus presence in different parts of Europe. For this a random forests model,
a machine-learning species distribution model, was implemented.
Species distribution models represent an alternative approach for predicting the potential
geographical distribution of infectious diseases by means of georeferenced pathogen and/or disease
detections and associated environmental or disease-influencing variables. Such models treat the
entire disease system, i.e., in case of TBE the virus–vector–host interaction, as a so-called black box.
As an advantage of this approach, SDMs are relatively easy and cost-effective to implement and
deliver results quickly [13]. One limitation is that a lack of data on TBE virus detections in some
regions can lead to false negative results (i.e., low probability of virus presence vs. on-going TBE virus
circulation) [13].
For some years, there is a trend away from case-based towards hazard/exposure-based risk
assessments for tick-borne diseases such as TBE or Lyme borreliosis [36,37]. Complementary risk
assessments are needed to encourage the local population in endemic regions but also travellers to
apply proper prophylactic measures to avoid tick bites and tick-borne infections. Available incidence
maps of human TBE cases and maps of national risk areas have usually a rather coarse spatial resolution.
As based merely on proven human TBE cases, they may underestimate the risk in areas outside the
known risk areas.
In addition, using virus detections in ticks and endothermic mammals as a response variable
has several advantages. Probably the most important point is that georeferenced locations of virus
detections in ticks and endothermic mammals are usually published in scientific literature. In contrast,
human disease data are so-called sensitive personal data as specified in data protection regulations [38].
For nations with mandatory disease notification systems (Figure 2), human incidence data are only
provided on NUT-2 or NUT-3 level, which is far too coarse for SDMs. Apart from that, the sampled
mammal species are site-loyal and have a home range from 0.002 km2 in case of the bank vole
(Myodes glareolus [39]) or up to approximately 0.23 km2 in case of roe deer (Capreolus capreolus [40]).
Possible inaccuracies of the georeferenced locations were compensated by the choice of the model
resolution of 2.5 arcmin, which correspond to a mean grid cell size of 13 km2 .Microorganisms 2020, 8, 1065 9 of 12
A visual comparison of the here presented map of the probability of TBE virus presence in different
areas in Europe with the two so far available human risk maps [2,5] shows good match with known
human risk areas (e.g., Bavaria and Baden-Württemberg in Germany, Slovenia, western Hungary,
southern Czech Republic, and western Slovakia). Additionally, areas with a moderate probability
of virus presence were indicated in so far non-official risk areas, but with reported autochthonous
human cases (e.g., northern federal states of Germany [7], the Netherlands [41]). Furthermore, directly
comparing the mean probability of TBE virus presence with the mean human TBE incidence (numbers
of cases per population of 100,000) for the period 2001–2019 [8] in Germany on NUTS-3 level results in
a strong Spearman’s correlation coefficient of 0.689 (p < 0.001).
A high probability of TBE virus presence is not always associated with a high human TBE
incidence. One reason for this is the non-homogenous human population density in Europe.
For instance, in southern Sweden there is a high probability of virus presence, but human cases are
mainly reported in areas with a high human population density, e.g., in the greater Stockholm region
and in the last years increasingly around the great lakes Vättern, Vänern, and Mälaren [42]. A similar
pattern is also observed in northern Germany where in sparsely populated regions only individual
human TBE cases were reported [8]. Another reason is the vaccination coverage which varies widely
between various regions in Europe [43]. For example, Austria population has a vaccination coverage of
more than 80% (fraction of the population which received at least one TBE vaccination, i.e., ≥1 vaccine
dose) since the end of the nineties and this has led to a significant decline in the annual number of
human TBE cases [44,45].
The so far available (national) risk maps are based on various human TBE case definitions and
risk assessments [46], and thus comparisons between different parts of Europe should be treated with
caution. In contrast, for the map of TBE virus presence compiled here a uniform cross-national approach
was applied and provides for the first time an Europewide consistent insight on the presence of TBE
virus. The next step for the identification and quantification of a hazard will be the simulation of the
density of host-seeking ticks European wide as already available for some European countries [47,48].
Together with the characterisation of the human exposure, this is necessary towards a comprehensive
spatial risk assessment.
Supplementary Materials: The following are available online at http://www.mdpi.com/2076-2607/8/7/1065/s1.
Complete list of the references with georeferenced tick-borne encephalitis virus detections in ticks and endothermic
mammals except for humans used in this study.
Author Contributions: K.B., M.W., and F.R. contributed to the conception and design of the study; K.B., J.R.V.,
and M.W. performed the data collection; M.W. implemented the random forests model; M.W. and K.B. analysed
and visualized the data; K.B. and M.W. wrote the first draft of the manuscript; all authors contributed to manuscript
revision. All authors have read and agreed to the published version of the manuscript.
Funding: This research received no external funding.
Acknowledgments: We like to thank Sophie Diexer, Marilena Plank, Lisa Eberhardt, and Sandra Ben Fadel for
their assistance in literature search and data collection. We are very grateful to Olaf Kahl for critical reading the
manuscript, his valuable hints, and our fruitful discussions. A special thanks goes to Teresa G. Valencak for her
constructive criticism on the manuscript.
Conflicts of Interest: The authors declare no conflict of interest.
References
1. Lindquist, L.; Vapalahti, O. Tick-borne encephalitis. Lancet 2008, 371, 1861–1871. [CrossRef]
2. Beauté, J.; Spiteri, G.; Warns-Petit, E.; Zeller, H. Tick-borne encephalitis in Europe, 2012 to 2016. Euro Surveill.
2018, 23, 1800201. [CrossRef] [PubMed]
3. Růžek, D.; Avšič-Županc, T.; Borde, J.; Chrdle, A.; Eyer, L.; Karganova, G.; Kholodilov, I.; Knap, N.;
Kozlovskaya, L.; Matveev, A.; et al. Tick-borne encephalitis in Europe and Russia: Review of pathogenesis,
clinical features, therapy, and vaccines. Antiviral Res. 2019, 164, 23–51. [CrossRef] [PubMed]Microorganisms 2020, 8, 1065 10 of 12
4. EU Commission. Commission Implementing Decision 2012/506/EU of 8 August 2012 amending Decision
2002/253/EC laying down case definitions for reporting communicable diseases to the Community network
under Decision No 2119/98/EC of the European Parliament and of the Council. Off. J. Eur. Union 2012,
L262, 57.
5. Pfizer Germany GmbH. TBE in Europe. 2019. Available online: https://www.zecken.de/en/tbe-europe
(accessed on 1 October 2019).
6. Dobler, G.; Erber, W.; Bröker, M.; Schmitt, H.J. (Eds.) Tick-Borne Encephalitis (TBE)—The Book, 2nd ed.; Global
Health Press Pte Ltd.: Singapore, 2019.
7. Robert Koch-Institut. [FSME: Risikogebiete in Deutschland (Stand: Januar 2020)], in German. Epid. Bull.
2020, 8, 3–19. [CrossRef]
8. Robert Koch-Institute. SurvStat@RKI 2.0. 2020. Available online: https://survstat.rki.de (accessed on
12 June 2020).
9. Hosseini, P.R.; Mills, J.N.; Prieur-Richard, A.H.; Ezenwa, V.O.; Bailly, X.; Rizzoli, A.; Suzán, G.; Vittecoq, M.;
García-Peña, G.E.; Daszak, P.; et al. Does the impact of biodiversity differ between emerging and endemic
pathogens? The need to separate the concepts of hazard and risk. Philos. Trans. R. Soc. B 2017, 372, 20160129.
[CrossRef]
10. Zeimes, C.B.; Olsson, G.E.; Hjertqvist, M.; Vanwambeke, S.O. Shaping zoonosis risk: Landscape ecology
vs. landscape attractiveness for people, the case of tick-borne encephalitis in Sweden. Parasit. Vectors 2014,
7, 370. [CrossRef]
11. Keukeleire, M.D.; Vanwambeke, S.O.; Somassè, E.; Kabamba, B.; Luyasu, V.; Robert, A. Scouts, forests, and
ticks: Impact of landscapes on human-tick contacts. Ticks Tick-Borne Dis. 2015, 6, 636–644. [CrossRef]
12. Busby, J.R. A biogeoclimatic analysis of Nothofagus cunninghamii (Hook.) Oerst. in southeastern Australia.
Austral Ecol. 1986, 11, 1–7. [CrossRef]
13. Peterson, A.T.; Soberón, J.; Pearson, R.G.; Anderson, R.P.; Martínez-Meyer, E.; Nakamura, M.; Araú, M.B.
Ecological Niches and Geographic Distributions, 1st ed.; Princeton University Press: Princeton, NJ, USA, 2011.
14. Peterson, A.T. Ecologic niche modeling and spatial patterns of disease transmission. Emerg. Infect. Dis. 2006,
12, 1822–1826. [CrossRef]
15. García-Bocanegra, I.; Belkhiria, J.; Napp, S.; Cano-Terriza, D.; Jiménez-Ruiz, S.; Martínez-López, B.
Epidemiology and spatio-temporal analysis of West Nile virus in horses in Spain between 2010 and 2016.
Transbound. Emerg. Dis. 2017, 65, 567–577. [CrossRef] [PubMed]
16. Walter, M.; Brugger, K.; Rubel, F. Usutu virus induced mass mortalities of songbirds in Central Europe: Are
habitat models suitable to predict dead birds in unsampled regions? Prev. Vet. Med. 2018, 159, 162–170.
[CrossRef]
17. Nsoesie, E.O.; Kraemer, M.U.; Golding, N.; Pigott, D.M.; Brady, O.J.; Moyes, C.L.; Johansson, M.A.; Gething,
P.W.; Velayudhan, R.; Khan, K.; et al. Global distribution and environmental suitability for chikungunya
virus, 1952 to 2015. Euro Surveill. 2016, 21, 30234. [CrossRef] [PubMed]
18. Melaun, C.; Werblow, A.; Cunze, S.; Zotzmann, S.; Koch, L.K.; Mehlhorn, H.; Dörge, D.D.; Huber, K.;
Tackenberg, O.; Klimpel, S. Modeling of the putative distribution of the arbovirus vector Ochlerotatus
japonicus japonicus (Diptera: Culicidae) in Germany. Parasitol. Res. 2015, 114, 1051–1061. [CrossRef]
[PubMed]
19. Walter, M.; Brugger, K.; Rubel, F. The ecological niche of Dermacentor marginatus in Germany. Parasitol. Res.
2016, 115, 2165–2174. [CrossRef]
20. Uusitalo, R.; Siljander, M.; Dub, T.; Sane, J.; Sormunen, J.J.; Pellikka, P.; Vapalahti, O. Modelling habitat
suitability for occurrence of human tick-borne encephalitis (TBE) cases in Finland. Ticks Tick-Borne Dis. 2020,
11, 101457. [CrossRef]
21. Walter, M.; Brugger, K. Habitatmodellierung für das FSME-Virus in Deutschland. In FSME in Deutschland:
Stand der Wissenschaft; Rubel, F., Schiffner-Rohe, J., Eds.; DeutscherWissenschafts-Verlag: Baden-Baden,
Germany, 2019; pp. 229–241. (In German)
22. Boonham, N.; Kreuze, J.; Winter, S.; van der Vlugt, R.; Bergervoet, J.; Tomlinson, J.; Mumford, R. Methods in
virus diagnostics: From ELISA to next generation sequencing. Virus Res. 2014, 186, 20–31. [CrossRef]
23. Ergunay, K.; Tkachev, S.; Kozlova, I.; Růžek, D. A review of methods for detecting tick-borne encephalitis
virus infection in tick, animal, and human specimens. Vector-Borne Zoonotic Dis. 2016, 16, 4–12. [CrossRef]Microorganisms 2020, 8, 1065 11 of 12
24. Fick, S.E.; Hijmans, R.J. WorldClim 2: New 1-km spatial resolution climate surfaces for global land areas.
Int. J. Climatol. 2017, 37, 4302–4315. [CrossRef]
25. Samy, A.M.; Peterson, A.T. Climate change influences on the global potential distribution of bluetongue virus.
PLoS ONE 2016, 11, e0150489. [CrossRef]
26. European Space Agency. GlobCover 2009 (Global Land Cover Map). 2010. Available online: http:
//due.esrin.esa.int/page_globcover.php (accessed on 12 June 2020).
27. Breiman, L. Random forests. Mach. Learn. 2001, 45, 5–32. [CrossRef]
28. Barbet-Massin, M.; Jiguet, F.; Albert, C.H.; Thuiller, W. Selecting pseudo-absences for species distribution
models: how, where and how many? Methods Ecol. Evol. 2012, 3, 327–338. [CrossRef]
29. Mason, S.J.; Graham, N.E. Areas beneath the relative operating characteristics (ROC) and relative operating
levels (ROL) curves: Statistical significance and interpretation. Q. J. R. Meteorol. Soc. 2002, 128, 2145–2166.
[CrossRef]
30. R Core Team. R: A Language and Environment for Statistical Computing. 2020. Available online:
https://www.r-project.org (accessed on 12 June 2020).
31. Hijmans, R.J.; van Etten, J.; Sumner, M.; Cheng, J.; Bevan, A.; Bivand, R.; Busetto, L.; Canty, M.; Forrest, D.;
Ghosh, A.; et al. raster: Geographic Data Analysis and Modeling. 2020. Available online: http://cran.at.r-
project.org/package=raster (accessed on 12 June 2020).
32. Liaw, A.; Wiener, M. randomForest: Breiman and Cutler’s Random Forests for Classification and Regression.
2018. Available online: https://cran.r-project.org/web/packages/randomForest/index.html (accessed on
12 June 2020).
33. Aiello-Lammens, M.E.; Boria, R.A.; Radosavljevic, A.; Vilela, B.; Anderson, R.P.; Bjornson, R.; Weston, S.
spThin: Functions for Spatial Thinning of Species Occurrence Records for Use in Ecological Models. 2019.
Available online: https://cran.r-project.org/web/packages/spThin/index.html (accessed on 12 June 2020).
34. Aiello-Lammens, M.E.; Boria, R.A.; Radosavljevic, A.; Vilela, B.; Anderson, R.P. spThin: An R package for
spatial thinning of species occurrence records for use in ecological niche models. Ecography 2015, 38, 541–545.
[CrossRef]
35. Cutler, D.R.; Edwards, T.C.; Beard, K.H.; Cutler, A.; Hess, K.T.; Gibson, J.; Lawler, J.J. Random forests for
classification in ecology. Ecology 2007, 88, 2783–2792. [CrossRef]
36. Eisen, R.J.; Eisen, L.; Girard, Y.A.; Fedorova, N.; Mun, J.; Slikas, B.; Leonhard, S.; Kitron, U.;
Lane, R.S. A spatially-explicit model of acarological risk of exposure to Borrelia burgdorferi-infected Ixodes
pacificus nymphs in northwestern California based on woodland type, temperature, and water vapor.
Ticks Tick-Borne Dis. 2010, 1, 35–43. [CrossRef]
37. Hönig, V.; Švec, P.; Marek, L.; Mrkvička, T.; Dana, Z.; Wittmann, M.; Masař, O.; Szturcová, D.; Růžek, D.;
Pfister, K.; et al. Model of risk of exposure to Lyme borreliosis and tick-borne encephalitis virus-infected
ticks in the border area of the Czech Republic (South Bohemia) and Germany (Lower Bavaria and Upper
Palatinate). Int. J. Environ. Res. Public Health 2019, 16, 1173. [CrossRef]
38. EU. Regulation (EU) 2016/679 of the European Parliament and of the Council of 27 April 2016 on the
protection of natural persons with regard to the processing of personal data and on the free movement of
such data, and repealing Directive 95/46/EC (General Data Protection Regulation). Off. J. 2016, L119, 156.
39. Radda, A. [Populationsstudien an Rötelmäusen (Clethrionomys glareolus Schreber, 1780) durch
Markierungsfang in Niederösterreich], in German. Oecologia 1968, 1, 219–235. [CrossRef]
40. Lovari, S.; Serrao, G.; Mori, E. Woodland features determining home range size of roe deer. Behav. Process.
2017, 140, 115–120. [CrossRef]
41. de Graaf, J.A.; Reimerink, J.H.J.; Voorn, G.P.; bij de Vaate, E.A.; de Vries, A.; Rockx, B.; Schuitemaker, A.;
Hira, V. First human case of tick-borne encephalitis virus infection acquired in the Netherlands, July 2016.
Euro Surveill. 2016, 21, 30318. [CrossRef] [PubMed]
42. Jaenson, T.G.T.; Petersson, E.H.; Jaenson, D.G.E.; Kindberg, J.; Pettersson, J.H.O.; Hjertqvist, M.;
Medlock, J.M.; Bengtsson, H. The importance of wildlife in the ecology and epidemiology of the TBE
virus in Sweden: incidence of human TBE correlates with abundance of deer and hares. Parasit. Vectors 2018,
11, 477. [CrossRef]
43. Erber, W.; Schmitt, H.J. Self-reported tick-borne encephalitis (TBE) vaccination coverage in Europe: Results
from a cross-sectional study. Ticks Tick-Borne Dis. 2018, 9, 768–777. [CrossRef]Microorganisms 2020, 8, 1065 12 of 12
44. Rubel, F.; Walter, M.; Vogelgesang, J.R.; Brugger, K. Tick-borne encephalitis (TBE) cases are not random:
explaining trend, low- and high-frequency oscillations based on the Austrian TBE time series. BMC Infect. Dis.
2020, 20. [CrossRef]
45. Rubel, F.; Brugger, K. Tick-borne encephalitis incidence forecasts for Austria, Germany, and Switzerland.
Ticks Tick Borne Dis. 2020, 11, 101437. [CrossRef]
46. European Centre for Disease Prevention and Control. Epidemiological Situation of Tick-Borne Encephalitis in the
European Union and European Free Trade Association Countries; ECDC: Stockholm, Sweden, 2012. [CrossRef]
47. Boehnke, D.; Brugger, K.; Pfäffle, M.; Sebastian, P.; Norra, S.; Petney, T.N.; Oehme, R.; Littwin, N.; Lebl, K.;
Raith, J.; et al. Estimating Ixodes ricinus densities on the landscape scale. Int. J. Health Geogr. 2015, 14.
[CrossRef]
48. Brugger, K.; Boehnke, D.; Petney, T.N.; Dobler, G.; Pfeffer, M.; Silaghi, C.; Schaub, G.A.; Pinior, B.; Dautel, H.;
Kahl, O.; et al. A density map of the tick-borne encephalitis and Lyme borreliosis vector Ixodes ricinus
(Acari: Ixodidae) for Germany. J. Med. Entomol. 2016, 53, 1292–1302. [CrossRef] [PubMed]
c 2020 by the authors. Licensee MDPI, Basel, Switzerland. This article is an open access
article distributed under the terms and conditions of the Creative Commons Attribution
(CC BY) license (http://creativecommons.org/licenses/by/4.0/).You can also read