ENHANCED MECHANICAL AND WATER ABSORPTION PROPERTIES OF RICE HUSK-DERIVED NANO-SIO2 REINFORCED PHBV COMPOSITES
←
→
Page content transcription
If your browser does not render page correctly, please read the page content below
polymers
Article
Enhanced Mechanical and Water Absorption
Properties of Rice Husk-Derived Nano-SiO2
Reinforced PHBV Composites
Li Wang, Yong Guo *, Yuxia Chen, Tong Chen, Shiliu Zhu, Tingting Zhang and Shengquan Liu *
 College of Forest and Garden, Anhui Agricultural University, Hefei 230036, China; 18356092360@163.com (L.W.);
 sheherose@163.com (Y.C.); 18356092289@163.com (T.C.); zhuslwood@163.com (S.Z.);
 18715068105@163.com (T.Z.)
 * Correspondence: fly828828@163.com (Y.G.); liusq@ahau.edu.cn (S.L.); Tel.: +86-138-5691-8979 (Y.G.)

 Received: 14 August 2018; Accepted: 6 September 2018; Published: 13 September 2018

 Abstract: Poly(3-hydroxybutyrate–co–3-hydroxyvalerate) (PHBV) is a biodegradable polymer and
 has several potential applications. Herein, we have used a rich biomass resource, rice husk, to obtain
 rice husk nano-SiO2 (RHNS) and prepared RHNS/PHBV composites by using hot-press molding.
 The results showed that the amorphous nature of spherical nano-SiO2 particles with an average
 diameter of 40–80 nm was obtained. The tensile strength and flexural strength of the RHNS/PHBV-3
 composite reached up to 23.515 and 75.669 MPa, respectively, corresponding to an increase of 33.65%
 and 15.54% as compared to pure PHBV. The enhanced mechanical properties of the RHNS/PHBV
 composite can be attributed to the uniform dispersion and strong interfacial bonding of RHNS with
 the PHBV matrix. In addition, the water absorption rate of the RHNS/PHBV composite increased
 from 0.26% to 0.35% and the water swelling ratio followed the given order in different directions:
 thickness > width > length. Furthermore, the initial degradation temperature and residual rate of
 combustion at 700 ◦ C of the composites increased with higher content of RHNS, which represents
 the enhanced thermal stability of RHNS/PHBV composites. In summary, RHNS served as an
 excellent reinforcement and RHNS/PHBV composites have shown promising properties for various
 potential applications.

 Keywords: rice-husk; SiO2 ; RHNS; PHBV; mechanical properties; water absorption; thermal stability

1. Introduction
      Annually, more than 600 million tons of rice is produced worldwide, and the weight of rice husk
accounts for 20% of the total weight [1]. Rice husk, as a by-product of rice processing, has a large yield
and is easy to collect. As an agricultural waste, the rice husk is cheap, rich in lignin, cellulose and
silica, and offers advantages of low density and high degradability [2]. Hence, rice husk is considered
for a wide range of applications. At present, the rice husk is being investigated for the preparation of
combustible gases [3], adsorbents [4] and catalysts [5], activated carbon [6], chemical products (i.e.,
xylose [7] and furfural [8]), and various silicon products [9]. Moreover, rice husk has shown potential
in the field of composite reinforcements [10,11]. However, a large amount of rice husk is not properly
utilized and is discarded or burned in open air, which results in a waste of resources and a rise in
environmental concerns.
      Rice husk is a high-ash biomass fuel with an ash mass fraction of 13% to 29%. The wasted
rice husk ash also causes environmental pollution. It has been reported that the main component
of rice husk ash is SiO2 , which is significantly higher than other ashes, reaching up to 97.3% [3].
One should note that rice husk ash can be the cheapest source of nanostructured silica [12]. Unlike

Polymers 2018, 10, 1022; doi:10.3390/polym10091022                            www.mdpi.com/journal/polymers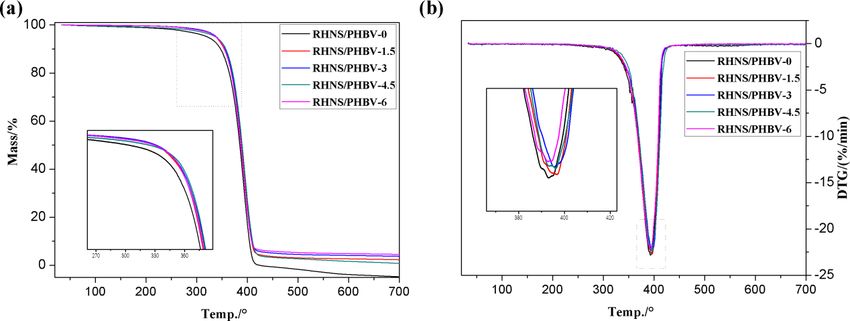
Polymers 2018, 10, 1022                                                                            2 of 13

the naturally existing mineral-type crystalline SiO2 , the rice husk-derived SiO2 exists in amorphous
form. The amorphous SiO2 has shown promise in a wide range of applications, such as electronic,
electrical and high-performance composite materials, due to the high specific surface area, high
surface activity and purity. Rice husk ash also contains a small amount of alkali metal oxides
(5–14%) besides amorphous nano-SiO2 , which can be removed by the appropriate chemical treatment,
and a silica content of >99 wt. % can be achieved [13–15]. Recently, several studies have focused on
rice husk nano-SiO2 (RHNS), such as: geopolymers [16], soluble silicates [17] and amorphous SiO2
nanowires [18].
     Poly (3-hydroxybutyrate–co–3-hydroxyvalerate) (PHBV) is a high concentration of microorganisms
stored in cells under unbalanced particle growth conditions, such as with a lack of trace elements
including nitrogen, phosphorus and magnesium. The molecular polymer can be prepared by biological
fermentation or chemical synthesis from waste vegetables, fruits and plant residues. PHBV offers
complete biodegradability, high biocompatibility, hydrophobicity, piezoelectricity, optical activity and
high crystallinity. In addition, the excellent mechanical properties of PHBV are similar to polypropylene
(PP) and are considered to be an ideal thermoplastic bio-polyester material [19]. However, PHBV
has several disadvantages, such as high cost, brittle nature and easy decomposition, which limit the
potential applications of PHBV [20]. Therefore, the mechanical properties and processability of PHBV
should be enhanced by cost-effective processes to utilize its potential. To date, most of the studies have
been focused on PHBV modification by adding inorganic or organic reinforcement materials, such as
wheat straw fiber [21], carbon nanotubes [22], porous bioactive wollastonite [23] and functionalized
graphene nano sheets (FGS) [24]. One should note that SiO2 is an excellent filler and commonly used in
the fabrication of inorganic composites. Previously, RHNS has been applied to polymer reinforcements,
such as high-density polyethylene (HDPE) [25], polyvinyl chloride (PVC) [26] and epoxy resin [27],
to reduce the friction coefficient and improve wear resistance [28]. However, the modification of PHBV
by RHNS has not been reported yet.
     Herein, we have synthesized RHNS by a dry method and pre-treated with hydrochloric acid (HCl).
Then, the RHNS was directly burned at 550 ◦ C to evaporate and decompose the organic components
of the rice husk and remove moisture, which resulted in nano-SiO2 particles. The proposed method
is simple, controllable and cost-effective. In this study, the composites were fabricated by using the
RHNS and PHBV and the influence of RHNS content on the mechanical properties, water absorption
and thermal properties of composites was systematically investigated.

2. Experimental

2.1. Materials
     PHBV (Hongyuan Plastic, Shenzhen, China), melt index (MI) 40.126 g/min, density 1.25 g/cm3 ,
rice husk powder (Anhui Agricultural Products Direct Store, Hefei, China), homemade, particle size
80 mesh were used as raw materials. The RHNS content of 0, 1.5, 3, 4.5 and 6 wt. % were used to
investigate the influence of RHNS content on composite performance.

2.2. RHNS Synthesis
     To remove dirt and impurities, the rice husk was soaked in tap water for 24 h and repeatedly
washed for three or four cycles. After natural drying, the rice husk was dried at 105 ◦ C by using a blast
drying oven for 24 h.
     The appropriate amount of rice husk powder was placed in 5 wt. % HCl solution and heated in a
water bath at a temperature of 90 ◦ C under continuous stirring. Then, the treated rice husk powder
was filtered with gauze and washed to remove acid with deionized (DI) water. These steps removed
most of the metals, such as calcium, iron, potassium and other impurity ions, from the rice husk
powder, which ensured the high purity of SiO2 . Subsequently, the rice husk was dried at 105 ◦ C for
24 h. The dried rice husk powder was placed in a crucible and heated in a low-temperature electric
Polymers 2018, 10, 1022 3 of 13
resistance
Polymers 2018,furnace
10, x FORtoPEER
be fully burnt in
REVIEW air. Then, the burnt powder was placed in a tube furnace3 of and13
heated at 550 ◦ C for 2 h to obtain an off-white rice RHNS. It has been reported that the optimum
combustion temperature for the rice husk is 550 ◦°C.
temperature for C. One should note that the organic components
cannot be completely removed at low temperature and affect the SiO22 color.
color. Similarly,
Similarly, the product is
sintered at high temperatures, resulting
resulting in
in the
the reduced
reduced specific
specific surface
surface area
areaof
ofSiO
SiO22 [29].
[29].
2.3. Fabrication of RHNS/PHBV Composites
amounts of
The proper amounts of RHNS
RHNSandandPHBV
PHBVwere
wereweighed
weighedand
andmixed
mixedinina ahigh‐speed
high-speedmixermixerfor
for
2
2 minatata aspeed
min speedofof1500
1500r/min.
r/min.The
Themixture
mixturematerial
materialwas
wastaken
takenout
outand
andplaced
placed inin aa flat vulcanizer
(800Y, Boou Hardware Products
Products Co.,
Co., Ltd.,
Ltd.,Zhejiang,
Jinhua, China),
China),where
whereititwas
waspre-heated
pre‐heatedat 150 ◦°C
at150 C for 10
min and hot pressed at a pressure of 6 MPa for 5 min. Subsequently, it was placed in a cold press
under the pressure if 2 MPa at room temperature
temperature for 10 min. Finally, the board was placed in a
min. Finally,
constant temperature and humidity chamber for treatment to obtain obtain the
the RHNS/PHBV composites.
RHNS/PHBV composites.
The schematic illustration of RHNS/PHBV composites synthesis is presented in
RHNS/PHBV composites synthesis is presented in Figure Figure 1.
Figure 1.
Figure 1. Schematic
Schematic illustration
illustration of
of RHNS/PHBV
RHNS/PHBV composites
composites fabrication.
fabrication.
2.4. Material
2.4. Material Characteristics
Characteristics
The surface
The surface morphologies
morphologiesof ofrice
ricehusks,
husks,RHNS
RHNSand andRHNS/PHBV
RHNS/PHBV composites
composites waswas observed
observed by
by field
field emission
emission scanning
scanning electron
electron microscopy
microscopy (FESEM,
(FESEM, Hitachi
Hitachi Co. S‐4800,
Co. Ltd., Ltd., S-4800,
Tokyo,Tokyo,
Japan)Japan)
at an
at an accelerating
accelerating voltage
voltage of 2.0ofkV.
2.0 kV. A layer
A layer of of gold
gold foilfoil wasdeposited
was depositedon onthe
the surface
surface before
before SEM
SEM
observations to
observations to improve
improve thethe electronic
electronic conductivity
conductivity and and obtain
obtain high-quality
high‐quality images.
images.
The crystal
The crystal structure
structure ofof RHNS
RHNS waswas characterized
characterized by by X‐ray
X-ray diffraction
diffraction analysis
analysis (XRD,
(XRD, XRD‐3,
XRD-3,
Beijing Purkinje, Beijing, China), equipped with Cu Kα radiations. The room temperature XRD
Beijing Purkinje, Beijing, China), equipped with Cu Kα radiations. The room temperature XRD
patterns ◦ 60◦ , accelerator
patterns were
were recorded
recorded inin the
the 2θ
2θ range
range of
of 55° to
to 60°, accelerator voltage
voltage waswas 3636 kV
kV and
and the
the tube
tube current
current
was
was 2020 mA.
mA.
The Fourier
The Fourier transform
transform infrared
infrared spectroscopy
spectroscopy (FTIR,
(FTIR, Bruker
Bruker Model
Model Tensor
Tensor II,
II, Bruker,
Bruker, Billerica,
Billerica,
−1 The
MA, USA) was carried out by using using KBr
KBr pellets
pellets in
in the
the range
rangeofof400
400toto4000
4000cmcm−1. The final scan was
obtained by integrating 32 scans, measured at the resolution −1
resolution of of 44 cm
cm−1. .
tensileand
The tensile andflexural
flexuralproperties
propertiesofof RHNS/PHBV
RHNS/PHBV composites
composites werewere measured
measured usingusing
GB/TGB/T
1449‐
1449-2005
2005 and GB/T 1040‐42. The mechanical tests were carried out at room temperature using a
and GB/T 1040-42. The mechanical tests were carried out at room temperature using
mechanical tester (Shimadzu AG-X AG‐X Plus, Shimadzu Corporation, Kyoto, Japan). The reported results
are an average of five independently tested specimens.
specimens.
The GB/T 1462-2005 standard was
GB/T 1462‐2005 standard was used to used to assess the water absorption properties. The samples
for the water absorption test had aa size size of
of 50 mm ×
50 mm × 50 mm × × 33 mm,
mm, andand the
the reported
reported result is an
average of five independently tested specimens. The The following
following equation
equation waswas used
used to measure the
weight gain:
m − m0
W= 1 × 100% (1)
m0
100% (1)
where: W represents the water absorption rate percentage, %; m0 corresponds to the initial weight of
the sample, g; m1 refers to the weight of the wet sample, g.
where: W represents the water absorption rate percentage, %; m0 corresponds to the initial weight of
the sample, g; m1 refers to the weight of the wet sample, g.
A three‐dimensional sample of 20 mm × 20 mm × 3 mm was sectioned for the water swelling
test. The sample was immersed in water for 24 h, and the dimensions were measured with aPolymers 2018, 10, 1022 4 of 13
A three-dimensional sample of 20 mm × 20 mm × 3 mm was sectioned for the water swelling test.
The sample was immersed in water for 24 h, and the dimensions were measured with a micrometer to
the nearest 0.001 mm. The linear expansion ratio in each direction was calculated and the result was
accurate to 0.0001%.
The thermal stability of prepared composites was assessed by a thermogravimetric analyzer (TGA
209F3, Netzsch, Bavaria, Germany). A 5–10 mg sample was placed in a clean Al2 O3 crucible and heated
within a temperature range of 30 to 700 ◦ C at the heating rate of 10 ◦ C/min. The TGA experimental
was carried out under the constant flow of nitrogen.
The differential scanning calorimeter (DSC) was carried out by using Differential Scanning
Calorimeter (DSC 200, Netzsch, Bavaria, Germany) within a temperature range of 20 to 200 ◦ C.
A 5–10 mg sample was used under the constant flow of nitrogen gas. The heating and cooling rates
were 10 ◦ C/min. The crystallinity of the composite is calculated according to the given formula [30]:
∆H f
Xc(%) = × 100% (2)
W ∗ ∆H f (PHBV)
where: Xc refers to the crystallinity, %; ∆Hf represents the melting enthalpy of composite material, J/g;
∆Hf (PHBV) corresponds to the 100% crystalline PHBV melting heat enthalpy, 146 J/g [31]; W denotes
the composite mass fraction of PHBV in the material, %.
3. Results and Discussion
3.1. RHNS Characterization
Figure 2 shows the surface morphology of the rice husk before and after pre-treatment with
5 wt. % HCl and the RHNS prepared by high temperature calcination. Figure 2a,b clearly demonstrates
that water soaking and 5 wt. % HCl pre-treatment resulted in a smooth, bright and clear outer surface
of the rice husk. This implies that impurities had been removed after water immersion and 5 wt. % HCl
pre-treatment [32], which is important for the subsequent firing and attaining of high-purity RHNS.
Polymers 2018, 10, x FOR PEER REVIEW 5 of 13
Figure 2. Surface morphology of rice husk and RHNS: (a) original rice husk; (b) rice husk treated with
5% HCl; (c) aggregated RHNS and
and (d)
(d) dispersed
dispersed RHNS.
RHNS.
To determine the crystal structure of RHNS, XRD analysis was carried out and the results are
shown in Figure 3a. The XRD pattern of RHNS did not show distinct diffraction peaks. Only a broad
dome‐shaped scattering curve appears, which is centered at 2θ = 22°. One should note that the XRD
pattern is consistent with standard amorphous silica [35] and confirmed the amorphous nature of
RHNS particles.
Figure 3b presents the FTIR spectra of RHNS and the major peaks appeared at 3450, 1630, 1098,
800 and 465 cm−1. The broad peak at 3450 cm−1 corresponds to the antisymmetric stretching vibrationsPolymers 2018, 10, 1022 5 of 13
Figure 2c,d presents the surface morphology of aggregated and dispersed RHNS particles.
Figure 2c exhibits the spherical particles of the RHNS with a uniform particle size after
high-temperature calcination. From the SEM images, the particle size of the RHNS can be estimated as
being within the range of 40 to 80 nm, which is consistent with previous reports [33,34]. Moreover,
the nano-SiO2 particles did not exhibit a horn shape and straight edges, which implies that SiO2 exists
in the amorphous state. Hence, the amorphous RHNS can be effectively produced using the currently
adopted experimental procedure. However, the fired RHNS showed a remarkably aggregated structure.
Figure
A large 2. Surface
amount morphology
of nano-SiO of rice husk
2 particles and RHNS: (a)
had aggregated and original
formed ricehuge
husk;spherical
(b) rice husk treated
clusters, with only
while
5% HCl; (c) aggregated RHNS and (d) dispersed RHNS.
a few particles remained dispersed. The aggregation was caused by the high surface energy of the
nano-scale RHNS particles, which makes them highly active, unstable and aggregated.
To determine
To determine the the crystal
crystal structure
structure of of RHNS,
RHNS, XRD XRD analysis
analysis was
was carried
carried out
out and
and the
the results
results are
are
shown in Figure 3a. The XRD pattern of RHNS did not show distinct diffraction
shown in Figure 3a. The XRD pattern of RHNS did not show distinct diffraction peaks. Only a broad peaks. Only a broad
dome‐shaped scattering
dome-shaped scattering curve
curve appears,
appears, which
which isis centered
centered at at 2θ
2θ == 22
22°.
◦ . One
One should
should notenote that
that the
the XRD
XRD
pattern is
pattern is consistent
consistent withwith standard
standard amorphous
amorphous silicasilica [35]
[35] and
and confirmed
confirmed the the amorphous
amorphous nature nature of
of
RHNS particles.
RHNS particles.
Figure 3b
Figure 3b presents
presentsthe theFTIR
FTIRspectra
spectra of of
RHNS
RHNS andand the the
major peaks
major appeared
peaks appearedat 3450, 1630, 1098,
at 3450, 1630,
800 and 465 cm −1. The broad peak at 3450 cm−1 corresponds to the antisymmetric stretching vibrations
− 1 − 1
1098, 800 and 465 cm . The broad peak at 3450 cm corresponds to the antisymmetric stretching
of structural
vibrations of Si–OH
structuralandSi–OH
water–OH [36]. The peak
and water–OH [36]. near 1630 near
The peak represents
cm−1 1630 cm−1 represents
the bending vibrations
the bending
vibrations − 1
of H–O–H of H–O–H
[37]. The peak[37]. near
The peak
1098 cmnear 1098 cm thedenotes
−1 denotes the antisymmetric
antisymmetric stretching of
stretching vibrations vibrations
Si–O–Si
of Si–O–Si [38] and the peaks 800 and 465 cm −1 refer to the symmetric stretching vibrations of the
[38] and the peaks 800 and 465 cm refer to the symmetric stretching vibrations of the Si–O bond
−1
Si–O bond
[37,39]. The[37,39]. The FTIRisspectrum
FTIR spectrum is also with
also consistent consistent with previously
previously published
published studies [40]studies [40] and
and confirmed
confirmed the amorphous
the amorphous structure of RHNS. structure of RHNS.
(a) (b)
Figure 3. XRD
XRDpattern
patternand
andthe
theFTIR
FTIRspectrum ofof
spectrum pyrolysis obtained
pyrolysis RHNS:
obtained (a) (a)
RHNS: XRD pattern
XRD andand
pattern (b)
FTIR spectrum.
(b) FTIR spectrum.
3.2. RHNS/PHBV Composite Characterization
3.2.1. Mechanical Properties
Figure 4 shows the change in mechanical properties of RHNS/PHBV composites with respect to
SiO2 content. Figure 4a demonstrates that the tensile strength and tensile modulus of RHNS/PHBV
composites increased with RHNS content up to a threshold limit, followed by a gradual decrease.
The tensile strength and the tensile modulus of PHBV were 17.595 and 429.611 MPa, respectively.
When RHNS content was 3 wt. %, the tensile strength and tensile modulus of the composites exhibited
the maximum values of 23.515 and 502.394 MPa, respectively, which corresponds to a respective
increase of 33.65% and 16.94% in comparison to pure PHBV. Once RHNS content exceeded theFigure 4 shows the change in mechanical properties of RHNS/PHBV composites with respect to
SiO2 content. Figure 4a demonstrates that the tensile strength and tensile modulus of RHNS/PHBV
composites increased with RHNS content up to a threshold limit, followed by a gradual decrease.
The tensile strength and the tensile modulus of PHBV were 17.595 and 429.611 MPa, respectively.
When
Polymers RHNS
2018, 10, content
1022 was 3 wt. %, the tensile strength and tensile modulus of the composites 6 of 13
exhibited the maximum values of 23.515 and 502.394 MPa, respectively, which corresponds to a
respective increase of 33.65% and 16.94% in comparison to pure PHBV. Once RHNS content exceeded
threshold
the thresholdvalue of 3ofwt.
value %, %,
3 wt. thethe
tensile
tensilestrength
strength and
andtensile
tensilemodulus
modulusofofRHNS/PHBV composites
RHNS/PHBV composites
gradually decreased and exhibited the values of 19.062 and 487.633
gradually decreased and exhibited the values of 19.062 and 487.633 MPa, respectively, at MPa, respectively, at aa SiO
SiO22
content of 6 wt. %. However, these values were still 8.34% and 13.51% higher
content of 6 wt. %. However, these values were still 8.34% and 13.51% higher than those for pure than those for pure
PHBV. The
PHBV. The results
results demonstrate
demonstrate thatthat the
the addition
addition ofof RHNS
RHNSenhanced
enhancedthe thetensile
tensileproperties
propertiesofofPHBV.
PHBV.
One should also note that the lower content of RHNS showed a prominent effect
One should also note that the lower content of RHNS showed a prominent effect due to the excellent due to the excellent
dispersion of
dispersion ofRHNS
RHNSnanoparticles
nanoparticles in in PHBV
PHBV matrix.
matrix. The nano-scale
The nano‐scale SiO2 ,itswith
SiO2, with highits high specific
specific surface
surface area, enhanced the polymer crystallization [41,42] and resulted in strong
area, enhanced the polymer crystallization [41,42] and resulted in strong interaction forces between interaction forces
between molecular
molecular chains. However,
chains. However, when the when the content
content of RHNSof RHNSwaswas above
above a thresholdlimit,
a threshold limit, particle
particle
aggregation occurred, resulting in poor dispersibility, which caused the increased
aggregation occurred, resulting in poor dispersibility, which caused the increased surface surface irregularities
and void ratios.
irregularities andMoreover, theMoreover,
void ratios. aggregation thereduced the original
aggregation reducedsurface effectsurface
the original of RHNS andofresulted
effect RHNS
and resulted in a weak bonding force between nano‐SiO2 and the matrix. In addition, the forces
in a weak bonding force between nano-SiO 2 and the matrix. In addition, the weak interfacial weak
increased the
interfacial interface
forces defects
increased the and led todefects
interface an inferior interfacial
and led strength.
to an inferior interfacial strength.
Figure 4. The
Figure 4. The mechanical
mechanical properties of RHNS/PHBV
properties of RHNS/PHBV composites:
composites: (a)
(a) tensile
tensile strength
strength and
and tensile
tensile
modulus and (b) bending strength and flexural modulus.
modulus and (b) bending strength and flexural modulus.
Figure 4b
Figure 4b presents
presents the
the influence
influence of RHNS content
of RHNS content on
on the
the flexural
flexural properties
properties of of the
the RHNS/PHBV
RHNS/PHBV
composites. Figure 4b shows that the flexural strength and flexural modulus of the RHNS/PHBV
composites. Figure 4b shows that the flexural strength and flexural modulus of the RHNS/PHBV
composites increased
composites increasedup uptotoaathreshold
thresholdlimit,
limit,followed
followedbyby a decrease
a decrease when
when increasing
increasing of of amount
amount of
of RHNS. The flexural strength and flexural modulus of pure PHBV
RHNS. The flexural strength and flexural modulus of pure PHBV are 65.49 and 619.676 MPa, are 65.49 and 619.676 MPa,
respectively. The
respectively. The maximum
maximum flexural
flexural strength
strength of of RHNS/PHBV composites was
RHNS/PHBV composites was 75.669
75.669 MPa
MPa at at 33 wt.
wt. %
%
which was
RHNS, which was 15.54%
15.54% higher
higher than
than pure
pure PHBV.
PHBV. When the content of RHNS was 1.5%, the the flexural
flexural
modulus attained
modulus attained thethe highest
highest value
value of of 670.523
670.523 MPa,
MPa, which
which was
was 8.21%
8.21% higher
higher than
than pure
pure PHBV.
PHBV. It has
been found
foundthatthatthe
theaddition
additionof an
of appropriate
an appropriate amount of RHNS
amount is required
of RHNS to attaintodesirable
is required bending
attain desirable
bending properties and enhance the rigidity of the composite materials. This may be related torigid
properties and enhance the rigidity of the composite materials. This may be related to the the
nature
rigid of inorganic
nature RHNSRHNS
of inorganic particles. WhenWhen
particles. an appropriate amount
an appropriate of RHNS
amount is added
of RHNS to the PHBV
is added to the
matrix,matrix,
PHBV it entangles with the
it entangles withPHBV matrix
the PHBV and interacts
matrix withwith
and interacts eacheach
other, thereby
other, improving
thereby improvingthe
rigidity and bending properties of composites [43]. However, an excessive
the rigidity and bending properties of composites [43]. However, an excessive amount of RHNS amount of RHNS reduces
the cross-linkage
reduces density and
the cross‐linkage toughness
density of the composite,
and toughness which negatively
of the composite, influences
which negatively the bending
influences the
strength strength
bending and flexuralandmodulus.
flexural modulus.
Furthermore, the deformation resistance of the composite materials is improved due to the
excellent reinforcement effect of RHNS particles [37]. One should note that the destruction of
composites requires higher energy, which corresponds to the enhanced comprehensive mechanical
properties. However, once the content of RHNS exceeds a threshold value, the agglomeration and
poor dispersion of nano-SiO2 particles in the matrix results in reduced mechanical performance.
3.2.2. Water Absorption Performance
Table 1 shows the water uptake of RHNS/PHBV composites after 24 h of water immersion
treatment. The water absorption of the composites has shown a relatively direct relationship withPolymers 2018, 10, 1022 7 of 13
RHNS content, and a maximum value of 0.35% was attained for the composite with 6 wt. % RHNS
(RHNS/PHBV-6). One should note that the water absorption capacity of pure PHBV was only 0.26%.
Also, with the addition of RHNS, the water absorption of the composites slightly increased, whereas
the water resistance decreased. However, the water absorption rate of the RHNS/PHBV composites
was not too high, and met the general requirements of potential applications.
Table 1. Water absorption properties of RHNS/PHBV composites with different content of RHNS.
Sample m0 /g m1 /g W/%
RHNS/PHBV-0 7.99 8.011 0.26 ± 0.02
RHNS/PHBV-1.5 7.783 7.805 0.28 ± 0.01
RHNS/PHBV-3 7.659 7.681 0.28 ± 0.01
RHNS/PHBV-4.5 8.052 8.075 0.29 ± 0.01
RHNS/PHBV-6 8.255 8.284 0.35 ± 0.04
Figure 5 shows the water swelling ratio of the RHNS/PHBV composites in the length, width
and thickness directions. It can be seen from the figure that the water swelling ratio of thecomposites
in three directions increased with the increasing RHNS content after water soaking for 48 h at room
temperature. The length and width of the specimen increased slowly, whereas the thickness has
a significant increase with respect to RHNS content. When the RHNS content increased from 0 to
6 wt. %, the water swelling ratio of length and width increased from 0.148% and 0.184% to 0.485% and
0.511%, respectively. The water swelling ratio of pure PHBV was 0.6605% in the thickness direction.
When the amount of RHNS was 1.5 wt. %, the water swelling ratio in the thickness direction became
1.3819%, which is twice as high as pure PHBV. When the RHNS content continued to go up to 6 wt. %,
the expansion ratio became 1.574%, which shows that water uptake had slowed down with increased
RHNS content. In summary, the water swelling rate followed the given order in three directions:
thickness
Polymers > 10,
2018, width > PEER
x FOR length.
REVIEW 8 of 13
Figure 5.5.Water
Waterswelling
swelling ratio
ratio ofRHNS/PHBV
of the the RHNS/PHBV composites
composites in width
in length, length, width
and and directions.
thickness thickness
directions.
The reduced water absorption performance of the composites can be ascribed to the addition of
RHNS, which broke
3.2.3. Thermal the continuity of the PHBV matrix, and increased the internal void ratio. Moreover,
Stability
invisible cracks and holes appeared due to non-uniform mixing during hot pressing. One should note
Figure 6 shows the temperature dependent weight loss of RHNS/PHBV composites. Table 2
summarizes the TGA data of the RHNS/PHBV composites during thermal degradation, including
the initial degradation temperature (Tinitial) of the composite material, the temperature corresponding
to the maximum degradation rate (Tmax), and the residual mass of the composites at 700 °C (RM at
700 °C).Polymers 2018, 10, 1022 8 of 13
that the presence of holes can increase water absorption rate. In addition, the lower water absorption
rate of the composites corresponds to the uniform dispersion and strong interfacial bonding of RHNS
with PHBV matrix (Figure 8b–d).
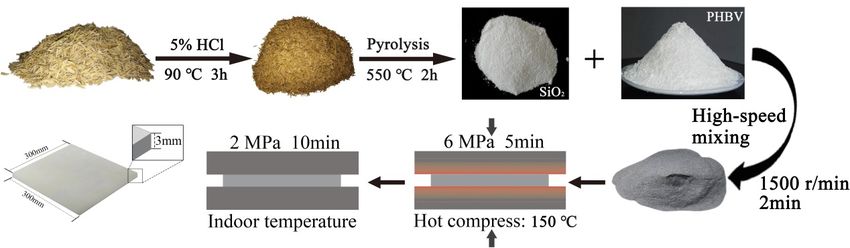
3.2.3. Thermal Stability
Figure 6 shows the temperature dependent weight loss of RHNS/PHBV composites. Table 2
summarizes the TGA data of the RHNS/PHBV composites during thermal degradation, including
the initial degradation temperature (Tinitial ) of the composite material, the temperature corresponding
to the maximum degradation rate (Tmax ), and the residual mass of the composites at 700 ◦ C (RM at
700 ◦ C).
The comprehensive analysis of the TGA curves revealed that the composites showed a major
degradation peak, which indicates the excellent interfacial compatibility of the composites. The main
degradation temperature of the composites ranged from 363 to 418 ◦ C and the degradation rate change
was in the range of 21.53% to 22.83%/min. The initial degradation temperature of pure PHBV was
363.0 ◦ C, whereas the initial degradation temperature increased to 367.8 ◦ C after the addition of
4.5 wt. % RHNS. Tmax and RM at 700 ◦ C also increased with increasing RHNS content, which indicates
that the addition of RHNS enhanced the thermal stability of PHBV.
The improved thermal stability of the composites can be attributed to the strong interfacial
bonding between the RHNS and PHBV, resulting in an increase in the energy required for
degradation [44,45]. The RHNS has shown strong heat resistance and no significant degradation
at 700 ◦ C was observed. The insulating effect of RHNS helped to prevent heat transfer and delay the
degradation of PHBV [46].
Table 2. Thermal analysis data of RHNS/PHBV composites derived from TGA curves.
Sample T initial /◦ C T max /◦ C RM at 700 ◦ C/%
RHNS/PHBV-0 363 393.1 0
RHNS/PHBV-1.5 365.3 396.7 2.07
RHNS/PHBV-3 366.8 395.4 3.48
RHNS/PHBV-4.5 367.8 396.2 3.79
RHNS/PHBV-6 363.8 393 4.44
Polymers 2018, 10, x FOR PEER REVIEW 9 of 13
Figure 6.
Figure 6. The
The TGA
TGA and
and DTG
DTG curves
curves of
of RHNS
RHNS /PHBV
/PHBV composites:
composites: (a)
(a) TGA
TGA and
and (b)
(b) DTG.
DTG.
3.2.4. Differential Scanning
3.2.4. Differential Scanning Calorimetry
Calorimetry
To
To eliminate
eliminate the
the influence
influence of
of the
the thermal
thermal history
history ofof the
the sample
sample on
on the crystal structure,
the crystal structure, two
two DSC
DSC
lifts
lifts and
and temperature
temperature tests
tests were
were performed
performed on on the
the blend
blend samples. Figure 77 shows
samples. Figure shows the
the heating
heating and
and
cooling DSC curves of RHNS/PHBV composites with different RHNS content.
cooling DSC curves of RHNS/PHBV composites with different RHNS content. The corresponding The corresponding
thermal
thermal analysis
analysisdata
dataare
areshown
shownininTable
Table3. 3.
Figure 7a7a
Figure clearly demonstrates
clearly thatthat
demonstrates the the
exothermic peakpeak
exothermic (Tc )
and
(Tc) the
andcrystallization onset temperature
the crystallization (Tc,onset ) constantly
onset temperature moved towards
(Tc,onset) constantly movedthetowards
high temperature,
the high
temperature, and the highest temperature was observed at the RHNS content of 6 wt. %. The Tc and
Tc,onset of pure PHBV were 70.0 and 64.6 °C, respectively. When the content of RHNS reached 6 wt. %,
Tc (74.9 °C) and Tc,onset (70.0 °C) showed an increase of 4.9 and 5.4 °C, respectively. This indicates that
the addition of RHNS resulted in anisotropic nucleation in the composite.
It can be seen from Figure 7b that during the heating process, the melting curves of pure PHBV3.2.4. Differential Scanning Calorimetry
To eliminate the influence of the thermal history of the sample on the crystal structure, two DSC
lifts and temperature tests were performed on the blend samples. Figure 7 shows the heating and
cooling2018,
Polymers DSC10,curves
1022 of RHNS/PHBV composites with different RHNS content. The corresponding 9 of 13
thermal analysis data are shown in Table 3. Figure 7a clearly demonstrates that the exothermic peak
(Tc) and the crystallization onset temperature (Tc,onset) constantly moved towards the high
and the highest
temperature, andtemperature
the highestwas observed at
temperature was theobserved
RHNS content of 6 wt.content
at the RHNS %. The ofTc 6and
wt.T%. Theof
c,onset Tcpure
and
PHBV were 70.0 and 64.6 ◦ C, respectively. When the content of RHNS reached 6 wt. %, T (74.9 ◦ C)
Tc,onset of pure PHBV were 70.0 and 64.6 °C, respectively. When the content of RHNS reached c 6 wt. %,
and Tc,onset ◦ C) showed an increase of 4.9 and 5.4 ◦ C, respectively. This indicates that the addition
Tc (74.9 °C) (70.0
and Tc,onset (70.0 °C) showed an increase of 4.9 and 5.4 °C, respectively. This indicates that
of
theRHNS
addition resulted
of RHNS in anisotropic
resulted innucleation
anisotropic innucleation
the composite.
in the composite.
It
It can be seen from Figure 7b that during the the
can be seen from Figure 7b that during heating
heating process,
process, the melting
the melting curvescurves
of pureofPHBV
pure
PHBV and RHNS/PHBV
and RHNS/PHBV composites composites
showed doubleshowed double
melting melting
peaks, peaks,
and the and the high-temperature
high‐temperature melting peak
melting peak represented the main region. PHBV is a semi-crystalline
represented the main region. PHBV is a semi‐crystalline polymer, and the melting‐recrystallization‐ polymer, and the
melting-recrystallization-remelting
remelting process led to the formation process led to melting
of a double the formation of The
peak [47]. a double melting peak
low‐temperature [47].
melting
The low-temperature melting peak (T ) and the high-temperature melting
peak (Tm1) and the high‐temperature melting peak (Tm2) of PHBV were observed at 104.3 and 110.6
m1 peak (T m2 ) of PHBV were
observed at 104.3The
°C, respectively. 110.6 ◦ C,
andmelting respectively.
point of PHBV/RHNS The melting point of
composites PHBV/RHNS
ranged from 104 tocomposites
111 °C, and ranged
both
from 104 to 111 ◦ C, and both melting peaks of the composite blend moved slightly towards the higher
melting peaks of the composite blend moved slightly towards the higher temperature. Table 3 shows
temperature. Table 3 of
that the crystallinity shows that the crystallinity
the composite was higherofthan the pure
composite
PHBVwas higher
when than3 pure
1.5 and wt. %PHBV
RHNSwhen was
1.5 and 3 wt. % RHNS was added. However, when RHNS content exceeds
added. However, when RHNS content exceeds 3 wt. %, the crystallinity of the composite becomes 3 wt. %, the crystallinity of
the composite
inferior to thebecomes
pure PHBV. inferior to the
This can pure PHBV. This
be explained bycan
thebeanisotropic
explained by the anisotropic
nucleation of RHNS, nucleation
which
of RHNS, which enhanced the crystallization of PHBV. Furthermore,
enhanced the crystallization of PHBV. Furthermore, higher content of RHNS led to the severe higher content of RHNS led to
the severe agglomeration
agglomeration and non-uniform
and non‐uniform dispersion,
dispersion, whichwhich significantly
significantly influencedthe
influenced the anisotropic
anisotropic
nucleation of RHNS and hindered the crystallization of PHBV. Hence, an overall
nucleation of RHNS and hindered the crystallization of PHBV. Hence, an overall reduced crystallinity reduced crystallinity
of
of the
the composite
composite was was observed,
observed, resulting
resulting in in aa decrease
decrease in
in the
the mechanical
mechanical properties.
properties.
Figure 7. DSC
Figure 7. DSC curve
curve of
of RHNS/PHBV composites: (a)
RHNS/PHBV composites: (a) cooling
cooling crystallization
crystallization curve
curve and
and (b)
(b) heating
heating
melting curve.
melting curve.
Table 3. The DSC derived data of the RHNS/PHBV composites.
Sample T c /◦ C T m1 /◦ C T m2 /◦ C ∆H f (J/g) Xc/%
RHNS/PHBV-0 70 104.3 110.6 65.45 44.83
RHNS/PHBV-1.5 72.6 104.4 110.6 79.42 55.23
RHNS/PHBV-3 73.9 104.5 110.7 65.98 46.59
RHNS/PHBV-4.5 73.8 104.5 110.3 60.47 43.37
RHNS/PHBV-6 74.9 105 110.8 61.28 44.65
3.2.5. Ex-Situ Morphological Analysis
Figure 8 presents the ex-situ SEM images of tensile cross-sections of RHNS/PHBV composites.
It can be seen that the pure PHBV (Figure 8a) has a smooth and dense cross-section, which typically
depicts a brittle fracture. When the RHNS content reached 3 wt. % (Figure 8b), the uniformly
dispersed RHNS aggregates have been observed in the composite material. Also, the cross-section
of RHNS/PHBV-3 exhibited rough and contained filamentous polymers, which results in stress
dispersion. One should note that under the action of external force, the composite mainly dissipates
the external force by the deformation of internal polymeric chains. When the RHNS content increasedFigure 8 presents the ex‐situ SEM images of tensile cross‐sections of RHNS/PHBV composites.
It can be seen that the pure PHBV (Figure 8a) has a smooth and dense cross‐section, which typically
depicts a brittle fracture. When the RHNS content reached 3 wt. % (Figure 8b), the uniformly
dispersed RHNS aggregates have been observed in the composite material. Also, the cross‐section of
RHNS/PHBV‐3 exhibited rough and contained filamentous polymers, which results in stress
Polymers 2018, 10, 1022 10 of 13
dispersion. One should note that under the action of external force, the composite mainly dissipates
the external force by the deformation of internal polymeric chains. When the RHNS content increased
to 6 wt. % (Figure 8c), 8c), aa higher
higher concentration
concentration of of large
large aggregates
aggregates andand pores
pores waswas observed.
observed. Moreover,
Moreover,
the non‐uniform
non-uniformsize sizedistribution
distributionofofRHNS/PHBV‐6
RHNS/PHBV-6 composite,
composite, resulted
resultedin stress concentration
in stress concentration of the
of
matrix and and
the matrix reduced mechanical
reduced properties.
mechanical The high
properties. Themagnification
high magnificationSEM images revealed
SEM images that RHNS
revealed that
is prone
RHNS to agglomeration
is prone to agglomerationdue to duethe
to small particle
the small sizesize
particle andand
high
highsurface
surfaceenergy.
energy.Hence,
Hence,aa small
amount of ofRHNS
RHNScan can
be be uniformly
uniformly dispersed
dispersed in theinmatrix
the matrix andamounts
and larger larger amounts tend
tend to form to form
aggregates
(Figure 8b–f).
aggregates A comprehensive
(Figure comparisoncomparison
8b–f). A comprehensive of SEM revealsof SEMthatreveals
the addition
that theofaddition
RHNS significant
of RHNS
increases the porosity and confusion degree of the composite, which facilitates the
significant increases the porosity and confusion degree of the composite, which facilitates the stress stress dispersion and
water absorption.
dispersion and waterTherefore, the SEM
absorption. analysisthe
Therefore, complemented
SEM analysisthe above-mentioned
complemented results, where the
the above‐mentioned
RHNS/PHBV-3 composite showed optimal mechanical and water
results, where the RHNS/PHBV‐3 composite showed optimal mechanical and water absorption absorption properties. It is worth
properties. It is worth mentioning here that a threshold level of RHNS is required to attain the without
mentioning here that a threshold level of RHNS is required to attain the desired performance, desired
compromising the mechanical properties due to nanoparticle aggregation
performance, without compromising the mechanical properties due to nanoparticle aggregation andand non-uniform dispersion.
In summary, RHNS/PHBV
non‐uniform dispersion. Incomposites
summary, showed
RHNS/PHBV promising mechanical
composites and water
showed absorption
promising properties,
mechanical and
making them desirable candidates for a wide range of applications.
water absorption properties, making them desirable candidates for a wide range of applications.
Figure 8. Cross-sectional
Figure 8. Cross‐sectionalSEM
SEM images
images of PHBV
of PHBV and and RHNS/PHBV
RHNS/PHBV composites:
composites: (a)PHBV;
(a) pure pure PHBV; (b)
(b) RHNS/
RHNS/PHBV‐3; (c) RHNS/PHBV‐6 and (d–f) RHNS morphology of composite at different
PHBV-3; (c) RHNS/PHBV-6 and (d–f) RHNS morphology of composite at different magnifications.
magnifications.
4. Conclusions
4. Conclusions
In summary, RHNS/PHBV composites were prepared by using rice husk-derived SiO2
nanoparticles and PHBV
In summary, matrix. The
RHNS/PHBV SEM, XRDwere
composites and FTIR analysis
prepared byconfirmed thehusk‐derived
using rice amorphous nature
SiO2
of spherical nano-SiO
nanoparticles 2 particles,
and PHBV matrix.where the average
The SEM, XRD anddiameter ranged confirmed
FTIR analysis from 40 to 80
thenm. The mechanical
amorphous nature
properties, thermal stability and water absorption properties of pure PHBV and RHNS/PHBV
composites have been explored and the influence of RHNS has been systematically investigated.
It was found that the addition of RHNS enhanced the thermal stability of the composite and slightly
increased the water absorption. The tensile strength and flexural strength of the composites initially
increased up to a threshold value of RHNS content (3 wt. %), followed by a gradual decrease. SEM
and FTIR were carried out to explain the enhanced mechanical properties and water absorption
performance of RHNS/PHBV composites. The uniform dispersion and strong interfacial bonding of
RHNS with PHBV matrix resulted in higher mechanical performance and water absorption.
Recently, the scarce nature of resources and environmental concerns require the development of
novel composites, such as RHNS/PHBV, for a wide range of applications due to the biodegradable
nature of PHBV and cost-effectiveness and abundance of RHNS. Hence, the present study opens up
avenues for further research in various fields.
Author Contributions: Y.G. and L.W. conceived and designed the experiments; L.W., T.C. and S.Z. performed
the experiments; Y.G. and L.W. analyzed the data; T.Z. drew the images. S.L., Y.G. and Y.C. contributed
reagents/materials/analysis tools; L.W. wrote the paper.Polymers 2018, 10, 1022 11 of 13
Funding: This work was supported by the Provincial Natural Science Foundation of Anhui (1708085MC56),
Postdoctoral Science Foundation of China (2014M560503), and Key Projects of Provincial Natural Science
Foundation of Universities in Anhui (KJ2016A220).
Conflicts of Interest: The authors declare no conflict of interest.
References
1. Olaitan, A.J. Comparative Assessment of Mechanical Properties of Groundnut Shell and Rice Husk
Reinforced Epoxy Composites. Am. J. Mech. Eng. 2017, 5, 76–86. [CrossRef]
2. Al-Oqla, F.M.; Zainudin, E.S.; Sapuan, S.M.; Aridi, N.A.M. A Review of Rice Husk Bio-Based Composites.
Curr. Org. Synth. 2017, 14, 263–271.
3. Shen, Y.; Zhao, P.; Shao, Q.; Takahashi, F.; Yoshikawa, K. In situ catalytic conversion of tar using rice
husk char/ash supported nickel–iron catalysts for biomass pyrolytic gasification combined with the
mixing-simulation in fluidized-bed gasifier. Appl. Energy 2015, 160, 808–819. [CrossRef]
4. Xu, M.; Yin, P.; Liu, X.; Tang, Q.; Qu, R.; Xu, Q. Utilization of rice husks modified by organomultiphosphonic
acids as low-cost biosorbents for enhanced adsorption of heavy metal ions. Bioresour. Technol. 2013, 149,
420–424. [CrossRef] [PubMed]
5. John, K.L.; Mohan, K.; Sekaran, G. Integrated biological and catalytic oxidation of organics/inorganics
in tannery wastewater by rice husk based mesoporous activated carbon—-Bacillus sp. Carbon 2004, 42,
2399–2407. [CrossRef]
6. Kalderis, D.; Bethanis, S.; Paraskeva, P.; Diamadopoulos, E. Production of activated carbon from bagasse and
rice husk by a single-stage chemical activation method at low retention times. Bioresour. Technol. 2008, 99,
6809–6816. [CrossRef] [PubMed]
7. Dutta, N.; Mukhopadhyay, A.; Dasgupta, A.K.; Chakrabarti, K. Improved production of reducing sugars from
rice husk and rice straw using bacterial cellulase and xylanase activated with hydroxyapatite nanoparticles.
Bioresour. Technol. 2014, 153, 269–277. [CrossRef] [PubMed]
8. Chareonlimkun, A.; Champreda, V.; Shotipruk, A.; Laosiripojana, N. Catalytic conversion of sugarcane
bagasse, rice husk and corncob in the presence of TiO2 , ZrO2 and mixed-oxide TiO2 -ZrO2 under hot
compressed water (HCW) condition. Bioresour. Technol. 2010, 101, 4179–4186. [CrossRef] [PubMed]
9. Savita, R.; Kamath, A.P. Silica Gel from Rice Hull Ash: Preparation and Characterization. Cereal Chem. 1998,
75, 484–487.
10. Oksman, K.; Skrifvars, M.; Selin, J.F. Natural fibres as reinforcement in polylactic acid (PLA) composites.
Compos. Sci. Technol. 2003, 63, 1317–1324. [CrossRef]
11. Dimzoski, B.; Gordana, B.-G.; Gentile, G.; Avella, M.; Errico, M.E.; Srebrenkoska, V. Preparation and
characterization of poly(lactic acid)/rice hulls based biodegradable composite. J. Polym. Eng. 2008, 28,
369–383.
12. Della, V.P.; Kühn, I.; Hotza, D. Rice husk ash as an alternate source for active silica production. Mater. Lett.
2002, 57, 818–821. [CrossRef]
13. CHAKRAVERTY, A.; Mishra, P.; Banerjee, H.D. Investigation of combustion of raw and acid-leached rice
husk for production of pure amorphous white silica. J. Mater. Sci. 1988, 23, 21–24. [CrossRef]
14. Lee, J.H.; Kwon, J.H.; Lee, J.-W.; Lee, H.-S.; Chang, J.H.; Sang, B.-I. Preparation of high purity silica originated
from rice husks by chemically removing metallic impurities. J. Ind. Eng. Chem. 2017, 50, 79–85. [CrossRef]
15. Muniandy, L.; Adam, F.; Mohamed, A.R.; Ng, E.-P. The synthesis and characterization of high purity mixed
microporous/mesoporous activated carbon from rice husk using chemical activation with NaOH and KOH.
Microporous Mesoporous Mater. 2014, 197, 316–323. [CrossRef]
16. Mejía, J.M.; Gutiérrez, R.M.; Montes, C. Rice husk ash and spent diatomaceous earth as a source of silica to
fabricate a geopolymeric binary binder. J. Clean. Prod. 2016, 118, 133–139. [CrossRef]
17. Samuel Owoeye, S. Effects of Extraction Temperature and Time on the Physical Properties of Soluble Sodium
Silicate from Rice Husk Ash. Sci. J. Chem. 2017, 5, 8–11. [CrossRef]
18. Bathla, A.; Narula, C.; Chauhan, R.P. Hydrothermal synthesis and characterization of silica nanowires using
rice husk ash: an agricultural waste. J. Mater. Sci. Mater. Electron. 2018, 29, 6225–6231. [CrossRef]Polymers 2018, 10, 1022 12 of 13
19. Klaassien, J.G.; Annechien, H.; Martin, H.A.; Wim, K.; Anton, J.M.; Anton, S.U. Upgrading of organic waste:
production of the copolymer poly-3-hydroxybutyrate-co-valerate by Ralstonia eutrophus with organic waste
as sole carbon source. J. Clean. Prod. 1999, 413–419.
20. Wu, L.; Wang, L.; Weng, Y. Research Progress on Blending Modification of PHBV. Plast. Sci. Technol. 2012, 40,
96–102.
21. Avella, M.; Rota, G.L.; Martuscelli, E.; Raimo, M. Poly(3-hydroxybutyrate-co-3-hydroxyvalerate) and wheat
straw fibre composites: thermal, mechanical properties and biodegradation behaviour. J. Mater. Sci. 2000, 35,
825–836.
22. Lai, M.; Li, J.; Yang, J.; Liu, J.; Tong, X.; Cheng, H. The morphology and thermal properties of multi-walled
carbon nanotube and poly(hydroxybutyrate-co-hydroxyvalerate) composite. Polym. Int. 2004, 53, 1479–1484.
[CrossRef]
23. Li, H.; Chang, J. Fabrication and characterization of bioactive wollastonite/PHBV composite scaffolds.
Biomaterials 2004, 25, 5473–5480. [CrossRef] [PubMed]
24. Ambrosio-Martín, J.; Gorrasi, G.; Lopez-Rubio, A.; Fabra, M.J.; Mas, L.C.; López-Manchado, M.A.;
Lagaron, J.M. On the use of ball milling to develop PHBV-graphene nanocomposites (I)-Morphology,
thermal properties, and thermal stability. J. Appl. Polym. Sci. 2015, 132, 1097–4628. [CrossRef]
25. Sheykh, M.J.; Tarmian, A.; Doosthoseini, K.; abdulkhani, A. Wear resistance and friction coefficient of
nano-SiO2 and ash-filled HDPE/lignocellulosic fiber composites. Polym. Bull. 2017, 74, 4537–4547. [CrossRef]
26. Fenglin, Y.; Vladimir, H. Improvement of PVC wearability by addition of additives. Powder Technol. 1999,
103, 182–188.
27. Ahmed, A.; Moosa, B.F.S. Synthesis and Characterization of Nanosilica from Rice Husk with Applications to
Polymer Composites. Am. J. Mater. Sci. 2017, 7, 223–231. [CrossRef]
28. Salari, A.; Tabarsa, T.; Khazaeian, A.; Saraeian, A. Improving some of applied properties of oriented
strand board (OSB) made from underutilized low quality paulownia (Paulownia fortunie) wood employing
nano-SiO2 . Ind. Crops Prod. 2013, 42, 1–9. [CrossRef]
29. Guo, S.; Feng, B.; Zhang, J.; Liu, P.; Chen, Y.; Wei, S. Preparation and Modification of Nano-silica from Rice
Husk as Biomass Silicon Source. Guangdong Chem. Ind. 2017, 44, 9–10.
30. Antoniadis, G.; Paraskevopoulos, K.M.; Bikiaris, D.; Chrissafis, K. Non-isothermal crystallization kinetic of
poly(ethylene terephthalate)/fumed silica (PET/SiO2 ) prepared by in situ polymerization. Thermochim. Acta
2010, 510, 103–112. [CrossRef]
31. BARHAM, P.J.; Keller, A.; Otun, E.L.; Holmes, P.L. Crystallization and morphology of a bacterial
thermoplastic: poly-3-hyd roxybutyrate. J. Mater. Sci. 1984, 19, 2781–2794. [CrossRef]
32. Sankar, S.; Sharma, S.K.; Kaur, N.; Lee, B.; Kim, D.Y.; Lee, S.; Jung, H. Biogenerated silica nanoparticles
synthesized from sticky, red, and brown rice husk ashes by a chemical method. Ceram. Int. 2016, 42,
4875–4885. [CrossRef]
33. Wang, W.; Martin, J.C.; Fan, X.; Han, A.; Luo, Z.; Sun, L. Silica nanoparticles and frameworks from rice husk
biomass. ACS Appl. Mater. Interfaces 2012, 4, 977–981. [CrossRef] [PubMed]
34. Gu, S.; Zhou, J.; Luo, Z.; Wang, Q.; Ni, M. A detailed study of the effects of pyrolysis temperature and
feedstock particle size on the preparation of nanosilica from rice husk. Ind. Crops Prod. 2013, 50, 540–549.
[CrossRef]
35. Hu, S.; Hsieh, Y.-L. Preparation of Activated Carbon and Silica Particles from Rice Straw. ACS Sustain.
Chem. Eng. 2014, 2, 726–734. [CrossRef]
36. Torki, A.M.; Stojanović, D.B.; Živković, I.D.; Marinković, A.; Škapin, S.D.; Uskoković, P.S.; Aleksić, R.R.
The viscoelastic properties of modified thermoplastic impregnated multiaxial aramid fabrics. Polym. Compos.
2012, 33, 158–168. [CrossRef]
37. Midhun, D.C.; Begum, P.M.S.; Joseph, R.; Joseph, D.; Kumar, P.; Ayswarya, E.P. Characterization and
appilcation of rice husk nanosilica in natural rubber. Int. J. Sci. Environ. Technol. 2013, 2, 5.
38. Müller, C.M.; Molinelli, A.; Karlowatz, M.; Aleksandrov, A.; Orlando, T.; Mizaikoff, B. Infrared Attenuated
Total Reflection Spectroscopy of Quartz and Silica Micro- and Nanoparticulate Films. J. Phys. Chem. C 2011,
116, 37–43. [CrossRef]
39. Bakar, R.A.; Yahya, R.; Gan, S.N. Production of High Purity Amorphous Silica from Rice Husk. Procedia Chem.
2016, 19, 189–195. [CrossRef]Polymers 2018, 10, 1022 13 of 13
40. Chen, H.; Sun, Z.; Shao, T. Investigation on FT-IR Spectroscopy for Eight Different Sources of SiO2 . Bull. Chin.
Ceram. Soc. 2011, 30, 934–937.
41. Nagendra, B.; Mohan, K.; Gowd, E.B. Polypropylene/Layered Double Hydroxide (LDH) Nanocomposites:
Influence of LDH Particle Size on the Crystallization Behavior of Polypropylene. ACS Appl. Mater. Interfaces
2015, 7, 12399–12410. [CrossRef] [PubMed]
42. Lu, T.; Jiang, M.; Xu, X.; Zhang, S.; Hui, D.; Gou, J.; Zhou, Z. The effects on mechanical properties and
crystallization of poly (l-lactic acid) reinforced by cellulosic fibers with different scales. J. Appl. Polym. Sci.
2014, 131, 1097–4628. [CrossRef]
43. Pan, M.; Mei, C. Effects of nano SiO2 -ammonium polyphosphate on the interfacial and mechanical properties
of wood fiber-polyethylene composites. J. Beijing For. Univ. 2013, 35, 117–122. [CrossRef]
44. Liu, M.; Guo, B.; Du, M.; Jia, D. Drying induced aggregation of halloysite nanotubes in polyvinyl
alcohol/halloysite nanotubes solution and its effect on properties of composite film. Appl. Phys. A 2007, 88,
391–395. [CrossRef]
45. Khosravi, A.; Sadeghi, M.; Banadkohi, H.Z.; Talakesh, M.M. Polyurethane-Silica Nanocomposite Membranes
for Separation of Propane/Methane and Ethane/Methane. Ind. Eng. Chem. Res. 2014, 53, 2011–2021.
[CrossRef]
46. Das, S.; Mohanty, S.; Nayak, S.K. Synthesis and Characterization of Green Polyurethane/Nanosilica
Composite: Study of Thermomechanical, Surface Topography and Physicochemical Properties. Mater. Focus
2018, 7, 172–181. [CrossRef]
47. Hu, Y.; Zhang, J.; Sato, H.; Noda, I.; Ozaki, Y. Multiple melting behavior of poly(3-hydroxybutyrate-co-3-
hydroxyhexanoate) investigated by differential scanning calorimetry and infrared spectroscopy. Polymer
2007, 48, 4777–4785. [CrossRef]
© 2018 by the authors. Licensee MDPI, Basel, Switzerland. This article is an open access
article distributed under the terms and conditions of the Creative Commons Attribution
(CC BY) license (http://creativecommons.org/licenses/by/4.0/).You can also read