A Cross-Country Analysis of the Risk Factors for Depression at the Micro and Macro Level - IDB WORKING PAPER SERIES No. IDB-WP-195
←
→
Page content transcription
If your browser does not render page correctly, please read the page content below
IDB WORKING PAPER SERIES No. IDB-WP-195

A Cross-Country Analysis
of the Risk Factors for
Depression at the Micro
and Macro Level

Natalia Melgar
Máximo Rossi

September 2010

  Inter-American Development Bank
  Department of Research and Chief Economist
A Cross-Country Analysis
of the Risk Factors for Depression
  at the Micro and Macro Level

                 Natalia Melgar
                 Máximo Rossi

       Universidad de la República, Uruguay

             Inter-American Development Bank
                          2010
Cataloging-in-Publication data provided by the Inter-American Development Bank Felipe Herrera Library Melgar, Natalia. A cross-country analysis of the risk factors for depression at the micro and macro level / Natalia Melgar, Máximo Rossi. p. cm. (IDB working paper series ; 195) Includes bibliographical references. 1. Depression, Mental. 2. Depressed persons. 3. Social ecology. I. Rossi, Máximo. II. Inter-American Development Bank. Research Dept. III. Title. IV. Series. © Inter-American Development Bank, 2010 www.iadb.org Documents published in the IDB working paper series are of the highest academic and editorial quality. All have been peer reviewed by recognized experts in their field and professionally edited. The information and opinions presented in these publications are entirely those of the author(s), and no endorsement by the Inter-American Development Bank, its Board of Executive Directors, or the countries they represent is expressed or implied. This paper may be freely reproduced provided credit is given to the Inter-American Development Bank.
Abstract*
        Past research has provided evidence of the role of some personal
        characteristics as risk factors for depression. However, few studies have
        examined jointly their specific impact and whether country characteristics
        change the probability of being depressed. In general, this is due to the use
        of single-country databases. The aim of this paper is to extend previous
        findings by employing a much larger dataset and including the country
        effects mentioned above. The paper estimates probit models with country
        effects and explores linkages between specific environmental factors and
        depression using data from the 2007 Gallup Public Opinion Poll. Findings
        indicate that depression is positively related to being a woman, adulthood,
        divorce, widowhood, unemployment and low income. Moreover, there is
        evidence of the significant positive association between inequality and
        depression, especially for those living in urban areas. Finally, some
        population’s characteristics facilitate depression (age distribution and
        religious affiliation).

        JEL classification: D01, I10, I12, J18, Z13
        Keywords: Depression, Health, Well-being, Cross-country research

*
  This article is part of the research project promoted by the Inter-American Development Bank involving
studies on Quality of Life.
1. Introduction
Depression is one of the world’s most widespread mental illnesses and one that affects people
for a wide variety of reasons. The relevance of investigating the factors that facilitate
depression is twofold. On one hand, it has a strong impact on quality of life and happiness.
On the other hand, this knowledge may be useful for identifying at-risk groups and for health
policy design.
As the Centre for Economic Performance (2006) argued, massive distress is a major
form of deprivation. In 2001, the World Health Organization (WHO) projected that
depression was expected to be the leading mental disorder in the developed world by 2020.
Two years later, WHO estimated that the overall cost of mental disorders accounted for
between three and four percent of Gross Domestic Product, and WHO (2007) stated that
depression alone is responsible for 4.5 percent of the worldwide total burden of disease.
Previous researches have shown that there is a set of individual characteristics that
facilitate depression, including but not limited to age, divorce, widowhood, and being a
woman (Al-Issa, 1982; Gurland et al., 1988; Miech and Shanahan, 2000; Myers et al., 1984;
Turner and Turner, 1999; and Van de Velde, Levecque and Bracke, 2009). Most studies,
however, have focused on only one dimension or used single-country surveys. In other
words, they did not consider all individual characteristics at the same time, or they were
unable to include background effects.
As well-being is directly related to depression and unhappiness, depression should
become a policy issue. As Layard (2008) pointed out, what matters is to find the conditions in
which (un)happiness occurs in order to undertake active policies. Hence, the aim of this paper
is to determine the factors that increase the probability of being depressed at both the micro
and macro levels.
The main contributions of this study are threefold. First, by employing a large dataset,
we are able to extend previous findings and to compute simultaneously the effects of specific
individuals’ characteristics on the probability of being depressed. Second, we assess how
individuals are affected by background—in particular, whether countries’ attributes are
significant stressors (e.g., economic performance, religion, and age distribution, among
others). Finally, we show the role of living in urban areas as a specific stressor when income
inequality is relatively high; this finding highlights the role of social networks.
2The dataset for this research is the 2007 Gallup Public Opinion Poll that allows us to
consider a large and widely heterogeneous set of micro-data (93 countries and more than
80,000 observations).
This paper is organized as follow. Section 2 presents some empirical evidence linked
with the effect of individuals’ characteristics (gender and age, among others). Section 3
describes the (less developed) literature about the impact of background and country
characteristics on the probability of being depressed. Section 4 outlines the main features of
the dataset and econometric methods applied in this analysis and describes the variables, and
Section 5 presents results. Section 6 concludes.
2. Which Characteristics of Individuals Facilitate Depression?
There is a large body of research that focus on the higher rates of depression among women
in comparison to men (Al-Issa, 1982 and Myers et al., 1984). Furthermore, Turner and
Turner (1999) showed that emotional reliance was related to depression, and in particular that
the positive linkage between them was greater for women. Van de Velde et al. (2009)
considered the frequency and occurrence of certain depressive symptoms and found a higher
prevalence of them in women than men.
In line with this, some studies specifically linked depression among women with
interpersonal dependence towards men, the low prestige of the role of homemaker and having
greater responsibilities (Gove and Tudor, 1973; Rosenfield, 1999; Roxburgh, 2004; and
Simon, 1995). Barnett and Gotlib (1988) argued that people who need the approval of others
for the maintenance of their self-esteem are more likely to feel depressed. Analyzing
depression among employed people, Roxburgh (2004) provided evidence of a higher level of
depression among women. The author also found, however, that women with multiple roles
tended to be less depressed than women with few roles.
We also expect that the chances of depression are affected by age. Age involves
several issues; hence the expected sign cannot be unambiguously determined. Being older
may imply a change in social status, maturity, the erosion of functions and power and other
life-course adjustments that depend on specific experiences. For example, Pearlin et al.
(1981) held that a more positive self-image reduced depression. Gurland et al. (1988) and
Kennedy et al. (1989) showed that physical limitations for performing daily activities
increased depression, while Mirowsky and Ross (1992) argued that age in itself does not
increase depression.
3Being religious has different implications for mental health and may condition life
choices or judgments about life’s experiences. Watson, Morris and Hood (1989) show that
among religious people, depression is lower among those with intrinsic religious motivations
than among those with extrinsic motivations. Genia and Shaw (1991) argue that religious
people (those affiliated with a religious group) tend to be less depressed than atheists and
agnostics.
Inevitably in a study of this issue, we investigate the role of religious orientation and
religiosity. Even when this relationship has been previously examined at the micro level, we
add an unexplored field: the role of religious orientation at the country level. In particular, we
assess whether the percentage of Catholics, Muslims or Protestants make any significant
difference in the probability of being depressed.
Urban environments may be more stressful than rural environments. Rural networks
are denser and more kin-based than those in urban areas. Moreover, crime rates, divorce, and
other social pathologies are higher in cities than in county areas (Glass and Singer, 1972;
House, Umberson and Landis, 1988; and Krupat and Guild, 1980). However, living in a city
may facilitate finding a job or increase access to services such as drinking water or telephone
lines. Therefore, we also explore whether living in urban areas makes a significant difference.
Negative life-events may also influence the chances of being depressed. Ford et al.
(2004, 2007) held that family break-up, family conflicts, the mental health of the mother, and
adverse family events play a huge direct role in causing mental illness. Moreover, disruptive
experiences (such as being divorced or widowed) or unemployment may be important
stressors. As proof of this, Turner (1994) showed that marital conflict had a significant effect
for both women and men, though higher for the former. Unemployment also is expected to
play a relevant role. Roxburgh (1996) found that labor market stress was significant. Miech
and Shanahan (2000) found that being out of the labor force and widowhood increase
depression.
Finally, we examine the role of income. Higher income is associated with higher
living standards and greater life satisfaction, since more resources are available with which to
cope with life’s stressful events and circumstances (Burr, McCall and Powell-Griner, 1994).
In addition to the limited resources by definition associated with poverty, previous studies
have consistently found the incidence and persistence of depression to be higher among
persons with low incomes who have smaller social networks (Cochran et al., 1990; Conger et
al., 1990; House, Umberson and Landis, 1988; and Voydanoff and Donnelly, 1988). Our
dataset does not include a direct question about income level or educational level or an
4indirect question about relative income. However, we include three variables related to
income and quality of life: 1) having running water, 2) having electricity and 3) having a
telephone. We expect the presence of these factors to reduce the probability of being
depressed.
3. Are Countries’ Characteristics Relevant Stressors?
The second main motivation of this study is to show how individuals are affected by
background. In particular, we assess whether depression has causes at the macro level.
Wechsler (1961) showed that depression and suicide were more frequent in
communities that had rapidly grown, and increased population may imply changes that may
alter social organizations or disorganization. The author found that more cases of depression
were registered in those communities where the percentage of young population is relatively
higher than that of older people. Following this argument, our model includes the percentage
of people aged between 15 and 64 and the percentage of people aged 65 or older.
Moreover, quality of life is linked with poverty, crime, (dis)satisfaction and other
life’s experiences. Poor countries provide worse access to basic services (communication,
education, health, transportation, etc.). High inequality, moreover, may increase feelings of
dissatisfaction or frustration. Since economic resources allow people to maintain extended
networks and frequent contact with other people (friends or family), we hypothesize that,
while relatively higher Gross Domestic Product (GDP) per capita may be negatively related
to depression, inequality (measured through the GINI index) and depression are positively
related.
Costa-Font and Gil (2006) found a significant impact of socio-economic inequality on
reported depression in Spain, corroborating findings elsewhere (La Gory and Fitzpatrick,
1992; Lorant et al., 2003; Muramatsu, 2003; Scheffler, Zhang and Snowden, 2001; Scheffler,
1999 and Zimmerman and Katon, 2005). Wilkinson (1997) argues that stress caused by the
perception of income inequality leads to depression and poorer health.
However, GDP per capita is a variable that captures an average economic
characteristic of the country and is not related to personal income level. Hence, we do not
expect GDP per capita to possess great explanatory power. Indeed, we speculate that a
measure of income inequality (as the GINI index) is a good predictor of depression due to its
relationship with income distribution in a specific country.
54. Data and Methodology
The data source is the Gallup Public Opinion Poll; the fieldwork was carried out in 2005 and
2006. Considering coverage, the level of tools standardization and the methodology, this
survey is an unprecedented initiative.
This survey has important advantages that allow researchers to assess a great variety
of issues and, at the same time, to including a large set of countries.
With this poll, Gallup seeks to construct a micro-level dataset that reports views and
attitudes of the world population in the same way that macroeconomic variables such as
Gross Domestic Product, unemployment and infant mortality are measured.
The question used in the survey questionnaire to identify if respondent has felt
depressed is: “Did you experience the following feelings during A LOT OF THE DAY
yesterday? How about depression?” Responses were grouped in the following categories:
a. Yes
b. No
c. Do not know
d. Refuse
In this case, we focus on determining which elements shape the probability of being
depressed. Hence, we consider only responses to the first and second categories (“yes” or
“no”) and we generate the following binary dummy variable:
DEPRESSION = 1 if respondent answered “yes” and 0 if he/ she indicated “no”
The available data allow us to include 93 countries and more than 80,000
observations. This large dataset includes countries from every inhabited continent at different
stages of development that present very different backgrounds. Table 1 shows the weighted
frequency distribution of the answers to this question.
6Table 1. Distribution of Answers
DEPRESSION
0 1 Total
Total 85.37 14.63 100
Mauritania 97.27 2.73 100
Denmark 96.94 3.06 100
Albania 96.79 3.21 100
Austria 95.98 4.02 100
Sweden 95.61 4.39 100
Switzerland 95.49 4.51 100
Netherlands 95.08 4.92 100
Senegal 94.77 5.23 100
Laos 94.38 5.62 100
Germany 93.87 6.13 100
Ireland 93.51 6.49 100
Mozambique 92.97 7.03 100
Canada 92.70 7.30 100
Burkina Faso 92.68 7.32 100
Uzbekistan 92.62 7.38 100
Norway 92.24 7.76 100
Poland 92.10 7.90 100
Slovenia 91.69 8.31 100
New Zealand 91.61 8.39 100
Niger 90.92 9.08 100
Kenya 90.85 9.15 100
Panama 90.31 9.69 100
Brazil 89.82 10.18 100
United Kingdom 89.71 10.29 100
Mali 89.53 10.47 100
Belgium 89.26 10.74 100
Spain 88.86 11.14 100
Paraguay 88.57 11.43 100
Zambia 88.48 11.52 100
Israel 88.41 11.59 100
Benin 88.38 11.62 100
Finland 88.37 11.63 100
Nigeria 88.34 11.66 100
Honduras 88.04 11.96 100
Latvia 87.95 12.05 100
Kyrgyzstan 87.85 12.15 100
Argentina 87.61 12.39 100
Ghana 87.40 12.60 100
Tanzania 87.05 12.95 100
El Salvador 86.60 13.40 100
Vietnam 86.43 13.57 100
Slovakia 86.41 13.59 100
Bulgaria 86.23 13.77 100
Jamaica 86.13 13.87 100
Greece 86.03 13.97 100
Cameroon 86.01 13.99 100
India 85.98 14.02 100
Costa Rica 85.95 14.05 100
7Table 1., continued
Nepal 85.80 14.20 100
Czech Rep. 85.78 14.22 100
Romania 85.76 14.24 100
Estonia 85.52 14.48 100
United States 85.29 14.71 100
Italy 85.24 14.76 100
Kazakhstan 85.16 14.84 100
Macedonia 85.01 14.99 100
Chile 84.94 15.06 100
Sri Lanka 84.35 15.65 100
Uruguay 84.17 15.83 100
Venezuela 84.03 15.97 100
Croatia 83.92 16.08 100
Russia 83.91 16.09 100
Georgia 83.79 16.21 100
Colombia 83.73 16.27 100
Ukraine 83.34 16.66 100
Pakistan 82.79 17.21 100
Malawi 82.24 17.76 100
Jordan 82.22 17.78 100
South Africa 80.87 19.13 100
Belarus 80.85 19.15 100
Uganda 80.35 19.65 100
Burundi 79.99 20.01 100
Hungary 79.97 20.03 100
Tajikistan 79.55 20.45 100
Moldova 79.37 20.63 100
Dominican Rep. 79.30 20.70 100
Egypt 78.81 21.19 100
Portugal 78.74 21.26 100
Madagascar 78.55 21.45 100
Guatemala 78.53 21.47 100
Singapore 77.07 22.93 100
Nicaragua 77.00 23.00 100
Ecuador 76.75 23.25 100
Azerbaijan 76.30 23.70 100
Zimbabwe 76.18 23.82 100
Haiti 76.09 23.91 100
Turkey 75.94 24.06 100
South Korea 75.56 24.44 100
Peru 75.00 25.00 100
Rwanda 74.61 25.39 100
Bangladesh 72.36 27.64 100
Bolivia 71.85 28.15 100
Ethiopia 48.74 51.26 100
Note: Values in percentage.
8Given that our dependent variable is binary, we estimate a probit model in order to
determine which characteristics affect the probability of being depressed. After estimating the
probit model, we compute the probability that the dependent variable equals one (“being
depressed”), and we also estimate the marginal effects of the independent variables. These
figures are the changes in the abovementioned probability given a change in the independent
variables. The complete description of variables is reported in Table 2.
Table 2. Description of Independent Variables
AGE Respondent age
AGE SQUARED AGE * AGE
1 if attending a place of worship or religious service within the
RELIGIOSITY
last seven days
CATHOLICS ‘80 Percentage of Catholics in total population in 1980
COUNTRY I 1 if living in country i
DIVORCED 1 if divorced
ELECTRICITY 1 if having electricity
Logarithm of Gross Domestic Product per capita (Atlas Method,
GDP PER CAPITA
2005)
GINI GINI index (2005)
MAN 1 if a man
MARRIED 1 if married or living as married
MUSLIMS ‘80 Percentage of Muslims in total population in 1980
POPULATION 15-64 Percentage of people aged between 15 and 64 in total population
POPULATION OVER 65 Percentage of people aged 65 or older in total population
PROTESTANTS ‘80 Percentage of Protestants in total population in 1980
RELIGION 1 if religion is an important part of his/her daily life
TELEPHONE 1 if having a telephone
UNEMPLOYED 1 if being unemployed
URBAN 1 if living in urban areas
URBAN INEQUALITY URBAN * GINI index (2005)
WATER If having access to running water
WIDOWED 1 if widowed
Source: Authors’ compilation.
Finally, in order to compare results, in all cases we estimated two versions. In the first
version, we included country effects (Model I). As we expected that some variables
representing country characteristics play a relevant role, the second version (Model II)
includes variables such as Gross Domestic Product per capita, and GINI index.
95. Results
Table 1 shows that 14.6 percent of respondents answered that they had felt depressed.
Keeping in mind that the question referred to the previous day, this ratio is very high. When
considering responses per country, the table also reveals a very different pattern of behavior,
as the ratio varies widely from 2.7 percent in the case of Mauritania to 51.3 percent in the
case of Ethiopia.
Table 3 presents the marginal effects computed after probit models estimation. As
shown in the table, in both models we obtained a probability of being depressed very close to
the percentage of people that answered “yes” to the abovementioned question.
Table 3. Impacts of Independent Variables on Depression
(marginal effects after probit models estimation)
Model II – with country
Model I – with country effects
characteristics
Probability of being 12.84% 13.82%
depressed (depression=1)
Standard Standard
Marginal impact Marginal impact
deviation deviation
MAN -0.017*** [0.002] -0.015*** [0.003]
AGE 0.005*** [0.000] 0.004*** [0.000]
AGE SQUARED -0.00004*** [0.000] -0.00003*** [0.000]
MARRIED -0.016*** [0.004] -0.014*** [0.003]
DIVORCED 0.044*** [0.006] 0.047*** [0.006]
WIDOWED 0.027*** [0.006] 0.034*** [0.006]
UNEMPLOYED 0.038*** [0.003] 0.036*** [0.003]
URBAN 0.014*** [0.003] -0.015 [0.011]
RELIGION 0.002 [0.003] 0.005* [0.003]
RELIGIOSITY -0.004 [0.003] 0.003 [0.003]
WATER -0.025*** [0.004] -0.024*** [0.004]
ELECTRICITY -0.021*** [0.005] 0.005 [0.003]
TELEPHONE -0.032*** [0.003] -0.020*** [0.003]
ETHIOPIA 0.2960*** [0.027]
SOUTH KOREA 0.1268*** [0.021]
BOLIVIA 0.1198*** [0.022]
TURKEY 0.1081*** [0.020]
SINGAPORE 0.1029*** [0.020]
PORTUGAL 0.0976*** [0.019]
EGYPT 0.0908*** [0.020]
BANGLADESH 0.0902*** [0.020]
GUATEMALA 0.0796*** [0.020]
ECUADOR 0.0732*** [0.019]
PERU 0.0683*** [0.020]
10Table 3. , continued
Model II – with country
Model I – with country effects
characteristics
Probability of being 12.84% 13.82%
depressed (depression=1)
Standard Standard
Marginal impact Marginal impact
deviation deviation
AZERBAIJAN 0.0682*** [0.019]
MOLDOVA 0.0619*** [0.018]
NICARAGUA 0.0545*** [0.019]
HUNGARY 0.0498*** [0.017]
ZIMBABWE 0.0461** [0.018]
JORDAN 0.0427** [0.018]
RWANDA 0.0413** [0.017]
BELARUS 0.0351* [0.017]
BRAZIL -0.0276* [0.013]
CAMEROON -0.0296* [0.013]
UNITED KINGDOM -0.0296* [0.013]
ARGENTINA -0.0307* [0.014]
GHANA -0.0310** [0.013]
FINLAND -0.0319** [0.013]
LATVIA -0.0333** [0.013]
UGANDA -0.0341** [0.014]
KYRGYZSTAN -0.0350** [0.013]
NIGERIA -0.0416** [0.013]
JAMAICA -0.0454** [0.017]
MALAWI -0.0470*** [0.013]
SLOVENIA -0.0493*** [0.012]
HONDURAS -0.0551*** [0.012]
BELGIUM -0.0568*** [0.011]
PARAGUAY -0.0569*** [0.012]
TANZANIA -0.0602*** [0.012]
PANAMA -0.0620*** [0.012]
CANADA -0.0643*** [0.010]
POLAND -0.0654*** [0.011]
NORWAY -0.0659*** [0.011]
ZAMBIA -0.0662*** [0.007]
NEW ZEALAND -0.0693*** [0.011]
BENIN -0.0714*** [0.011]
IRELAND -0.0738*** [0.010]
MALI -0.0804*** [0.009]
UZBEKISTAN -0.0812*** [0.009]
GERMANY -0.0816*** [0.009]
KENYA -0.0941*** [0.008]
MOZAMBIQUE -0.0947*** [0.008]
SWITZERLAND -0.0956*** [0.008]
11Table 3., continued
Model II – with country
Model I – with country effects
characteristics
Probability of being 12.84% 13.82%
depressed (depression=1)
Standard Standard
Marginal impact Marginal impact
deviation deviation
NIGER -0.0957*** [0.008]
SWEDEN -0.0993*** [0.008]
BURKINA FASO -0.0994*** [0.008]
AUSTRIA -0.1043*** [0.007]
LAOS -0.1052*** [0.008]
SENEGAL -0.1073*** [0.007]
NETHERLANDS -0.1120*** [0.007]
DENMARK -0.1164*** [0.006]
ALBANIA -0.1165*** [0.007]
MAURITANIA -0.1371*** [0.004]
GDP PER CAPITA -0.000 [0.002]
GINI 0.074*** [0.022]
URBAN INEQUALITY 0.065** [0.027]
CATHOLICS ‘80 -0.0003*** [0.000]
MUSLIMS ‘80 -0.0001*** [0.000]
PROTESTANTS ‘80 -0.0009*** [0.000]
POPULATION 15-64 0.001** [0.000]
POPULATION OVER 65 -0.001*** [0.000]
Observations 83,429 83,429
Pseudo R-squared 0.06 0.02
Notes: Robust standard errors in brackets.
* significant at 10%; ** significant at 5%; *** significant at 1%
Unites States is the omitted variable in Model I
Only countries with significant effects are included in the table. Countries not included are the following:
Bulgaria, Burundi, Chile, Colombia, Costa Rica, Croatia, Czech Republic, Dominican Republic, El Salvador,
Estonia, Georgia, Greece, Haiti, India, Israel, Italy, Kazakhstan, Macedonia, Madagascar, Nepal, Pakistan,
Romania, Russia, South Africa, Slovakia, Spain, Sri Lanka, Tajikistan, Ukraine, Uruguay, Venezuela and
Vietnam.
As previous literature on the issue has argued, the fact that men tend to be less
depressed than women is clearly confirmed by our model. Being a man reduced the
probability of being depressed by almost 1.6 percentage points.
We initially also addressed the hypothesis that age should be an important predictor of
depression. We verify this assumption and also add new elements to the discussion. As was
mentioned above, the impact of age on depression is multidimensional (social status,
maturity, the erosion of functions and power and other life-course circumstances, etc.). The
models show that age has a positive impact, as the net effect of being older tends to favor
depression but with a decreasing growth rate (age-squared variable is significant at 1
percent).
12Furthermore, the age distribution of the population also matters. While the percentage
of people aged 65 or older has a negative effect, the percentage of people aged between 15
and 64 shows a positive effect. We thus confirm the findings of Wechsler (1961). This result
may be related to the specific stressors experienced by a fast-growing population: higher
population concentration, the urbanization process and increased demand for all basic
services.
The results consistently support the facts that marital status also plays a relevant role
in shaping depression. Those who are married or living as married tend to be less depressed
than single people, while those who have experienced marital break-up or widowhood are
more likely to be depressed than single people and/ or married people. Furthermore, being
divorced (an experience that may imply conflict with another person) registers a higher
(negative) impact than being widowed.
Moreover, as hypothesized, negative life experiences such as being unemployed also
increase the probability of being depressed. The models show that the effect is relatively
high, approximately 3.7 percentage points. WHO (2008) similarly argues that increased
depression and anxiety are adverse health effects of unemployment.
Regarding GDP per capita and income inequality, the results clearly corroborate our
hypothesis. Model II shows that GDP per capita is not a significant predictor of depression.
Indeed, what matters is income inequality, as we find that a higher GINI index raises the
probability of being depressed.
Previous researches have also found theses effects. Burr, McCall and Powell-Griner
(1994) and Freeman (1998) hold that, without the presence of an income distribution variable
(such as the GINI index), an income variable (such as GDP per capita) may capture the effect
of income inequality and result in a negative association between this variable and
depression. In order to test this result, we estimate Model II without two independent
variables (GINI index and the interacted variable) and verify the previous result: GDP per
capita becomes significant and with a negative sign (this model is not included in Table 3).
Furthermore, the income inequality effect is much higher in urban areas. Model I
(country effects model) shows that being depressed is positively linked to living in urban
areas. In Model II, we interacted the GINI index with the variable representing the place of
residence (URBAN). This variable turned out to be significant at 1 percent, while URBAN is
not significant.
The conclusion that arises from the joint examination of results is that depression is
not directly related to living in urban areas; instead, the relevant factor that influences the
13probability of being depressed is income inequality, whose explanatory power is higher in
urban areas.
One direct possibility for this finding may be that income inequality is more visible in
urban areas, where homeless persons and beggars—as well as the conspicuously wealthy—
are seen in everyday life. Additionally, an indirect possibility is that social networks may be
more supportive in rural than urban areas and may better equip rural residents to deal with
social problems.
The set of variables linked to personal income (having running water, telephone and
electricity) shapes depression in the expected direction. Model I shows that all of them are
significant at 1 percent and negatively related to depression. However, Model II indicates that
electricity is not significant. Keeping in mind that GDP turned out not to be significant, this
finding may have a similar explanation.
In contrast, having running water and a telephone are not only linked to personal
income but also have implications for personal health and the possibility of being in touch
with other people. On the other hand, having electricity may be more directly related to
income, and its effect in Model I may imply an income-inequality effect more than a pure
income-level effect.
When considering religion and religiosity, results indicate that attendance of religious
services makes no significant difference in shaping depression. However, results linked to the
importance of religion in people’s life are ambiguous. Model I shows that assigning
importance to religion is not significant, while Model II shows a weak positive effect
(significant at 10 percent). We also test whether religious affiliation at the country level was
significant. In this regard, we first find that, no matter which religion is considered, the higher
the percentage of religious people, the less likely people are to be depressed. Second, even
when the probability of being depressed falls when the percentage of Catholics, Muslims or
Protestants in total country population is up, the impact of the latter religious affiliation is
much higher.
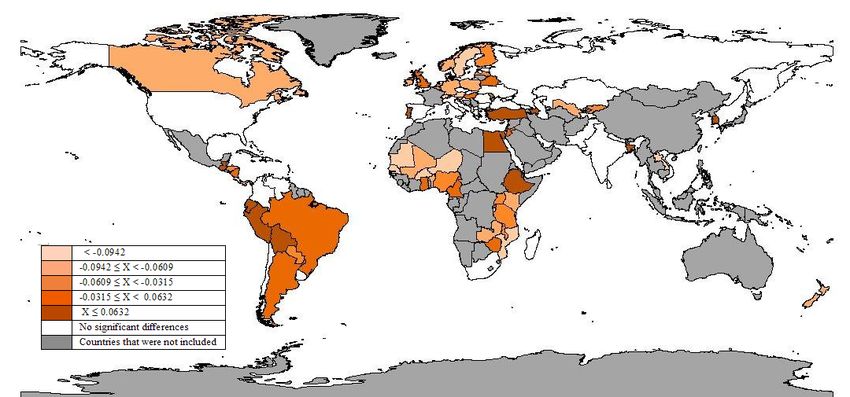
In addition to specific countries’ characteristics, model I includes binary variables that
equal one if the respondent lives in this country and zero if not. The marginal effects of this
set of variables, reported in Table 3, are used to calculated quintiles and construct the
depression map shown in Figure 1 (figures appear at end of paper).
The United States (US) is the omitted variable in Model I, and the results should
therefore be interpreted with respect to this country. We choose this country given the
relative abundance of information and research on it, hence the basis of comparison is easier
14established. A large set of countries shows no significant differences with the US (shown in
white on our map). Positive marginal effects indicate that people tend to be more depressed
than US citizens and vice versa. Ethiopia is ranked first, i.e., with the highest incidence of
depression (29.6 percentage points), while Mauritania is found at the bottom of the ranking,
with -13.7 percentage points.
In line with our previous findings, the ranking shows that people in the three most
equitable countries of the sample—Denmark, Norway and Sweden—are less likely to be
depressed than US citizens.
At the other extreme, the three least equitable countries are Bolivia, Brazil and
Honduras. Bolivia, which presents the highest GINI index, registers a relatively high positive
marginal effect. In the other two cases, the negative effect may be explained by the very high
percentage of people with religious affiliation; this phenomenon may outweigh the GINI
effect.
We speculate that the same is true in the case of the large and heterogeneous set of
countries that registers no significant differences with the US. They present very different
GINI index, age distribution and religion affiliation, but the net effect of these forces is not
significant.
Moreover, considering the 41 countries that register a significant negative sign (lower
probability of being depressed), 27 present more income equality than the US. Among the
less equitable countries (14 cases) that register a negative marginal effect, we find the
following countries where the percentage of religious people is high: Honduras and Panama
(high percentage of Catholics), Niger and Senegal (where the percentage of Muslims is very
high), Jamaica and Uganda (high ratio of Protestants) and Brazil and Mozambique (where the
aggregate affiliation with the three religions is very high). This effect may more than
compensate for the income inequality effect.
Regarding GDP per capita, we find that the richest countries (Ireland, Norway and
Switzerland) show a decline in the probability of being depressed, as do the poorest countries
of our dataset (Malawi, Tanzania and Niger). Once again, we point out the effect of income
inequality as a relevant stressor instead of average income at country level.
In order to shed light on the relationship among GINI index, GDP per capita and our
ranking of countries, Figures 2 and 3 show the dispersion graphs. Figure 2 illustrates a high
dispersion between GDP per capita and our ranking while Figure 3 shows a negative
association between inequality and our ranking.
156. Conclusions
This study’s main contributions are threefold and may be a factor of influence in identifying
risk groups and in designing targeted health policies.
First, by employing a large dataset, we present econometric evidence that verifies
previous findings. Being a woman, being older, divorce, widowhood, unemployment, and not
having running water or a telephone are factors that raise the probability of being depressed.
Second, new evidence is provided about the effects of environmental factors or
country characteristics. While lower income inequality, a high rate of religious people in the
total population and a high rate of people aged 65 and older tend to reduce depression, a high
rate of people aged between 15 and 64 has the opposite effect.
Third, we find that it makes no significant difference whether people live in an urban
area or not in itself. However, when we interact this variable with the GINI index, we find
that, given a specific level of inequality, living in urban areas favors depression. This
phenomenon may be related to the presence of more homeless persons and beggars and
higher crime rates in urban areas, and it may motivate the action of civil society in
strengthening social networks that better enable people to deal with those problems.
These results indicate that social conditions and country characteristics are specific
factors that influence depression. Findings shed light on the need for further research about
the roles of culture, political context and other countries’ characteristics as potential stressors.
16References
Al-Issa, I. 1982. “Gender and Adult Psychopathology.” In: I. Al-Isaa, editor. Gender and
Psychopathology. New York, United States: Academic Press.
Barnett, R., and I. Gotlib. 1988. “Psychosocial Functioning and Depression: Distinguishing
among Antecedents, Concomitants and Consequences.” Psychological Bulletin 104:
97-126.
Burr, J., P. McCall and E. Powell-Griner. 1994. “Catholic Religion and Suicide: The
Mediating Effect of Divorce.” Social Science Quarterly 75(2): 300-318.
Centre for Economic Performance, Mental Health Policy Group. 2006. The Depression
Report: A New Deal for Depression and Anxiety Disorders. London, United
Kingdom: London School of Economics.
Cochran, M. et al. 1990. Extending Families: The Social Networks of Parents and Their
Children. Cambridge, United Kingdom: Cambridge University Press.
Conger, R. et al. 1990. “Linking Economic Hardship to Marital Quality and Instability.”
Journal of Marriage and the Family 52: 643-656.
Costa-Font, J., and J. Gil. 2006. “Socio-Economic Inequalities in Reported Depression in
Spain: a Decomposition Approach.” Working Papers in Economics 152. Barcelona,
Spain: Universitat de Barcelona.
Ford, T., S. Collishaw, H. Meltzer and R. Goodman. 2007. A prospective study of childhood
psychology: independent predictors of change over three years, Social Psychiatry and
Psychiatric Epidemiology 42: 953-961.
Ford, T., R. Goodman and H. Meltzer. 2004. “The Relative School Importance of Child,
Family, School and Neighbourhood Correlates of Childhood Psychiatric Disorder.”
Social Psychiatry and Psychiatric Epidemiology 39: 487-496.
Freeman, D.G. 1998. “Determinants of Youth Suicide: The Easterlin-Holinger Cohort
Hypothesis Re-Examined.” American Journal of Economics and Sociology 57: 183-
200.
Genia, V., and D. Shaw. 1991. “Religion, Intrinsic-Extrinsic Orientation and Depression.”
Review of Religious Research 32(3): 274-283.
Glass, D., and J. Singer. 1972. Urban Stress: Experiments on Noise and Social Stressors.
New York, United States: Academic Press.
Gove, W., and J. Turdor. 1973. “Adult Sex Roles and Mental Illness.” American Journal of
Sociology 77: 812-835.
17Gurland, B.J. et al. 1988. “The Relationship between Depression and Disability in the
Elderly: Data from the Comprehensive Assessment and Referral Evaluation (CARE).”
In: J. Wattis and I. Hindmarch, editors. Psychological Assessment of the Elderly. New
York, United States: Churchill Livingstone.
House, J., D. Umberson and K. Landis. 1988. “Structures and Processes of Social Support.”
Annual Review of Sociology 14: 293-380.
Kennedy, G. et al. 1989. “Hierarchy of Characteristics Associated with Depressive
Symptoms in an Urban Elderly Sample.” American Journal of Psychiatry 146(2):
220-225.
Krupat, E., and W. Guild. 1980. “Defining the City: The Use of Objective and Subjective
Measures for Community Description.” Journal of Social Issues 36: 9-28.
La Gory, M., and K. Fitzpatrick. 1992. “Effects of Environmental Context on Elderly
Depression.” Journal of Aging and Health 4(4): 459-479.
Layard, R. 2008. Social Science and the Causes of Happiness and Misery. Max Weber
Lecture 2008/09. San Domenico di Fiesole, Italy: European University Institute.
Available at: http://cadmus.eui.eu/dspace/bitstream/1814/9853/1/MWP_LS_2008_09.pdf.
Lorant, V. et al. 2003. “Socio-economic Inequalities in Depression: A Meta-Analysis.”
American Journal of Epidemiology 157(2): 98-112.
Miech, R., and M. Shanahan. 2000. “Socioeconomic Status and Depression over the Life
Course.” Journal of Health and Social Behaviour 41(2): 162-176.
Mirowsky, J., and C. Ross. 1992. “Age and Depression.” Journal of Health and Social
Behavior 33(3): 187-205.
Muramatsu, N. 2003. “County-Level Income Inequality and Depression among Older
Americans: Empirical Analyses.” Health Service Research 38(6): 1863-1883.
Myers, J. et al. 1984. “Six-Month Prevalence of Psychiatric Disorders in Three
Communities.” Archives of General Psychiatry 41: 959-967.
Pearlin, L. et al. 1981. “The Stress Process.” Journal of Health and Social Behavior 22: 337-
356.
Rosenfield, S. 1999. “Gender and Mental Health: Do Women Have More Psychopathology,
Men More or Both the Same (and Why)?” In: V. Horowitz and L. Scheid, editors. A
Handbook for the Study of Mental Health: Social Contexts, Theories and Systems.
New York, United States: Cambridge University Press.
Roxburgh, S. 1996. “Gender Differences in Work and Well-Being: Effects of Exposure and
Vulnerability.” Journal of Health and Social Behavior 37: 265-277.
18----. 2004. “There Just Aren’t Enough Hours in the Day: The Mental Health Consequences of
Time Pressure.” Journal of Health and Social Behavior 45: 115-131.
Scheffler, R. 1999. “Managed Behavioral Health Care and Supply-Side Economics.”
Journal of Mental Health Policy and Economics 2(1): 21–28.
Scheffler, R., A. Zhang and L. Snowden. 2001. “The Impact of Realignment on Utilization
and Cost of Community-Based Mental Health Services in California.” Administration
and Policy in Mental Health and Mental Health Services Research 29(2): 129-143.
Simon, R. 1995. “Gender, Multiple Roles, Role Meaning, and Mental Health.” Journal of
Health and Social Behaviour 36: 182-194.
Turner, H. 1994. “Gender and Social Support: Taking the Bad with the Good?” Sex Roles 30:
521-541.
Turner, H., and R. Turner. 1999. “Gender, Social Status, and Emotional Reliance.” Journal of
Health and Social Behavior 40: 360-373.
Van de Velde, S., K. Levecque and P. Bracke. 2009. “Measurement Equivalence of the CES-
D8 in the General Population in Belgium: A Gender Perspective.” Archives of Public
Health 67: 15-29.
Voydanoff, P., and B. Donnelly. 1988. “Economic Distress, Family Coping, and Quality of
Family Life.” In: P. Voydanoff and L. Majka, editors. “Families and Economic
Distress: Coping Strategies and Social Policy.” Beverly Hills, United States: Sage.
Watson, P., R. Morris and R. Hood. 1989. “Sin and Self-Functioning, Part 4: Depression,
Assertiveness and Religious Commitments.” Journal of Psychology and Theology 17:
44-58.
Wechsler, H. 1961. “Community Growth, Depressive Disorders, and Suicide.” American
Journal of Sociology 67(1): 9-16.
Wilkinson, R.G. 1997. “Health Inequalities: Relative or Absolute Material Standards?”
British Medical Journal 314: 591-595.
World Health Organization (WHO). 2001. World Health Report 2001. Geneva, Switzerland:
WHO.
----. 2003. Investing in Mental Health. Geneva, Switzerland: WHO.
----. 2007. Ten Statistical Highlights in Global Public Health. Geneva, Switzerland: WHO.
----. 2008. Now More than Ever. Geneva, Switzerland: WHO.
Zimmerman, F.J., and W. Katon. 2005. “Socio-Economic Status, Depression Disparities and
Financial Strain: What Lies Behind the Income–Depression Relationship?” Health
Economics 14(12): 1197-1215.
19Figure 1. Depression Map
Source: Authors’ compilation by considering the marginal effects per country of residence.
20Figure 2. Relationship between GDP per capita and Marginal Effects on Depression
11.00
Norw ay
Ireland Sw itzerland United States
Denmark Austria Canada United Kingdom
Sw eden Belgium Finland
Netherlands Germany Italy Singapore
10.00 Spain
Israel
New Zealand Slovenia Greece South Korea
Czech Rep. Hungary Portugal
Slovakia
Poland Latvia Estonia
Croatia
GDP per capita (in logs)
Argentina Chile
South Africa
Russia
Costa Rica
Brazil 9.00 Uruguay
Bulgaria
Romania Turkey
Panama Dominican
Kazakhstan Rep.
Belarus
Colombia
Macedonia
Venezuela
Ukraine Jordan Peru
Albania El Salvador Azerbaijan
Guatemala
Paraguay Jamaica Sri Lanka Egypt
Georgia Ecuador
Hoduras
8.00 India
Vietman Nicaragua
Mauritania Ghana Bolivia
Laos Uzbekistan Cameroon Pakistan Moldova
Kyrgyzstan Bangladesh
Senegal Haiti
Uganda Nepal Zimbabw e
Burkina FasoMozambique 7.00 Tajikistan
Kenya Benin Nigeria Rw anda
Mali Zambia Madagascar Ethiopia
Niger Tanzania
Malaw i Burundi
6.00
-0.15 -0.10 -0.05 0.00 0.05 0.10 0.15 0.20 0.25 0.30
Depression, marginal effect
Source: Authors’ compilation by considering the marginal effects per country of residence and GDP per capita (Gallup).
21Figure 3. Relationship between GINI Index and Marginal Effects on Depression
0.65
Brazil Bolivia
0.60 Haiti
Hoduras Colombia
South AfricaNicaragua
Dominican Rep.
Panama0.55 Chile Guatemala
Paraguay Ecuador
Zimbabw e
Niger Argentina Peru
Zambia 0.50 Venezuela
El Salvador
Mozambique Madagascar
Nepal Rica
Uganda Costa
GINI Index
Jamaica Rw anda
0.45 Uruguay
Kenya Nigeria Cameroon Turkey
Burkina Faso Ghana Burundi Singapore
Senegal United States
0.40 Georgia
Sri Lanka
Russia
Mali Malaw i Israel Jordan
MauritaniaLaos Uzbekistan Latvia Macedonia Portugal
Benin India
Italy Azerbaijan
Ireland United Kingdom
Sw itzerland Estonia
0.35
Tanzania Spain
Vietman
Greece Egypt
New Zealand Kazakhstan MoldovaBangladesh
Poland Belgium Tajikistan
Albania Canada Romania
Pakistan
South Korea
Netherlands 0.30
Kyrgyzstan Belarus Ethiopia
Bulgaria
Croatia
Slovenia Ukraine
Austria Germany Finland Hungary
Denmark Slovakia
0.25 Czech Rep.
Sw eden Norw ay
0.20
-0.15 -0.10 -0.05 0.00 0.05 0.10 0.15 0.20 0.25 0.30
Depression, marginal effect
Source: Authors’ compilation by considering the marginal effects per country of residence and GINI Index (Gallup).
22You can also read