February 2020 Floods in Wales: Flood Event Data Summary
←
→
Page content transcription
If your browser does not render page correctly, please read the page content below
February 2020 Floods in Wales:
        Flood Event Data Summary

Issued 22 October 2020

Published by:
Natural Resources Wales
Cambria House
29 Newport Road
Cardiff
CF24 0TP

0300 065 3000 (Mon-Fri, 8am - 6pm)

enquiries@naturalresourceswales.gov.uk
www.naturalresourceswales.gov.uk

© Natural Resources Wales

All rights reserved. This document may be reproduced with prior permission of
Natural Resources Wales
Contents
Executive Summary ........................................................................................................... 1
Introduction .........................................................................................................................4
Environmental Conditions ...................................................................................................5
   Rainfall ............................................................................................................................5
   River Levels and Flows .................................................................................................. 14
Raising Awareness and Warning ....................................................................................... 22
   Flood Forecasting .......................................................................................................... 22
   Flood Warnings .............................................................................................................. 26
   Communications and Social Media ................................................................................ 33
Impacts .............................................................................................................................. 34
Areas Protected ................................................................................................................. 38
Next Steps and Conclusions ..............................................................................................41
Executive summary
Overview

This is a factual report providing a concise reference of what happened during the storm
events of February 2020. It will also help inform the recovery and review work related to
these events and can be a source of information for flood risk management in Wales.

During February 2020, Wales experienced several noteworthy rainfall events on the back
of a very wet autumn and winter period. The named storms, Ciara, Dennis and Jorge,
affected Wales within a period of just four weeks, with record rainfall and river flows
causing some of the most significant flooding impacts in Wales since the 1970’s.

February 2020 was the wettest February on record in Wales and the UK as well as the fifth
wettest month ever recorded. The Vyrnwy rain gauge in Powys saw 515mm of rainfall in
February, making it the wettest February for that area since records began in 1908, while
Bala in Gwynedd, recorded four times (407%) the long-term average rainfall for February.

Rainfall in the catchment areas of Wales during these events was of such intensity that
many rivers reacted extremely quickly, reaching record levels and flows. Notably,
catchments were already saturated from the previous months of near continuous rain.

Storm Ciara

Storm Ciara impacted the catchments of North Wales most severely.

Betws y Coed gauge in the Conwy catchment received 79.2mm of rainfall in 15 hours, the
equivalent to 73% of an entire month’s rainfall. Also in the Conwy catchment, Llanrwst
gauge received 100.2mm of rainfall in 16 hours, equating to 76% of an entire month’s
rainfall.

The River Elwy at Pont Y Gwyddel reached its highest level since the start of records in
1974. It’s estimated that the Elwy at this location was flowing at 220 cubic metres (or
tonnes) of water per second (m3/s).

Storm Dennis

Storm Dennis resulted in substantial and intense rainfall with significant impacts on river
flows, river levels and flooding in South Wales.

Nant yr Ysfa gauge, situated between the Cynon and Rhondda Fach catchments, received
130.4mm of rainfall in 24 hours, the equivalent to 72% of an entire month’s rainfall in a
single day. At the top of the Rhondda Fawr catchment, Tyn Y Waun gauge received 132.4
mm of rainfall in 24 hours, this equates to 62% of a month’s rainfall in a single day.

In Pontypridd, the River Taff reached its highest level since records began in 1968. Peak
flow passing through Pontypridd was estimated at 805 m3/s, enough to fill an Olympic size
swimming pool in just over three seconds. This river level is 78cm higher than the previous
record-level set during the 1979 floods.

                                                                                      Page 1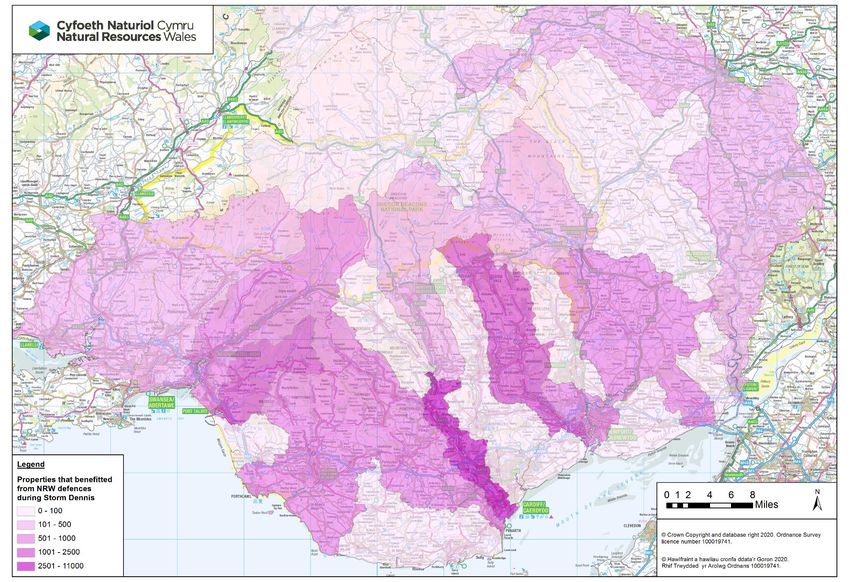
Flood Warnings

February 2020 became the busiest month on record for issuing Flood Warnings in Wales;
243 Flood Alerts, 181 Flood Warnings and six Severe Flood Warnings were issued. These
reached 55,784 individuals, helping people to prepare and take action to save themselves
and protect their property. However, due to the intense nature of events, a small number of
flood warnings were issued late, or not at all. On the Lower Taff and the River Teifi, three
communities in each location had late warnings, whilst 11 locations on the River Rhymney
and one on the River Towy received none at all. The reasons behind this are being
assessed and will then need to be addressed accordingly.

Property Flooding

A total of 3,130 properties were flooded during February 2020 in Wales. These included
224 properties flooded during Storm Ciara, 2,765 properties during Storm Dennis, and 141
during Storm Jorge. Of these, an estimated 2,527 were households, with average claims
data from the insurance industry valuing around £81 million of flood damage.

During Storm Ciara, the River Elwy in St Asaph experienced higher river levels than those
which caused extensive flooding in 2012. The newly constructed NRW flood alleviation
scheme, however, worked well and protected the vast majority of the community.

Similarly, during Storm Dennis many rivers were at historically high levels, exceeding the
1979 levels which caused extensive flooding and damage across South Wales and in
particular Cardiff. However, although significant flooding still occurred, it is estimated that
NRW defences across South Wales protected over 19,000 properties.

NRW defences overtopped in a number of locations and some properties behind them did
flood, in some instance’s properties were flooded from other or a combination of flood
sources. Importantly NRW defences did not structurally fail. Whilst our defences are built
to provide industry-standard levels of protection, the expected impacts of climate change
require us to re-assess these standards. However, this must be in line with other
considerations such as the consequences of building ever higher defences, given the
visual impact of bigger walls in communities, and the greater concerns should they fail.
Indeed, higher defences in many cases may simply push the problem downstream to the
next community.

Media Coverage

Storms Ciara and Dennis generated 499 articles in a wide range of media outlets which
were supported by NRW communications. These included coverage in almost all of the
major print and online news outlets - some of this coverage even extended globally,
reaching news outlets in the USA. There were 42 media interviews given by NRW staff
which appeared multiple times across Welsh and UK broadcast outlets. It is estimated that
NRW reached 5.7 million people through its social media channels on Twitter and
Facebook. However, we did experience some problems with our website during periods of
peak demand, which again will need to be addressed.

                                                                                         Page 2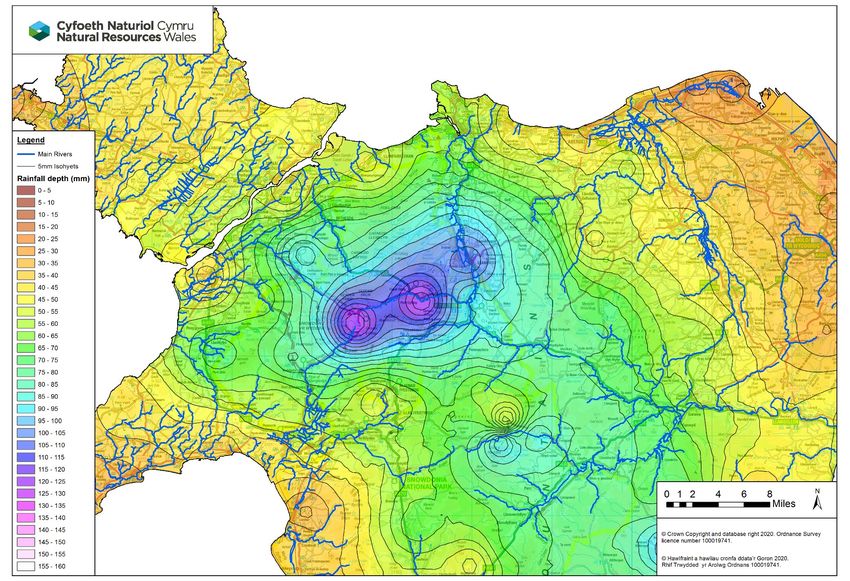
Conclusion

The facts contained in this report highlight that the last 10 years, and this winter in
particular, were record breaking in many geographic areas for rainfall totals, intensity, river
levels and flows. The consensus from climate change scientists is that extreme weather
events, such as the storms that hit Wales in February, are becoming more frequent.
Climate change is increasingly impacting the way we live and work around rivers,
catchments and the coast, and the way we manage water. Therefore, we need to
understand how to adapt the way we live and work in these locations.

Many of our structures and systems worked well, protecting large numbers of communities
and properties. However, the scale of these weather events was such that some flooding
was unavoidable; significant flooding still occurred, resulting in trauma and considerable
long-term impacts on individuals, businesses, families and communities.

NRW is therefore undertaking extensive work, including detailed flood investigations at a
local scale, to understand where there are opportunities to further improve our
infrastructure and systems in order to reduce the impact of future weather events. We will
continue to invest in people, technology, infrastructure, systems and processes to
undertake our flood risk management role.

The scale of these events also serves to highlight the increasing levels of risk associated
with the climate emergency. Managing this challenge to mitigate and adapt to climate
change will require effective policy, availability of sufficient resources and active
prioritisation of those resources for maximum benefit. Most importantly we all have to work
together, operating across the responder organisations and with the local communities
themselves to plan for and manage future events

                                                                                        Page 3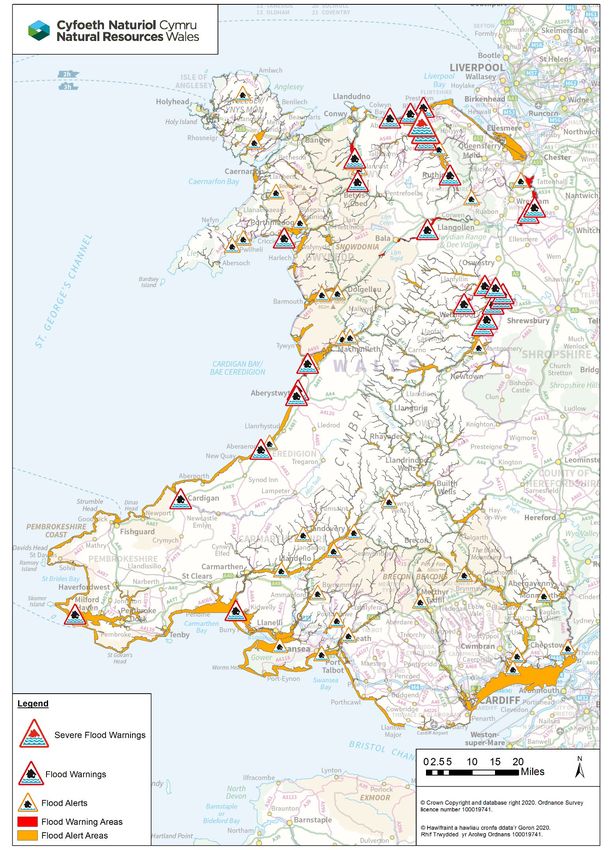
Introduction
This report contains a national overview of the extent, scale and impacts of the flood events
which impacted Wales throughout February 2020. Its purpose is to act as a reference
document, capturing the key facts and data available from this significant period of intense
wet weather, which led to some of the largest flood impacts Wales has experienced since
1979. It will inform ‘lessons learnt’ reviews and recommendations for change.

The consensus from climate change scientists is that we can expect more extreme
weather events in the future. This prompts some significant challenges for communities,
decision-makers and society as a whole in terms of how we respond to such events. Whilst
this report focuses on the facts from the February 2020 storms in Wales, it sits in the wider
context of the global Climate Emergency and the need for climate change adaptation,
mitigation and improved community resilience.

During February 2020, Wales experienced four noteworthy rainfall events, on the back of a
very wet winter period. Three of these storms fell under the naming convention introduced
by the Met Office and its European counterparts:

          •   Storm Ciara – 8 – 9 February 2020
          •   Storm Dennis – 15 – 17 February 2020
          •   Unnamed Storm – 21 – 24 February 2020
          •   Storm Jorge – 28 February – 1 March 2020

This report focusses on Storms Ciara and Dennis as the two most significant events of the
month due to their relative impacts. Storm Ciara was the third named storm of the
2019/2020 period, with weather warnings issued by the Met Office for both strong winds
and heavy rain. The main impacts from Storm Ciara were in North Wales, with severe
flooding inland and on the coast.

A week after Storm Ciara, Storm Dennis brought heavy and persistent rain across much of
Wales, with the South Wales Valleys, Brecon Beacons and Usk Valley particularly
impacted. The Met Office issued a red warning for rain across parts of South Wales with
some areas receiving more than 130mm of rain falling onto saturated ground, leading to
major and widespread flooding.

The flooding impacts from these storms had substantial and, in many cases, long-lived
impacts on individuals, communities and businesses. The exceptional rainfall and
challenging conditions also stretched the organisations involved. However, the efforts of
the affected communities and the responder organisations throughout was huge and
should be acknowledged.

Whilst over 3,000 properties did unfortunately flood across Wales, a significant number
were protected by NRW flood defences. The flood warnings sent out to individuals across
Wales helped many people to protect themselves, their families and their properties, as
well as assist partner organisations with their response.

As with the nature of any analysis of post-event data and information, this report contains
the best information currently available to NRW. Some statistics and figures may change,
in time, as further detailed analysis is undertaken and local flood investigations are
progressed.

                                                                                     Page 4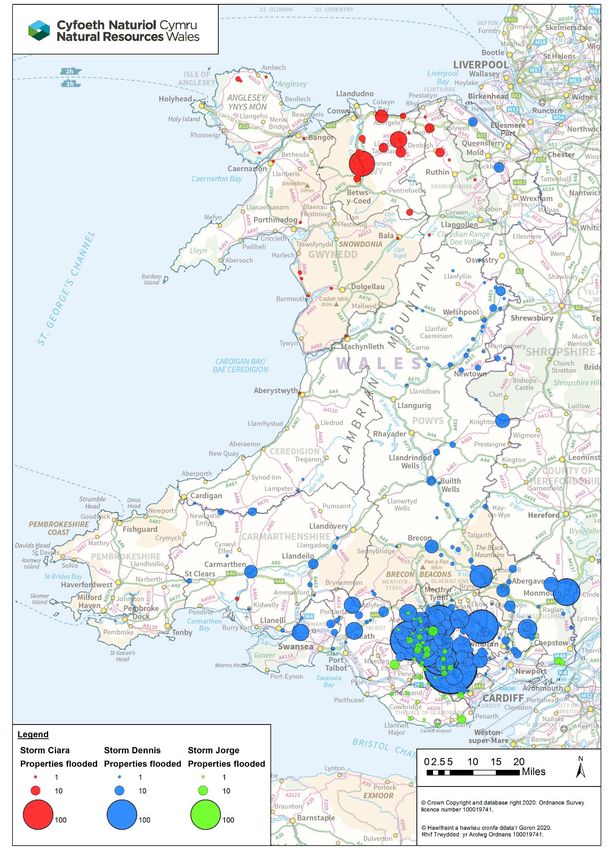
Environmental conditions
Rainfall

The winter of 2019/20 was persistently wet. Analysis undertaken by the Met Office 1 shows
that this winter was the fifth wettest on record since records began in 1862. A strong jet
stream sitting further south than normal brought a succession of weather systems across
the Atlantic, impacting many areas across the UK.

February 2020 was the wettest February on record according to the Met Office, as well as
being the fifth wettest of all months since records began. Records show Wales received
288mm of rainfall during February with some areas receiving three and a half to four times
the long-term monthly average, as shown in Figure 1 below.

                                            Wettest months on record
                                              1. October 1903
                                              2. December 2015
                                              3. November 2009
                                              4. December 1929
                                              5. February 2020
        Table 1 – Met Office records of wettest months in the UK since records began in 1862
                                                      Source: Met Office1

Significant rainfall totals were reached over the entire month, but crucially some
considerable rainfall amounts were recorded in extremely short periods of time. This
intensity of rain falling on already saturated catchments, combined with the rapidly
responding nature of the river catchments in Wales, led to some of the most extensive
flooding in a generation.

For example, the Vyrnwy rain gauge in Powys recorded 515mm of rainfall in February
making it the wettest February, and 2nd wettest 30-day period, for that area since records
began in 1908. The rain gauge at Bala in Gwynedd recorded more than four times the
long-term average (LTA) rainfall for February (407%).

1
  Met Office 2020, Record Breaking Rainfall, viewed June 2020,< https://www.metoffice.gov.uk/about-us/press-office/news/weather-
and-climate/2020/2020-winter-february-stats >

                                                                                                                         Page 5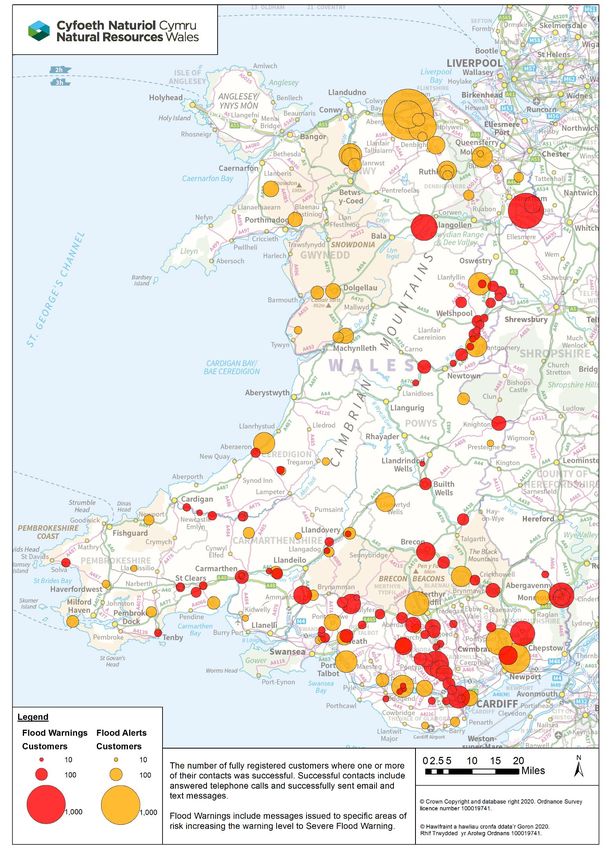
Figure 1 – February 2020 Rainfall Amounts as a percentage of the long-term average
                                                        Source: Met Office
During Storm Ciara:

       •   Betws y Coed gauge in the Conwy catchment received 79.2mm of rainfall in 15
           hours, the equivalent to 73% to an entire month’s rainfall 2

       •   Brynhyfryd gauge in the Clwyd catchment received 38.4mm of rainfall in 15 hours,
           equivalent to 72% of an entire month’s rainfall2

       •   Alwen gauge in the Dee catchment received 67mm of rainfall in 15 hours,
           equivalent to 68% of an entire month’s rainfall2

       •   Llanrwst gauge in the Conwy catchment received 100.2mm of rainfall in 16 hours,
           equivalent to 76% of an entire month’s rainfall2

       •   Plas Pigot gauge in the Conwy catchment received 57.6mm of rainfall in 16 hours,
           equivalent to 76% of an entire month’s rainfall2

       •   Brynhyfryd, Alwen and Betws y Coed gauges received the average of a typical
           entire month’s rainfall in just the first 10 days of February2

2
    Based on the Long-Term Average (LTA) for February as provided by the Met Office, using the period 1981-2010

                                                                                                                  Page 6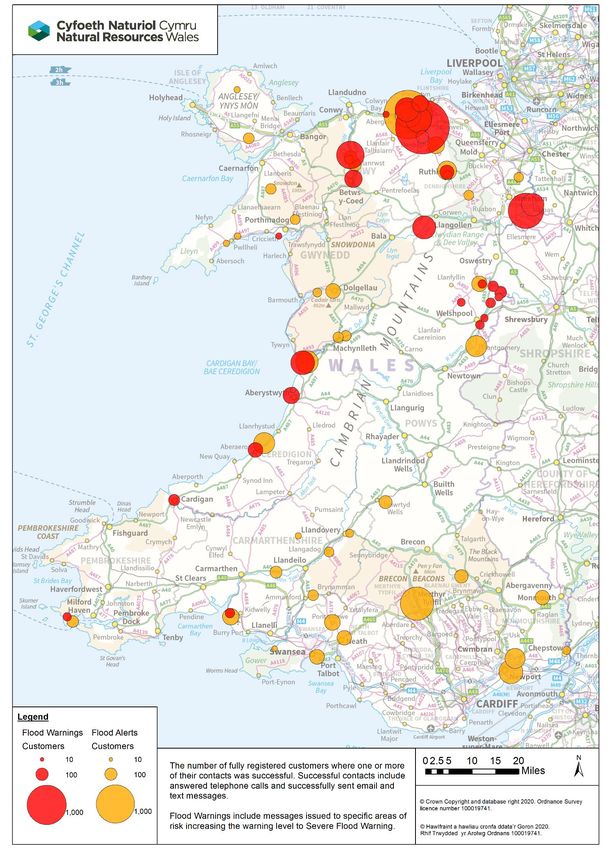
Time                          % of Feb
                           Local                              Rainfall within
 Rain gauge      Catchment                         Period                        LTA rainfall
                           Authority                          duration (mm)
                                                  (hours)                         (1981-10)
 Cwm Dyli        Glaslyn       Gwynedd              12             117.6              53

 Llanrwst        Conwy         Conwy                16             100.2              76

 Hafod Wydr      Glaslyn       Gwynedd              16              90.7              53

 Betws y Coed    Conwy         Conwy                15              79.2              73

 Gwytherin       Elwy          Conwy                14              74.2              64

 Alwen           Dee           Conwy                15               67               68

 Pant Gwyn       Dee           Gwynedd              17              63.6              25

 Ysbyty Ifan     Conwy         Conwy                16              58.6              37

 Plas Pigot      Elwy          Conwy                16              57.6              76

 Clawddnewydd    Clwyd         Denbighshire         16              50.6              61

 Brynhyfryd      Clwyd         Denbighshire         15              38.4              72
       Table 2 – Rainfall data recorded on NRW’s Hydrometric Network during Storm Ciara

During Storm Dennis:

   •   Tyn Y Waun gauge at the top of the Rhondda Fawr catchment received 132.4mm
       of rainfall in 24 hours, the equivalent of 62% of an entire month’s rainfall in a single
       day2

   •   Nant yr Ysfa gauge situated between the Cynon and Rhondda Fach catchments
       received 130.4mm of rainfall in 24 hours, the equivalent of 72% of an entire month’s
       rainfall in a single day2

   •   Carno gauge in the Usk Catchment received the equivalent of half a month’s rainfall
       in 12 hours - 68mm of rain - and the equivalent of an entire month’s rainfall in 36
       hours - 128 mm of rain2

   •   Crai gauge in the Usk Catchment received the equivalent of half a month’s rainfall
       in 12 hours - 87mm of rain - and the equivalent of 85% of an entire month’s rainfall
       in 72 hours - 170mm of rain2

   •   Tafalog gauge in the Wye Catchment received the equivalent of half a month’s
       rainfall in 18 hours - 60mm of rain - and the equivalent of 85% of an entire month’s
       rainfall in 72 hours - 88mm of rain2

                                                                                           Page 7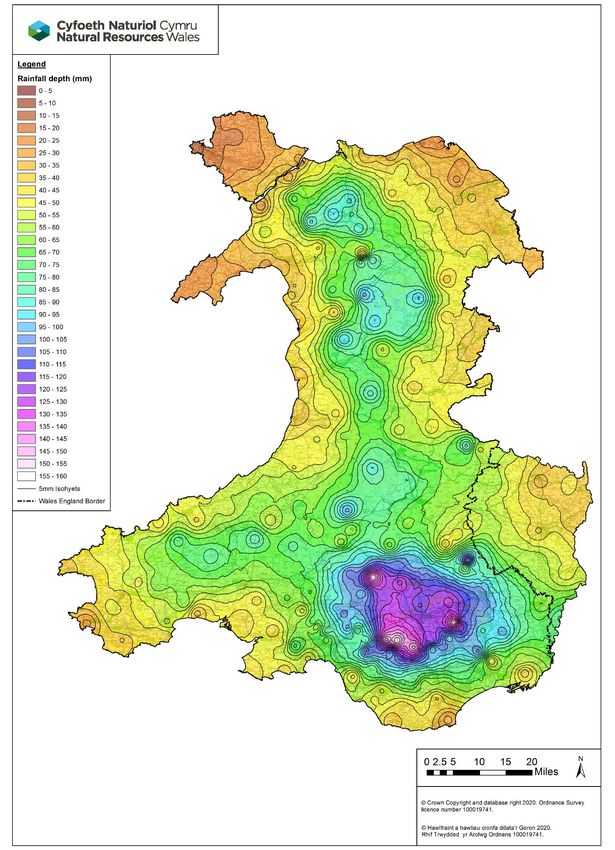
Time % of Feb
Local Rainfall within
Rain gauge Catchment period LTA rainfall
Authority duration (mm)
(hours) (1981-10)
Crai Usk Powys 24 136.6 69
Tyn Y Waun Taff RCT 24 132.4 62
Nant yr Ysfa Taff RCT 24 130.4 72
Hirwaun Tawe RCT 24 119.8 75
Neath Port
Croeserw Afan 48 117.2 n/a
Talbot
Storey Arms Usk Powys 24 116.6 63
Carno Usk Blaenau Gwent 24 115 89
Ystradfellte Tawe Powys 24 111.4 62
Cwmtillery Usk Blaenau Gwent 24 108.2 95
Ponsticill Taff Merthyr Tydfil 24 103.8 73
Ciloerwynt Wye Powys 24 78 51
Tafalog Wye Monmouthshire 24 74.2 73
Bleddfa Wye Powys 36 73.6 78
Gowerton Loughor Swansea 24 71 73
Abernant Wye Powys 24 69.4 53
Machen
Rhymney Caerphilly 24 67.4 65
Waterloo
Pant Mawr Wye Powys 24 66.8 32
Upper Lliw Loughor Swansea 24 65.2 53
Bwlch y
Wye Powys 24 51 61
Sanau
Table 3 – Rainfall data recorded on NRW’s Hydrometric Network during Storm Dennis
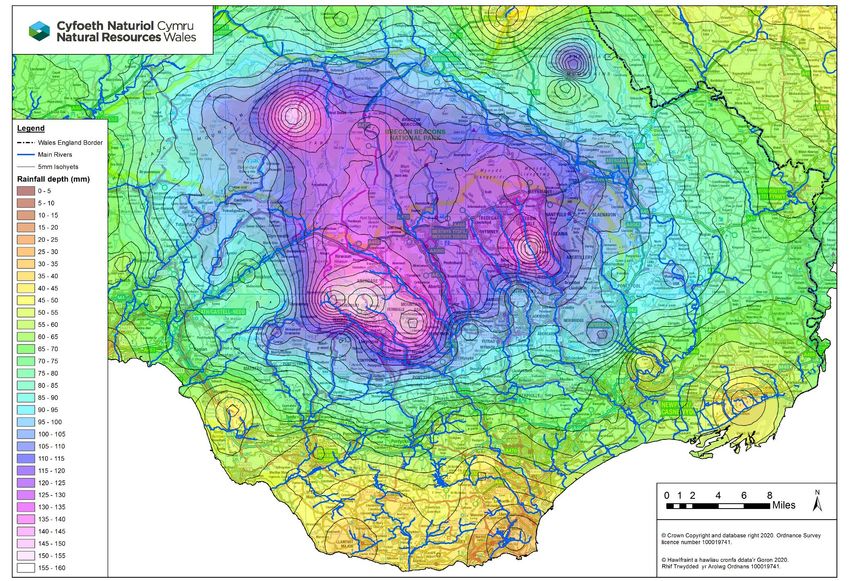
Figures 2, 3, 4 and 5 below illustrate the distribution of rainfall during Storm Ciara and
Storm Dennis, highlighting the significant rainfall totals within a 48-hour period in areas of
Wales. Storm Ciara led to heavy rainfall over Snowdonia and particularly the headwaters
of the River Conwy. Storm Dennis produced extreme rainfall across the top of the South
Wales Valleys and Brecon Beacons with a particular focus on the River Rhondda
Catchment and high up within the River Usk Catchment.
Page 8Figure 2 – Rainfall Isohyet Map showing rainfall over a 48-hour period during Storm Ciara
Page 9Figure 3 – Rainfall Isohyet Map showing rainfall over a 48-hour period during Storm Ciara in North Wales
Page 10Figure 4 – Rainfall Isohyet Map showing rainfall over a 48-hour period during Storm Dennis
Page 11Figure 5 – Rainfall Isohyet Map showing rainfall over a 48-hour period during Storm Dennis in South Wales
Page 12Figure 6 below, from the Met Office, demonstrates the significant combined rainfall totals
experienced in Storm Ciara and Storm Dennis. It also allows comparison to the events
experienced across the rest of the UK during this period.
Figure 6 – Total Rainfall amounts experienced during Storm Ciara and Dennis in the UK
Source: Met Office
Page 13River Levels and Flows
Across the network of 231 NRW river gauging stations in Wales, 51 (or 22%) recorded the
highest ever levels during Storm Dennis. Two record river levels were also set during
Storm Ciara (1%).
Many rivers in Wales, particularly in the South Wales Valleys and parts of North Wales, are
relatively steep and flow through narrow valleys that are underlain by impermeable
geology. As a consequence, runoff from headwaters rapidly reaches main rivers, and river
levels respond quickly following intense rainfall. In a matter of hours, they rose from normal
river levels to some of the highest on record. Due to this impermeable geology and the
limited amount of groundwater, there is little in the way of base flow, which means when
the rainfall ceases, river levels recede quickly. Figures 7, 8 and 9 below highlight how
quickly river levels rose in some catchments during both storms in just a few hours, they
also show how quickly the levels then fell.
For steep catchments, this rapid response to rainfall limits the time available to issue
warnings. The volume and force of water associated with these water depths make them
particularly dangerous.
In contrast, for large river systems, such as the River Wye with flatter gradients, wider
flood plains and deeper soils, the system has a much longer rise to peak over the course
of several days (Figure 10). Here, runoff is slower and flooding is more prolonged due to
the contribution of base flow.
Estimating flow rates from river levels is not straightforward, particularly for extreme flows
where there is little or no historic data. The data presented here is based on industry
standard approaches but may be subject to change given further analysis.
Page 14Figure 7 – River level records for River Conwy at Pont Fawr, Llanrwst during Storm Ciara
Figure 8 – River level records for River Elwy at Pont y Gwyddel, upstream of St Asaph during
Storm Ciara
Page 15Figure 9 – River level records for River Taff at Pontypridd during Storm Dennis
Figure 10 – River level records for River Wye at Monmouth during Storm Dennis
During Storm Ciara:
River levels responded quickly to the heavy rain falling across much of North Wales, in
particular the River Conwy and River Elwy catchments which reached high levels and
experienced flooding in some locations.
• On the River Elwy, Pont Y Gwyddel gauging station reached its highest level since
the start of records in 1974. The peak at Pont Y Gwyddel (3.652m) exceeded the
November 2012 peak by 17cm. The Elwy at this location was flowing at an
estimated 220 cubic metres (or tonnes) of water per second (m3/s).
Page 16• Unfortunately, the level gauge at St Asaph failed and missed the peak. However,
onsite observations both during and after the event suggest the peak at St Asaph
was in excess of 4.8m, the highest on record and consistent with the upstream data
from Pont y Gwyddel. Despite reaching those levels, widespread flooding in St
Asaph was largely avoided due to the flood alleviation scheme constructed by NRW
following the November 2012 floods.
It is estimated that river levels and flows on the River Elwy were potentially equivalent to a
1:200 flood (0.5% chance in any one year of an event of this scale happening). Table 4
below provides further high river levels of note experienced during Storm Ciara.
Peak
Peak Peak
Gauging Date/Time of stage Record
River stage Flows
Station peak historical Start
(m) (m3/s)
ranking
Pont y Gwyddel Elwy 09/02/2020 11:30 3.652 1 220 1974
Gauge failed, but likely the highest peak on record,
St Asaph Elwy 09/02/2020 15:30 exceeding the previous maximum of 4.352m in Nov
2012
Ruthin Weir Clwyd 09/02/2020 16:30 1.129 3 22.7 1971
Pont y Cambwll Clwyd 10/02/2020 00:15 2.792 6 59.3 1973
Cwmlanerch Conwy 09/02/2020 10:15 4.729 4 544 1964
Pont Fawr Conwy 09/02/2020 11:30 8.406 7 - 1999
Beddgelert Glaslyn 09/02/2020 08:30 2.15 5 117 1967
Druid Alwen 09/02/2020 10:30 2.176 5 131 1970
Brynkinalt Weir Ceiriog 09/02/2020 12:30 1.449 3 52.6 1971
Manley Hall Dee 09/02/2020 20:15 2.816 8 363 1969
Table 4 – River level and flow data recorded on NRW’s Hydrometric Network during Storm Ciara
(the peak flow values for some stations are estimates based on modelled data, level and flow data may be
subject to change following further validation work)
During Storm Dennis:
Across South Wales, rivers responded quickly to the rainfall falling across already
saturated catchments. Record levels were recorded across most catchments in the South
Wales valleys and further north in the River Usk and Wye.
• At Pontypridd, the River Taff reached its highest level since records began in 1968.
At its peak flow it is estimated that 805 m3/s were passing through Pontypridd,
enough to fill an Olympic size swimming pool in just over three seconds or
alternatively the equivalent of 600 average sized cars per second. The river level
was 78cm higher than the previous highest level set during the 1979 floods.
• The River Taff at Pontypridd went from an estimated flow of 55 m3/s at 7:00am on
15 February, in relatively normal conditions, to a peak flow estimated at 805 m3/s in
just 22 hours during Storm Dennis - an increase of 4.2m in height by 4:45am on 16
February.
Page 17• Between 10:15pm (15 Feb) and its peak in Pontypridd at 4:45am (16 Feb), the
River Taff went from an estimated 405 m3/s to the peak of 805 m3/s, it therefore
nearly doubled in flow in just 6.5 hours and increased in height by 2m.
• Along the River Usk, the highest levels were logged at Brecon, Crickhowell,
Llanfoist and Usk since records began in 2013, 2005, 1994 and 2000 respectively.
At Llandetty and Chainbridge, stations recorded the second highest levels behind
the 1979 floods.
• At Monmouth, the River Wye peaked 67cm higher than the previous record set in
2002. Further downstream at Redbrook, the River Wye is estimated to have been
flowing at 925 m3/s. This was the highest flow on record since they began in 1969.
Table 5 below highlights many of the river level gauges which set new records during
Storm Dennis. Peak levels and flows during Storm Dennis were higher than the significant
flood events that impacted the South Wales Valleys and Cardiff in December 1979 and
October 1998.
Peak
Peak Peak
Date/Time of stage Record
Gauging Station River stage Flows
peak historical Start
(m) (m3/s)
ranking
Tynewydd Rhondda Fawr 16/02/2020 02:45 1.624 1 38 2001
Trehafod Rhondda 16/02/2020 04:00 3.977 1 258 1983
Aberdare Cynon 16/02/2020 03:00 2.125 1 121 1989
Abercynon Cynon 16/02/2020 07:00 3.067 1 211 1961
Merthyr Tydfil Taff 16/02/2020 03:15 2.811 1 205 1978
Fiddlers Elbow Taff 16/02/2020 04:00 3.368 1 427 1973
Pontypridd Taff 16/02/2020 04:45 5.324 1 805 1968
Upper Boat Taff 16/02/2020 05:30 5.489 1 - 2001
Tongwynlais Taff 16/02/2020 07:30 5.085 1 - 1999
Western Avenue Taff 16/02/2020 08:00 4.843 1 720 1999
Bargoed Rhymney 16/02/2020 03:30 2.298 1 116 1988
Waterloo Bridge Rhymney 16/02/2020 06:45 3.352 1 - 1989
Llanedeyrn Rhymney 16/02/2020 10:45 3.726 1 143 1982
Aberbeeg Ebbw 16/02/2020 04:00 1.819 1 76 1975
Ynysddu Sirhowy 16/02/2020 04:30 2.498 1 - 2000
Risca Ebbw 16/02/2020 04:45 3.517 1 - 1987
Rhiwderin Ebbw 16/02/2020 06:15 3.089 1 198 1957
Pontnewynydd Lwyd 16/02/2020 03:15 1.690 1 - 2000
Ponthir Star Lwyd 16/02/2020 05:30 2.733 1 - 2007
Brecon Promenade Usk 16/02/2020 00:45 4.117 1 - 2013
Crickhowell Usk 16/02/2020 02:30 4.508 1 - 2005
Llanfoist Bridge Usk 16/02/2020 09:15 5.614 1 - 1994
Usk Town Usk 16/02/2020 13:15 5.797 1 - 2000
Grosmont Monnow 16/02/2020 07:00 4.630 1 220 2009
Mitchel Troy Trothy 16/02/2020 07:30 4.296 1 - 1981
Page 18Peak
Peak Peak
Date/Time of stage Record
Gauging Station River stage Flows
peak historical Start
(m) (m3/s)
ranking
Disserth Wye 16/02/2020 11:00 3.469 1 155 1968
Builth Wells Wye 16/02/2020 08:30 5.045 1 - 1988
Glasbury Wye 16/02/2020 08:45 4.083 1 - 1988
Hay on Wye Wye 16/02/2020 13:00 5.066 1 - 1988
Monmouth Wye 18/02/2020 08:30 7.146 1 - 1992
Redbrook Wye 18/02/2020 08:45 7.681 1 925 1936
Dutlas Teme 16/02/2020 03:15 2.535 1 - 2006
Knighton Teme 16/02/2020 06:15 2.852 1 102 2002
Login Taf 16/02/2020 02:45 3.365 1 104 1999
Glasfryn Ford Taf 16/02/2020 05:00 2.179 1 - 1982
Llandybie Loughor 16/02/2020 02:30 1.405 1 - 2011
Teddy Bear Bridge Tawe 16/02/2020 02:00 2.947 1 167 2000
Ystradgynlais Tawe 16/02/2020 01:45 2.262 1 - 2013
Glyn Neath Neath 16/02/2020 03:00 4.236 1 - 2012
Ynys Fach Bridge Neath 16/02/2020 03:00 1.227 1 - 2007
Resolven Neath 16/02/2020 05:15 3.287 1 529 1978
Cilfrew Neath 16/02/2020 03:15 1.988 1 107 1972
Felindre Road Ewenny 16/02/2020 05:15 1.971 1 33 1999
Table 5 – River level and flow data recorded on NRW’s Hydrometric Network during Storm Dennis
(Some stations were known to fail as in some case they were overwhelmed, recorded peaks may therefore
have been higher in some instances, the peak flow values for some stations are estimates based on
modelled data, level and flow data may be subject to change following further validation work)
Figure 11 below highlights the record levels set during the autumn and winter period
across NRW’s hydrometric river level gauge network. Across a network of 231 river
gauging stations, 63 (27%) recorded their highest levels on record between September
2019 and February 2020. Further, 55% of the gauges have recorded their highest ever
levels within the last ten years.
Figure 12 below highlights the wide scale spread of these records being set during Storm
Dennis. It is estimated that the lower River Taff experienced the equivalent of a 1:200 flood
(0.5% chance in any one year of an event of this scale happening) event storm, whilst the
River Ebbw is likely to have been a 1:40 event storm and the River Usk in some locations
of the upper catchment experiencing a 1:90 event storm.
It is clear from this section, and the previous, that there were exceptional levels of rain that
caused record-breaking river levels in many locations. Plus, extreme events are becoming
more frequent, and therefore we need to be prepared for more in the future.
Page 19Figure 11 – River level records set across the NRW Hydrometric Network
Page 20Figure 12 – River level records set during Storm Dennis
Page 21Raising Awareness and Warning
An important part of the role that NRW plays is to make other responders and the public
aware that an event is coming and that they need to take action. The system is multi-
layered; no one approach is perfect, but by adopting a number of complementary
approaches, we aim to maximise the number of people who are aware of, and prepared
for, a possible approaching event.
The system begins with early warnings from the Met Office and NRW to trigger increased
readiness among other organisations and give the public advance warning that a flood
event may be coming. These advance warnings are disseminated by a range of means,
including traditional and social media, weather reports, press briefings and the five day
flood forecast on the NRW website.
As the event becomes more imminent, direct flood warnings are issued for designated
flood risk areas.
Throughout the process, we utilise traditional and social media, the internet and our
websites to both raise awareness of current risks, as well as encourage the public and our
partners to take the actions they can to protect themselves and their properties.
Flood Forecasting
An extremely important element of managing the impacts of weather events, such as those
experienced in February, is the ability to forecast rainfall more accurately and further into
the future. This is an area that has seen significant enhancement and development in
recent years and NRW works with the Flood Forecasting Centre (FFC) (a partnership
between the Met Office and Environment Agency) to analyse the latest forecast
information. Together, NRW and the FFC assess the weather forecast and flood risk in
Wales, summarising the information in the daily Flood Guidance Statement (FGS). The
FGS goes to local authorities and emergency responders and is also replicated on NRW’s
website. It serves as an early warning and allows organisations to prepare for possible
impacts.
Figures 13 to 15 are taken from the FGSs issued in the lead up to and during Storm Ciara
and Storm Dennis. The content of the specific FGSs highlight the areas forecast to be
impacted by each storm and the forecast impact and likelihood in each case. Figure 14
shows the build-up to Storm Dennis in more detail and that stormy weather was being
forecast five days prior (Tuesday 11 February), and that the signals for significant impacts
increased on the Thursday (13 February). This did help partner organisations prepare
since moving to ‘Medium’ risk is a relatively rare occurrence that acts as a trigger for
action. The FGS issued on Saturday 15 February indicated severe impacts but remained
at ‘Medium’ status due to the forecast likelihood. However, the overall flood risk only went
to the ‘High’ risk (indicating a high likelihood of severe impacts) on the Sunday morning.
Page 22Figure 13 below, is taken from the FGS from the morning of the 8 February in advance of
Storm Ciara. Whilst only showing ‘Low’ risk for much of Wales the forecast of ‘Significant’
impacts for ‘Risk Area A’ should be noted albeit highlighted at ‘Low’ likelihood at this stage
in the weather event.
Figure 13 – Content from Flood Guidance Statement Issued on Saturday 8 February at 10:30am
Source: Flood Forecasting Centre
Page 23Flood Guidance
Statement
issued on:
Tuesday 11 Feb
Wednesday 12 Feb
Thursday 13 Feb
Friday 14 Feb
Saturday 15 Feb
Sunday 16 Feb
Figure 14 – Five day forecast summary from Flood Guidance Statements leading up to and during
Storm Dennis (taken from daily 10:30am updates)
Source: Flood Forecasting Centre
Page 24Figure 15 below shows content from the Flood Guidance Statement from the morning of
the 15 February, when Storm Dennis was beginning to impact Wales. The severe impacts
forecast for much of South Wales should be noted in ‘Risk Area A’, although this was also
highlighted at a ‘Low’ likelihood at this stage in the weather event, giving the overall flood
risk status as ‘Medium’.
Figure 15 – Content from Flood Guidance Statement Issued on Saturday 15 February at 10:30am
Source: Flood Forecasting Centre
Whether the likely severity of actual events are sufficiently represented on the overall
status of the FGS, whilst recognising there are inherent uncertainties in forecasts, will be
considered as part of the wider review work identifying lessons from these events.
Page 25Flood Warnings
In terms of flood warnings, Storm Dennis is the biggest fluvial event NRW has
experienced. The previous highest total of warnings issued came in January 2014, when
Wales experienced significant coastal flooding. More Severe Flood Warnings were issued
in the specific 2014 event, but the same number of flood warnings were issued in both
events.
Flood Severe Flood
Flood Event Flood Alerts Total
Warnings Warnings
Storm Ciara 52 29 2 83
Storm Dennis 65 89 4 158
Storm Jorge 47 27 0 74
Unnamed events in
February 2020
79 36 0 115
(including the weekend
of 21st – 24th)
Total issued in
243 181 6 430
February 2020
1st-6th January 2014
43 89 6 138
Coastal Event
Monthly average since
36 8 0 44
2005
Table 6 – Number of Flood Warnings and Alerts issued in Wales
February 2020 has been the busiest period for Flood Warnings and Alerts in Wales since
the system took its current format in 2005. To enable accurate and timely warnings, a
significant amount of effort and expert knowledge is required. This includes the expertise
of flood forecasting in the days leading up to an event, as well as real time monitoring and
analysis that was undertaken by Flood Warning Duty Officers responsible for issuing
warnings and providing the latest updates to professional partners. All of this is supported
by NRW’s network of rainfall and river level hydrometric gauges and operational workforce,
who are out on the ground performing manual monitoring and checks.
Figures 16 – 21 below highlight the volume, distribution and impact of the Flood Warnings
being issued. Note, like the river levels themselves, figures 16 and 17 show the extremely
short time frame within which Flood Warnings were issued. Whilst a record number of
warnings were issued during this time period (158 in total during Storm Dennis), in the
rapidly escalating events that occurred during Storm Dennis, some flood warnings were
issued late (after the onset of flooding) or not issued at all. The best available data shows
that three warnings were issued late in the Lower Taff Valley, three late in the Teifi Valley,
11 warnings were not issued in the Rhymney Valley, and one was not issued on the River
Towy. This is clearly below desired performance levels; our systems were overwhelmed
during periods of peak demand and improvements to managing the risk of this happening
again are being identified.
It is estimated that at the beginning of February 2020 over 126,000 properties were
registered to receive flood warnings in Wales.
Page 26• During Storm Ciara, of the 9,838 properties registered in relevant areas to receive
the warnings, 92% were successfully contacted, with 14,491 customers reached.
• During Storm Dennis, of the 15,272 properties registered in relevant areas to receive
the warnings, 79% were successfully contacted, with 19,476 customers reached.
• During Storm Jorge, of the 5,615 properties registered in relevant areas, 86% were
successfully contacted, with 7,768 customers reached.
• Overall, during the whole of February 2020, of the 38,996 properties registered in
relevant areas, 86% were successfully contacted, with 55,784 customers reached.
Successful contacts include answered telephone calls and received email and text
messages. Thus, success is related to the message being received, and not just sent.
Figure 16 – Flood Warnings and Alerts in force in Wales during Storm Ciara
Page 27Figure 17 – Flood Warnings and Alerts in force in Wales during Storm Dennis
Page 28Figure 18 – Flood Warnings issued during Storm Ciara
Page 29Figure 19 – Flood Warnings issued during Storm Dennis
Page 30Figure 20 – Number of customers issued with Flood Warnings during Storm Ciara
Page 31Figure 21 – Number of customers issued with Flood Warnings during Storm Dennis
Page 32Communications and Social Media
Storms Ciara and Dennis generated 499 articles in a wide range of media outlets which
were supported by NRW communications. These included coverage in almost all of the
major print and online news outlets - some of this coverage extended globally, even
reaching news outlets in the USA. NRW staff gave 42 media interviews, appearing multiple
times across Welsh and UK broadcast outlets.
Storm Dennis in particular generated a very high level of media interest and a huge surge
in the number of people looking for more information about the flooding, the warnings
being issued and seeking updates on the latest situation.
Over the period of 14 to 18 February 2020, during Storm Dennis, over 164,000 users
visited the NRW website, with over 577,000 unique page views. At the peak of Storm
Dennis on the 16 February, over 84,000 users visited the website, more than double the
number that visited during Storm Callum (October 2018). The top five pages visited on the
NRW website during this period were:
• Check flood warnings – information regarding the latest status of warnings
• Five day flood forecast – the flood guidance statement issued daily
• Check river levels – live data from our river level hydrometric network
• What to do before, during and after a flood – information to help develop resilience
• Long term flood risk maps – maps highlighting areas at risk of flooding
During February 2020, the number of views of the “Check flood warnings” page was 13
times higher (over 615,000) than the usual monthly page views on the English version of
the NRW website and 26 times higher (nearly 7,000) than the monthly average on the
Welsh version. The volume of hits on our website contributed to some network problems,
and the website did go down twice at critical times for short periods. This is being
reviewed and addressed.
Over 1,900 calls were received by the Floodline interactive voice service over the 15 and
16 February, as well as 397 calls directly to Floodline agents. This service provides further
information to the public regarding flood warnings and other information regarding flood
risk management.
NRW’s Incident Contact Centre received 659 calls between the 14 and 18 February and
dealt with over 800 alarms triggered by the rain and river level gauges on the Hydrometric
network. Between the 14 and 27 February, NRW’s Customer Contact Centre received 63
calls, 120 emails and 16 enquiries relating to the flooding from members of the public. The
three main themes from these queries related to flood defences, incident management and
flooding advice.
NRW reached 5.7 million people through its social media channels on Twitter and
Facebook, with 3,300 users sharing posts issued by NRW. During February 2020, NRW
obtained 4,780 new followers on Facebook, 2869 on Twitter and 191 on Instagram. NRW
received 2,412 messages through Facebook and Twitter during this period.
Page 33Impacts
The impacts of the extreme rainfall and subsequent rapid increases in river levels led to
significant impacts across Wales during the entire month of February 2020. Flood water
poses a high risk to life and can devastate homes, businesses and communities; affected
areas and properties will take a long time to recover.
Flooding often occurs from a range of sources and this means that managing and reducing
flood risk is complex. There are many organisations responsible for managing flood risk in
Wales. Their roles and responsibilities can be summarised as follows:
• NRW has powers to manage flooding from main rivers (typically the larger rivers in
Wales), the sea, and reservoirs they operate.
• Lead Local Flood Authorities, the 22 Local Authorities in Wales, manage flooding
from ordinary watercourses (smaller watercourses), surface water and groundwater.
They also carry out coastal protection work in response to coastal erosion.
• Water companies in Wales manage flooding from water and sewerage systems.
• Highway authorities in Wales manage the drainage of highways.
The causes and mechanisms of specific flood instances can require detailed investigative
work to understand. Given the extent of these events, it is likely to take some time before
all of the sources and mechanisms of flooding in February have been fully understood. All
Risk Management Authorities across Wales are working to deliver this and are considering
potential future measures that need to be taken.
Flooding has a very significant negative and lasting impact on people’s mental and
physical wellbeing, their homes and their businesses. It also has noteworthy impacts on
the wider infrastructure that all communities rely on. During February 2020 widespread
impacts were seen across the railway and road networks, as well as utility provision
including gas, electricity and drinking water. Whilst this report does not address these
impacts (these will be covered in the Local Authority and Water Company reports), it is
noted that significant disruption was evident across all of these wider elements of
infrastructure, with many bridges, for example, still out of use.
The data in Table 7 below gives an overview of the impacts to properties across Wales
from all sources of flooding during the named storm events. This information has been
collated from a combination of NRW survey work and submissions from the Welsh
Government, Local Authorities and the Welsh Local Government Association. It reflects
the current understanding at the point of publishing this report, however, this is subject to
change as more information and further impacts are identified. This report is based on
information available at the end of July 2020.
Storm Dennis was one of the most significant weather events to hit Wales in over a
generation. The other most notable flooding in Wales was during the winter storms of
2013/14 (305 properties flooded), October 1998 (750 properties flooded) and December
1979 which brought impacts across Mid and South Wales and flooded over 3,000
properties in Cardiff alone.
Page 34Storm Storm Storm February
Local Authority Area
Ciara Dennis Jorge Total
Blaenau Gwent County Borough Council 0 125 0 125
Bridgend County Borough Council 0 16 13 29
Caerphilly County Borough Council 0 203 0 203
Carmarthenshire County Council 2 63 0 65
Cardiff Council 0 21 5 26
Ceredigion County Borough Council 1 3 0 4
Conwy County Borough Council 172 0 0 172
Denbighshire County Borough Council 23 0 0 23
Flintshire County Council 0 20 0 20
Gwynedd Council 10 0 0 10
Isle of Anglesey Council 6 0 0 6
Merthyr Tydfil County Borough Council 0 225 0 225
Monmouthshire County Borough Council 0 215 11 226
Neath Port Talbot County Borough Council 0 88 3 91
Newport City Council 0 11 0 11
Pembrokeshire County Council 0 0 0 0
Powys County Council 0 232 0 232
Rhondda Cynon Taf County Borough Council 10 1,476 90 1,576
Swansea 0 45 0 45
Torfaen County Borough Council 0 21 0 21
Vale of Glamorgan County Council 0 1 19 20
Wrexham County Borough Council 0 0 0 0
Storm Totals 224 2,765 141 3,130
Overall February Total 3,130
Table 7 – Properties flooded in Wales
(based on best available evidence)
Properties known to have flooded include 224 properties during Storm Ciara, 216 being
households and eight non-residential. During Storm Dennis, 2,765 properties flooded,
including 2,200 households and 565 non-residential properties. During Storm Jorge, 141
properties flooded, of which 111 were households and 30 were non-residential. The
distribution of these impacts is shown in Figures 22 and 23 below.
Overall economic damages are difficult to calculate given the scale and diversity of the
impacts of flooding on properties and infrastructure. However, the Association of British
Insurers estimates the average household flood claim to be £32,000 3. Therefore, given an
estimated 2,527 households flooded during February 2020, the flood damage to household
property alone is estimated to be £81 million. This will not include the substantial economic
costs felt by businesses, other non-residential properties and infrastructure across Wales.
3
Association of British Insurers 2020, Insurance pay outs to help customers recover from Storms Ciara and Dennis set to top £360
million, viewed June 2020, < https://www.abi.org.uk/news/news-articles/2020/03/insurance-pay-outs-to-help-customers-recover-from-
storms-ciara-and-dennis-set-to-top-360-million >
Page 35Figure 22 – Properties flooded during February 2020
Page 36Figure 23 – Properties flooded during February 2020 in South Wales
Page 37Areas protected
Whilst NRW defences overtopped in a number of locations or properties behind them
flooded from other flood sources, importantly they did not fail, which would have resulted in
even more widespread flooding. Our defences are built to provide industry-standard levels
of protection, typically to hold back water levels in a 1% chance event. Given that
defences were overtopped in places, however, calls into question whether this standard of
protection is sufficient for the future. It could be concluded that defences should be built
higher, but this often has the effect of pushing water further downstream to the next
community. If this is done down a whole river, then the defences at the lower end will
need to be significantly higher than they are now. This raises concerns over feasibility and
acceptability, as well as the potentially greater risk to people and communities if those
defences structurally fail.
Also, with the increasing frequency of extreme weather events, a defence that was built
with a 1 in 100 standard of protection 10 years ago will provide a lower level of protection
today. This reflects the fact that river levels associated with particular likelihoods of
flooding are also changing. It is a moveable feast, depending on the rate of climate
change. Our designs take into account the UK climate change predictions published
periodically by the Met Office Hadley Centre Climate Programme, but the pace of climate
change and the uncertainty around it make this challenging. As the height of defences is
increased, there is an additional cost and impact on the local environment. Also, to
maintain structural stability, higher defences need wider bases, but there may not be
available space sufficient for this construction. Maintenance costs also increase and this
raises further questions for consideration.
Despite the inevitable focus on areas that flooded, significant numbers of properties
benefitted from flood defences during the February 2020 events. Overall in Wales, it is
estimated that over 73,000 properties benefit from a 1:100 standard of protection provided
by NRW owned and maintained flood defences 4.
During Storm Ciara, it is estimated that the river levels in St Asaph on the River Elwy were
higher than in November 2012 when significant flooding was experienced. On the whole,
the newly constructed NRW flood alleviation scheme, built to protect 293 homes and 121
businesses in the city, performed well and prevented a repeat of the events of 2012. The
impacts of flooding in Llanrwst on the River Conwy could also have been much worse
without the successful deployment of NRW demountable defences, which prevented
flooding from the River Conwy.
Given the record high river levels experienced during February 2020, peak flows during
Storm Dennis in particular were larger than the events which hit Wales in 1998 and 1979.
However, in terms of impact, the events of February 2020 were lower than those
experienced in 1979 which bought widespread devastation across many communities in
Mid and South Wales - flooding 3,000 properties in Cardiff alone. This level of property
flooding experienced was not the case in February 2020, despite higher river levels in
some cases, which reflects the significant investment into flood alleviation schemes and
flood warning services in the decades since.
4
1 in 100 standard of protection would be expected to protect the defended area behind the defence from all floods up to and including
the 1 in 100 (1% chance in any one year of an event of this scale happening) flood event.
Page 38Using estimates of the hydrological scale of flooding experienced in February 2020, the
available information on the performance of NRW flood defences, and the latest flood risk
modelling data, analysis has been undertaken to understand the number of properties that
benefitted from NRW defences during Storm Dennis. This analysis is built on a number of
assumptions but demonstrates the potential severity of the event without these defences in
place.
Across the rivers in South Wales that were impacted by Storm Dennis an estimated 19,000
properties benefitted from NRW flood defences. Notably, the analysis shows over 10,000
properties in Cardiff were likely to have flooded without the presence of NRW defences.
Significant numbers also benefitted in the catchments of the Rivers Ebbw, Sirhowy and
Afan.
Using estimates from the Association of British Insurers, which place an average
household claim at £32,0003, and based on an approximate 17,000 households benefitting
from flood protection during Storm Dennis, the flood damage avoided to household
property alone is estimated at over £550 million. This demonstrates the significant value of
the investment made in flood defences.
Page 39Figure 24 – Properties that benefitted from NRW defences during Storm Dennis
Page 40Next steps and conclusions
The flooding events experienced across large parts of Wales in February 2020 were
devastating for many communities, and in many cases, it will take months, if not years, to
recover. It is an unwelcome reminder of the power of nature, and evidence from climate
scientists suggests that we will see more extreme weather events in the future.
NRW is taking the events of February 2020, and the impact it has had on individuals and
communities, extremely seriously. Flooding is traumatic and has long-term effects on
people and communities, both physically and mentally.
NRW is progressing flood investigation work at a local scale, seeking to better understand
and determine what happened and why. We will review what further work is possible to
reduce the risk of the impacts of the February 2020 floods happening again.
Local Authorities in Wales, where relevant, will produce Section 19 reports under the Flood
and Water Management Act (2010) 5. This legislation requires Local Authorities to
investigate the causes of flooding in their authorities. NRW is working with Local
Authorities to make these as effective as possible. These reports will conclude local
investigations into flooding that occurred and will potentially determine further action for the
relevant Risk Management Authorities.
After every significant flood incident, NRW carries out recovery and review work to ensure
that our organisation is not only ready to respond to the next event when it occurs, but that
we learn lessons and continue to improve our service. Following the events of February
2020, NRW has been undertaking substantial recovery works. This includes 2,241
inspections of flood defences which have resulted in 77 planned repairs to those impacted
by the floods.
NRW is also undertaking a thorough performance review of its systems, procedures, tools
and ways of working to identify potential areas for improvements. This will heavily focus on
the operation of the Flood Warning Service, our operational response, and our work
immediately after the events such as recovery work. It will also cover the performance of
our communications and ICT services. We know there are areas where our services were
stretched, and where there were weaknesses and errors in systems. We need to learn
from these and understand what we can do to lessen the chances of this happening again.
The rainfall distribution highlighted by this report also demonstrates the highly specific
areas which received extreme amounts of rainfall in different storm events, reinforcing that
this can happen in any community. The geography of Wales means that a significantly
different set of communities would have been impacted if the rainfall had fallen, say, ten
miles in a different direction.
These are some of the challenges that Wales faces. NRW, alongside other Risk
Management Authorities and professional partners, will continue to invest in people,
technology, infrastructure, systems and processes to undertake flood risk management.
5
Flood and Water Management Act 2010, c.29. Available at: http://www.legislation.gov.uk/ukpga/2010/29/section/19
(Accessed: 12 June 2020).
Page 41However, the impact of climate change is something that will require all of us to think
collectively about our response and the need for adaptation in order to cope with the
challenges of the future.
Page 42You can also read