Devastating Storm Surges of Typhoon Yolanda
←
→
Page content transcription
If your browser does not render page correctly, please read the page content below
Project NOAH
                Open-File Reports                                             Vol. 3 (2014), No.6, pp. 45-56, ISSN 2362 7409

                          Devastating Storm Surges of Typhoon Yolanda
Alfredo Mahar Francisco Lagmay (1,2) and the Project
      NOAH Storm Surge Component Team (2)                          1. INTRODUCTION
(1)National Institute of Geological Sciences, University          Typhoon Yolanda is one of the most powerful typhoons
        of the Philippines-Diliman, Philippines,                  to have made landfall in recorded history, with
  (2)Nationwide Operational Assessment of Hazards,                maximum sustained winds reaching 315 kph (170 knots)
        Department of Science and Technology                      with gusts up to 379 kph (205 knots) just before landfall
                Quezon City, Philippines                          (JTWC, 2013). This makes it equivalent to a Category 5
                                                                  typhoon on the Saffir-Simpson hurricane scale (NOAA,
                                                                  2013a), which has the capacity to cause catastrophic
                                                                  damage, high percentage of destruction of framed
                                                                  homes, total roof failure and wall collapse, isolation of
Abstract— On 8 November 2013, Typhoon Yolanda,                    residential areas due to fallen trees and power poles, and
international code name Haiyan, made landfall in the              power outages that could last for weeks and possibly
central Philippine islands region. Considered one of the          months (NOAA, 2013c).
most powerful typhoons ever to make landfall in
recorded history, the 600 km-diameter typhoon Yolanda             It started as a region of low pressure in the West Pacific
crossed the Philippine archipelago, bringing widespread           Ocean early on 02 November 2013 and was upgraded to
devastation in its path. Strong winds, heavy rainfall, and        a tropical storm (TS) with the name Yolanda after
storm surges caused extreme loss of lives and                     subsequent intensification (WMO, 2013). Upon entry of
widespread damage to property. Storm surges were                  the typhoon into the Philippine Area of Responsibility
primarily responsible for the 6,190 dead, 1,785 missing           (PAR), the Philippine Atmospheric Geophysical
and 28,626 injured in Yolanda's aftermath. Here, we               Astronomical Services Administration (PAGASA), gave
document the analysis made on storm surges spawned by             it a local name of Yolanda (PAGASA, 2013). Regular 6
typhoon Yolanda as basis for the warnings provided to             hourly bulletins on the severe weather disturbance were
the public 2 days prior to the howler's landfall. We then         issued by the Philippine weather bureau with short
validate the accounts based on field data and accounts            updates given every hour. Typhoon Yolanda made
provided in the news. The devastating Yolanda storm               landfall in Guian, Eastern Samar on 09 November 2013
surges are one of the biggest storm surge events in               at 0440H local time (Figure 1).
several decades, which exacted a high death toll despite
its early prediction. There were many lessons learned             By 07 November, storm signal warnings had been raised
from this calamity and information contained in this              by PAGASA, including storm surge warnings in many
work may serve as useful reference to mitigate the heavy          parts of the country. Typhoon Yolanda hit the eastern
impact of future storm surge events in the Philippines            part of the Philippines on 08 November, following a
and elsewhere.                                                    track heading towards the West Philippine Sea (South
                                                                  China Sea), crossing the majority of the Visayas region
Keyword: Storm Surge; Typhoon Haiyan; Typhoon Yolanda             at a speed of 40.7kph (22 knots) (NASA, 2013). Yolanda
                                                                  maintained its structure as it moved over the east central
                                                                  Philippines. JMA observed that the lowest value of
                                                                  central pressure was 895 hPa (very low central pressure
                                                                  means very high wind speed) and typhoon intensity
                                                                  increased from ``very strong'' to ``violent'' (JMA, 2013).

                                                             45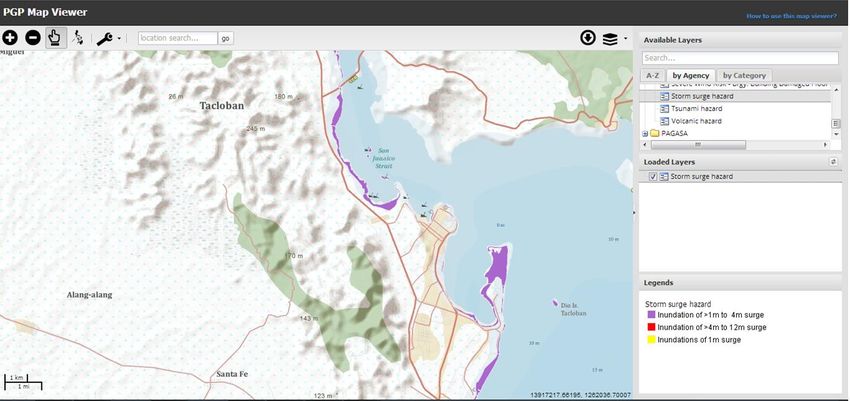
Parameters used as input for the storm surge model
In terms of wind speed, JTWC touted Yolanda as the                 include bathymetry, storm track, central atmospheric
most intense tropical cyclone in the world for 2013. As            pressure, and maximum wind speed. These inputs
Typhoon Yolanda traversed through the Visayas region               determine the accuracy of simulation results.
(Figure 2), it caused damage to houses and
infrastructure, flooding in low-lying areas, landslides and        Bathymetry used was the ETOPO2 with grid postings
storm surges. Super Typhoon Yolanda is the deadliest               every 2 arc minutes. The bathymetry defines the sea
typhoon ever to hit the Philippines in recent history              floor bed or the depth of the ocean bottom relative to the
leaving 6,201 dead, 1,785 missing and 28,626 injured               sea level. Bathymetry was a necessary parameter input in
(NDRRMC, 2014).                                                    the JMA model since the slope of the sea floor
                                                                   influences the height of the storm surge. Wide and
The storm surges of Yolanda were predicted two days in             gently-sloping sea floor produces higher storm surge
advance with a complete list that was broadcast over               heights, while narrow and steeply-sloping shelves
media the night before Yolanda made landfall.                      produce lower storm surge heights (NOAA, 2013).
Unfortunately, despite the advanced warnings, these
were not translated into appropriate action in every               The predicted storm track used was the JMA model,
coastal village in the Central Philippines region. Here we         freely available to the public and available for download
elucidate the process behind the storm surge forecast for          at http://www.wis-jma.go.jp/. JMA releases tropical
Yolanda, enumerate the lessons learned from the disaster           cyclone forecasts every 3 hours. Apart from the storm
and then recommend measures to prevent the same                    track, atmospheric pressure as well as the maximum
mistakes from happening again in the future.                       wind speed were also derived from the JMA model.
                                                                   Storm surge simulated height values within the swath of
                                                                   the 600 km wide typhoon for selected coastal sites of the
  2.   M ETHODS                                                    Philippines were then added to the tide data from

                                Figure 1. Image of Typhoon Yolanda at landfall. Source: PAGASA
To model the hazards of Super Typhoon Yolanda,                     WXTide - software that contains a catalogue of world-
research scientists of the Nationwide Operational                  wide astronomical tides. Addition of the storm surge
Assessment of Hazards (DOST-Project NOAH), the                     height to the WXTide tide height generates the storm
flagship disaster research program of the Department of            tide values. These were used by DOST-Project NOAH to
Science and Technology, used the JMA Storm Surge                   warn the public through PAGASA, of this type of hazard
Model. It is a numerical code developed by the Japan               associated with Typhoon Yolanda.
Meteorological Agency (JMA) to simulate and predict
storm surges mainly caused by tropical cyclones.                   After the Yolanda disaster, Flo2D simulations of storm
                                                                   surge inundation were generated to assess the extent of
                                                                   incursion of sea water inland. These were used to assess
                                                              46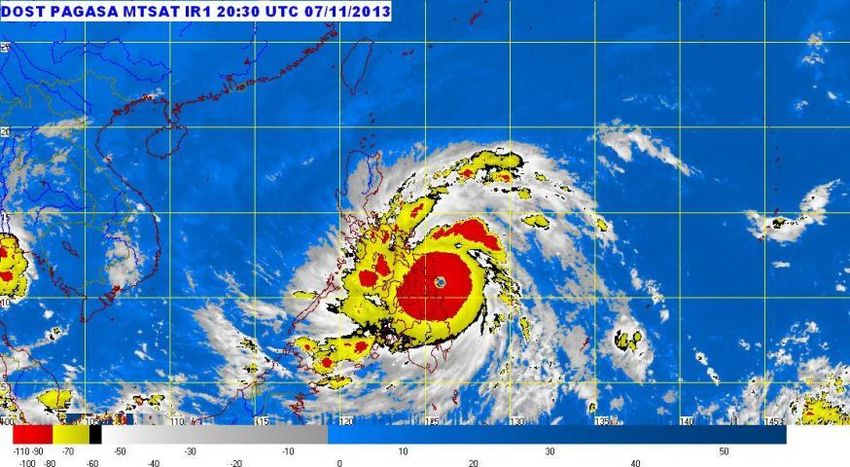
the possible damage of storm surges relative to the                        surge were late by almost four hours depending on the
strong winds of Yolanda.                                                   location but the model was still able to capture the
                                                                           number of storm surges that hit Tacloban. The 4.5 m
                                                                           (14.7 feet) prediction for Tacloban was also consistent
  3. RESULTS                                                               with some eyewitness accounts saying that the storm
                                                                           surge in several parts of Tacloban City reached 15 feet.
A 96-hour storm surge forecast was generated for                           Storm surge heights in other areas still need to be
Typhoon Yolanda for the period 0000 UTC 06                                 validated in the field. There is also video evidence of a
November to 0000 UTC 10 November 2013 (Figure 2).                          surge estimated to be more than one-storey (3 m) high in
An unofficial list of the highest predicted storm surge                    Hernani, Eastern Samar at around 0600H local time on 8
and tide values within a 300-km radius along the track of                  November.
Typhoon Yolanda was released on 6 November 2013
using the 1100H PST JMA track data. The storm surge
simulations were updated every 6 hours and by 7
November, a list was provided to the Office of Civil
Defense (OCD) and the NDRRMC. No less than the
President of the Republic of the Philippines announced
the severity of the impacts of the storm surges on
primetime television. Included in his speech was
reference to the DOST-Project NOAH website
(http://www.noah.dost.gov.ph), where the list of storm
surge heights can be found. The official list provided to
the NDRRMC is shown in Table 1.

The time series plots for the localities with the top three
highest peak storm surge with astronomical tide heights
show the predicted time of the peak surge and water
level changes throughout the duration of the simulation
(Figure 2). The plots show the trends of water level
changes every ten minutes.

Figure 2. Plot of the predicted maximum storm surge heights (in cm)
for Typhoon Yolanda

The highest predicted storm surge and tide height was
5.3 m for Matarinao Bay, Eastern Samar which covers
the towns of Salcedo, Quinapondan, Gen. MacArthur,
and Hernani. The second and third highest were 4.7 m in
Poro Island, Biliran Straight, and 4.5 m in Tacloban
straight, respectively. The predicted times of the peak
                                                                      47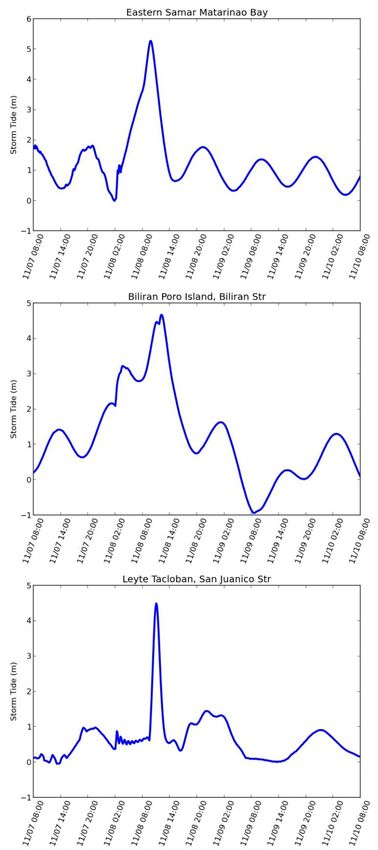
Figure 3. Time series plots of (a) Matarinao Bay, (b) Biliran
Strait, and (c) Tacloban using 07 Nov 2013 1100h UTC JMA
Best Track Data

                           Table 1. Predicted storm tide for Typhoon Yolanda, 2 meters and above.

                                                                          Storm                       Time of Peak
        Province                           Location                      Tide(m)            Date         Height
 Eastern Samar            Matarinao Bay                                     5.3           11/8/2013      09:50:00
 Biliran                  Poro Island, Biliran Strait                       4.7           11/8/2013      12:10:00
 Leyte                    Tacloban, San Juanico Strait                      4.5           11/8/2013      11:00:00
 Quezon                   Port Pusgo                                        4.4           11/9/2013      02:20:00
 Eastern Samar            Andis Island, Port Borongan                       4.3           11/8/2013      09:30:00
 Quezon                   Santa Cruz Harbor                                 4.2           11/9/2013      02:20:00
 Palawan                  Port Barton                                       3.9           11/9/2013      02:00:00
 Iloilo                   Banate                                            3.9           11/9/2013      02:10:00
 Leyte                    Palompon                                          3.9           11/8/2013      12:40:00
 Leyte                    Ormoc                                             3.8           11/8/2013      13:20:00
 Northern Samar           Helm Harbor, Gamay Bay                            3.7           11/8/2013      09:10:00
 Cebu                     Tuburan                                           3.2           11/8/2013      12:20:00
 Negros Occidental        Himugaan River Entrance                           3.1           11/8/2013      14:00:00
 Negros Occidental        Cadiz                                             3.0           11/8/2013      03:10:00
 Masbate                  Bogo Bay                                          3.0           11/8/2013      12:50:00
 Camarines Sur            Cabgan Island, San Miguel Bay                     2.9           11/8/2013      08:10:00
 Camarines Norte          Lamon Bay:Apat Bay                                2.9           11/8/2013      09:00:00
 Oriental Mindoro         Port Concepcion, Maestre de CampoI                2.8           11/9/2013      01:20:00
 Palawan                  Ulugan Bay                                        2.8           11/9/2013      01:30:00
 Samar                    Talalora                                          2.8           11/8/2013      12:00:00
 Albay                    Tabaco, Tabaco Bay                                2.7           11/8/2013      09:20:00
 Masbate                  Masbate                                           2.7           11/8/2013      13:10:00
 Oriental Mindoro         Calapan Bay                                       2.7           11/9/2013      01:30:00
 Quezon                   Torrijos                                          2.7           11/9/2013      02:00:00
 Leyte                    Canauay Island, Janabatas Ch                      2.7           11/8/2013      12:00:00
 Quezon                   Aguasa Bay                                        2.6           11/9/2013      01:50:00
 Negros Occidental        Danao River Entrance                              2.6           11/8/2013      14:30:00
 Camarines Sur            Tabgon Bay                                        2.5           11/8/2013      10:20:00
 Negros Occidental        Carcar Bay                                        2.5           11/8/2013      14:40:00
 Aklan                    Aclan River Entrance                              2.5           11/9/2013      01:40:00
 Quezon                   Atimonan                                          2.4           11/8/2013      08:50:00
 Masbate                  Port Barrera                                      2.4           11/9/2013      01:40:00
 Capiz                    Libas (Capiz Landing)                             2.4           11/8/2013      15:30:00
 Camarines Norte          Port Jose Panganiban                              2.3           11/8/2013      08:50:00
 Occidental Mindoro       Mangarin                                          2.3           11/9/2013      00:20:00
 Camarines Norte          Lamon Bay:Capalonga                               2.3           11/8/2013      08:40:00
 Occidental Mindoro       Apo Island, Mindoro Strait                        2.2           11/9/2013      01:10:00
 Batangas                 Anilao, Balayan Bay                               2.2           11/9/2013      01:10:00
 Occidental Mindoro       Sablayan                                          2.1           11/9/2013      01:10:00
                                                                48
EasternSamar Hilaban Island 2.0 11/8/2013 08:50:00
Cebu Carmen 2.0 11/7/2013 00:30:00
Samar Uban Point, San Juanico Strait 2.0 11/8/2013 09:00:00
Iloilo Miagao 2.0 11/9/2013 01:10:00
Camarines Norte Guintinua Island, Calagua Islands 2.0 11/8/2013 09:20:00
Bohol Maribojoc 2.0 11/8/2013 02:20:00
Figure 4. Storm surge inundation map prepared for the city of Tacloban by the READY project team. This map was accessed on
19 November 2013 from the NAMRIA geoportal.
4. DISCUSSION these maps for preparedness and mitigation, it is
assumed that they were at least aware of the hazard
4.1 Storm Surge Inundation Maps map’s existence. Under Republic Act 10121 or the
The READY Project aims to reduce the problem of Philippine Disaster Risk Reduction and Management Act
disaster risk management (DRR) at the local level by of 2010", the local government should identify, assess
empowering the most vulnerable cities and and manage the hazards vulnerabilities and risks that
municipalities in the country and enable them to prepare may occur in their locality; and disseminate information
disaster risk management plans. The project hopes to and raise public awareness about those hazards,
develop a systematic approach to community disaster vulnerabilities and risks, their nature, effects, early
risk management. Supported by the United Nations warning signs and counter-measures (Philippine
Development Program (UNDP) and the Government of Congress, 2010).
Australia Australian Aid (AusAID), storm surge hazards
maps are among the outputs of the project, shared with 4.2 Pre-emptive Action
the sub-national government units or communities and
integrated into their local comprehensive development or Because of the weather bulletins issued by PAGASA,
land use plans. Ready hazard maps are made available to work and classes were suspended on 7-8 November in
communities through the preparation of printed maps several provinces in the path of the typhoon. Each city
and also online through the NAMRIA Geoportal, among and municipality has the authority to declare suspensions
others. Figure 4 shows the READY map for Tacloban. and base their decisions mainly on bulletins provided by
The purple color refers to an inundation height of 1-4m. the Philippine weather bureau, supplemented by
Based on reported storm tide heights and field data, this information from other international and local sources,
range is an underestimation of the actual water levels. including those posted by DOST-Project NOAH on its
website and mobile applications.
Whether or not reference to these maps was made in the Regional offices of the Department of Public Works and
pre-emptive evacuation action is unknown. However, Highways (DPWH) conducted assessments of structural
since there was information, education campaigns (IECs) integrity of schools, cleaning of waterways and
made in Leyte where disaster officials learn how to use drainages, clearing of roads and pruning of trees.
49Response teams and heavy equipment were put on precautionary measures for the typhoon (Official
standby. The Department of Health (DOH) prepositioned Gazette, 2013).
medicine, and first aid kits and placed hospitals on alert
(NDRRMC, 2013). The Armed Forces of the Philippines The Tacloban local government unit also evacuated
had the Naval Forces Southern Luzon (NAVFORSOL) people near the coast and had food packs ready
dispatch trucks, relief goods, diving gear, rubber boats, (Dalangin-Fernandez, 2013). The DOH in Tacloban also
portable generators and squad tents in Albay. The augmented their stock of medicine and body bags. In
Philippine Navy was placed on alert and directed all its Eastern Samar, Governor Conrado Nicart Jr., said they
floating assets to prepare and take necessary had rescuers and rescue boats on standby before
50Typhoon Yolanda hit the province (Rappler.com, 2013).
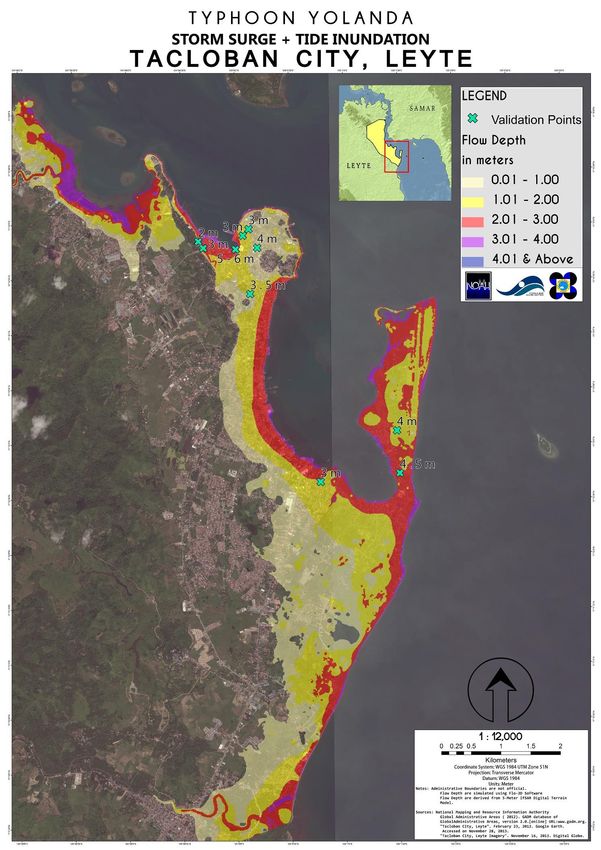
51Figure 5. Storm surge and tide inundation map for Tacloban City generated over a high-resolution digital
terrain model (DTM) with observed values.}
The newly installed Doppler radar station in Guiuan, 52where the typhoon first made landfall, provided images meters of flooding due to the storm surge. The areas
of the oncoming typhoon validated are shown in Figure 5.
and was used as part-basis for the issuance of warnings
which depicted the severity of the cyclone. The mayor of 4.5 Interviews with Tacloban City Residents
Guiuan informed all barangay officials to evacuate.
Some residents evacuated, some did not (Ranada, 2013). Interviews with Typhoon Yolanda survivors were
conducted to find out how they prepared for the
Supertyphoon, what happened when the storm surge hit,
4.3 News Accounts and how people were able to survive.
Coverage of Yolanda's aftermath was in both local and According to eyewitnesses, the water level rose to 15
international news. Although the devastation was feet in 20 minutes. The storm surge did not just come
widespread in the central Philippines region, attention from the direction of the sea but also from the airport and
was focussed in Tacloban City, where national had moved like a whirlpool. People survived by climbing
government officials and many of the weather news up trees or roofs. They said that the local government did
crews tasked to cover the Supertyphoon positioned not lack in warning them but it was the people who
themselves. According to journalist James Reynolds, refused to heed them. Some people did not evacuate
Typhoon Yolanda was the most terrifying event he has because they either wanted to protect their property or
witnessed. Reynolds, who has spent the past eight years they thought their concrete-built houses were safe.
filming Asia's deadliest natural disasters said, ``Yolanda Tacloban is often hit by typhoons but based on their
was the most calamitous event he has ever witnessed'' experience, typhoons only bring wind and rain and it was
(Ford, 2013). the first time a storm surge happened there.
Local Philippine news reporter Jiggy Manicad, described Several evacuation sites proved disastrous because they
the event was like they were ``inside a washing machine'', were overwhelmed by storm surges. However, one
as intense winds blew for hours spawning deadly surges evacuation site, a coliseum called the Astrodome, despite
(Archangel, 2013). According to the provincial being beside the coastline of Tacloban, saved 4000
government of Leyte, the storm surge was estimated to people. Refugees inside the Astrodome were able to
reach as high as the equivalent of three floors of a climb up the gallery (personal communication, Mayor
building (Valderama, 2013). Others estimated the waves Alfred Romualdez of Tacloban City and Ted Failon, TV
that flattened Tacloban, destroyed most of the houses, anchor).
upturned vehicles on the road, and took the life of
thousands to be 20 feet high (Lopez, 2013). In Samar, A university administrative staff said that those areas
where the typhoon made its first landfall, reports of a damaged by storm surges should be made into
storm surge as high as five meters filled the roads with permanent danger zones, and that a hazard map of the
debris (Liljas, 2013). In the coastal towns of Basey, area is necessary. The same person said that if a tsunami
Samar the local government was paralyzed after it was alert had been given, residents might have listened to the
hit by a 15-feet storm surge (Cuevas-Miel, 2013). evacuation orders. Some of the informal settlers who
Anecdotal accounts by eyewitnesses reported varying were interviewed said that a barangay captain warned
heights of the waves and must be validated to establish them of a tsunami, the night before the storm. One
accuracy and reliability of data. resident narrated that several hours after the deluge in
Tacloban, someone shouted ``Tsunami'' and caused
4.4 Field Validation panic among some residents. The mad rush towards
higher ground resulted in injuries. Another interview
On November 30, 2013, researchers of DOST-Project said that around 100 people went up the hills beside the
NOAH conducted field validation and interviews in coast and survived while those who did not believe the
Tacloban regarding the storm surge brought by Typhoon warning and stayed in their houses did not make it.
Yolanda. Interviewees were present during the storm
surge event; their firsthand accounts of the event were
recorded to help validate the result of the simulation.
In other areas with no witness of the storm surge event,
the team searched for water marks to determine the
highest level water reached. The heights pointed by the
interviewees and high water mark were measured
vertically relative to the ground using meter tape. Based
on the interviews, water levels reached 4 to 5 meters in
Brgy. San Jose and the surrounding areas of the airport.
The downtown area of Tacloban experienced 5 to 6
53these metrics, it is clear that the number of deaths is not
only related to the landscape of the affected areas and
Percentage of death
Municipality/ Number of Actual population
relative to total Province
City deaths (NSO, 2010)
population
Tacloban City 2542 221,174 1.20% Leyte
Tanauan 1252 50,119 2.50% Leyte
Palo 1088 62,727 1.70% Leyte
Basey 195 50,423 0.40% Samar
Guiuan 101 47,037 0.02% Eastern Samar
Hernani 72 8,070 1.00% Eastern Samar
Estancia 52 42,666 0.10% Ilo-ilo
Dagami 43 31,490 0.10% Leyte
Ormoc City 37 191,200 0.00% Leyte
Tolosa 32 17,921 0.20% Leyte
proximity to where the eye of the typhoon made its
5. CONCLUSION AND RECOM M ENDATIONS initial impact but also with the population.
Table 2. Top ten cities/municipalities with fatalities caused by Typhoon Yolanda
A storm surge is a rise in the water level over and above The storm surges of Typhoon Yolanda were predicted
the predicted astronomical tide due to the presence of the two days in advance with a complete list that was
storm (NOAA, 2013). It is produced when ocean water broadcast over tri-media and social media. DOST-
is pushed toward the shore by strong winds associated Project NOAH hosted the list of areas that were to be
with cyclonic storms and influenced further by other affected by storm surges, which identified specific places
factors such as underwater topography and water depth and heights. That warning was echoed by no less than
(Botts, 2013). Meteorological factors affecting storm the President of the Philippines over primetime
surge include storm data such as wind speed, pressure, television on the eve of Yolanda's landfall. Unfortunately,
and storm track. Physical factors include near-shore despite the advanced warnings, these were not translated
bathymetry, coastal shape, and topography. The height into appropriate action in every coastal village in the
of the surge highly depends on the strength of the winds Central Philippines region. Not everyone knew what a
carrying it. However, physical factors must also be storm surge was and could do. Although disaster
considered. For example, a storm surge is more responders encouraged people to leave the coastal
dangerous in areas with a gently-sloping seafloor, as villages of Tacloban, there was still difficulty in getting
there is no barrier for the waves to stop the surge from all the people out of harm's way. Based on the interviews
going further inland (NOAA, 2013c). Predicting storm made in Tacloban and reactions of people in general, the
surges requires taking all of these factors into reasons for the disaster appears to have been complicated,
consideration and inputting them into the storm surge a product of a multiplicity of factors, which include the
models to be able to create accurate simulations and following: 1) extremely powerful typhoon that was 600
hazard maps. km in diameter; 2) maps from the READY project did
not reflect the actual storm surge flooding extent; 3) men
Compared to the killer storm surge events on 12 stayed behind to protect their houses 4) inability to
November 1970 and 29 April 1991 in Bangladesh, which understand a 5 meter storm surge; 5) local belief that
caused 300,000 and 138,882 deaths, respectively they know their sea better than anyone else; 6) residents
\citep{Bangladesh07}, the toll of Yolanda is less than of the disaster area did not learn from history - 2
10,000 fatalities. Many of the casualties of typhoon devastating storm surge events happened in 1897 which
Yolanda are from Tacloban City and its adjacent killed up to 1,500 (Bankoff, 2007) and in 1912 killed
southern municipalities of Palo and Tanauan (Table 2). 15,000 people (The Washington Herald, 1912); 7) people
These areas rank among the top 3 highest percentage were more familiar with the term tsunami and storm
number of fatalities relative to the population. Based on surge was new to them; 8) common folk are generally
54disinterested in learning about hazards because daily
concerns are more important ; 9) the stars were out the Moreover, reference to more detailed maps that depict
previous night and did not appear that a catastrophe was the scenario of inundation for any given storm surge
imminent; 10) pressing political issues diverted media warning is imperative (Figure \ref{survey}). Maps that
attention; 11) there were large communities of informal are low resolution and developed through field
settlers along the coastal towns vulnerable to the storm interviews are insufficient or even dangerous because
surge hazards; 12) inadequate information dissemination anecdotal accounts can be incomplete. Detailed maps
13) evacuees took refuge in places overwhelmed by can only be created through highly accurate digital
storm surges. terrain models (DTMs), surveyed through Light
Detection and Ranging (LIDAR) or equivalent survey
instruments. Computer models of storm surge inundation
To prevent an impending disaster, there are two are made on these high-resolution DTMs, printed out for
important points to consider: 1) Warning and 2) Action display for each barangay or shown through the internet
(Response). The warning must be accompanied by for reference by the public to know the action to take
knowledge by the people on what to do in case the alarm when there is a warning. The public will want to move
is raised. For Yolanda affected areas, the storm surge from an unsafe place to another which is safe based on
warning was raised days in advance but incomplete the detailed storm surge hazard maps.
action was made to prevent the loss of lives by the
thousands. This was complicated by a variety of reasons The Philippines is visited by 20 cyclones each year and
as mentioned above. However, it is important to note that storm surges are common. The one that happened in the
there must have been preparedness action made by the central Philippine region during Yolanda is the most
communities since the extremely devastated places are powerful in recent history and it will not be the last. The
coastal areas which had on average about 99\% of their sooner the detailed and high-resolution storm surge
population survive. hazard maps are created, the better the people can
respond to any warning of an impending storm surge
To achieve a much lower fatality count, there is a need to hazard.
strengthen hazards education at the barangay (village)
level and develop a culture of preparedness. Although
this is already embodied in section 12 articles 9 and 10
of Republic Act No. 10121, its actual implementation
leaves much to be desired (Philippine Congress, 2010).
ACKNOWLEDGEM ENTS
We wish to acknowledge the Department of Science and Technology (DOST), Philippine Atmospheric Geophysical
and Astronomical Services Administration (PAGASA), National Institute of Geological Sciences (NIGS), Nationwide
Operational Assessment of Hazards (Project NOAH), and the Japan Meteorological Agency (JMA).
REFERENCES
AFP, 2013. Updates on AFP efforts in preparation for Typhoon Yolanda. Technical report, Armed Forces of the
Philippines. http://www.gov.ph/2013/11/07/updates-on-afp-e_orts-in-preparation-for-typhoon-yolanda/.
Archangel, X., 2013. Bodies scattered in Leyte as Visayas in schock from Yoanda's fury. website.
Http://www.gmanetwork.com/news/story/334740/news/regions/bodies-scattered-in-leyte-as-visayas-in-shock-from-
yolanda-s-fury.
Bankoff, G. A World of Water: Rain, Rivers and Seas in Southeast Asian Histories. Storms of history (water,hazard
and society in the Philippines. KTLV Press.
http://www.google.com.ph/books?hl=en&lr=&id=ruMtZCx_f5IC&oi=fnd&pg=PA153&dq=storm+surge+records+P
AGASA&ots=831y_sxt0H&sig=XvX2XoqQYnbgucNscxc9oT-
EL8s&redir_esc=y#v=onepage&q=philippines&f=false},
Botts, H., Du, W., Je_rey, T., Kolk, S., Pennycook, Z., and Suhr, L., 2013. Storm Surge Report. Technical report,
Corelogic.
Cuevas-Miel, L., 2013. Survivors hid in caves but Yolanda still left more than 300 deda in two Samar towns. website.
http://www.interaksyon.com/article/74569/survivors-hid-in-caves-but-yolanda-still-left-more-than-300-dead-in-two-
samar-towns.
55Dalangin-Fernandez, L., 2013. 'Tacloban prepared for Yolanda but its strength was overwhelming', local officials say.
website. http://www.interaksyon.com/article/74581/tacloban-prepared-for-yolanda-but-its-strength-was-
overwhelming-local-officials-say.
Department of Disaster Management of Bangladesh, 2012. Cyclones and Storm Surges. Website.
http://www.ddm.gov.bd/cyclone.php
Ford, E., 2013. Storm-chaser says Yolanda was 'off the scale'. website.
http://www.gmanetwork.com/news/story/334948/scitech/sciecce/storm-chaser-says-yolanda-was-off-the-scale.
JMA, 2013. Tropical Cyclone Information, 3-day Track and Intensity Forecasting. website. www.jma.go.jp/en/typh/.
JTWC, 2013. Prognostic Reasoning for Super Typhoon 31W (Haiyan). website. http://weather.noaa.gov Retrieved: 08
November 2013.
Liljas, P., 2013. Supertyphoon Haiuan smashes into the Philippines. website.
Http://world.time.com/2013/11/07/supertyphoon-haiyan-smashes-into-the-philippines/.
Lopez, V.2013. Storm surge: Biggest threat from tropical cyclone. website.
http://www.sunstar.com.ph/breakingnews/2013/11/11/storm-surge-biggest-threat-tropical-cyclone-313195
NASA, 2013. Haiyan (Northwestern Paci_c). website. www.nasa.gov.
NDRRMC, 2013. NDRRMC report on actions taken by the government in the wake of Typhoon Yolanda (November
11, 2013. Technical report, National Disaster Risk Reduction and Management Council.
http://www.gov.ph/2013/11/11/ndrrmc-report-on-actions-taken-by-government-in-the- wake-of-typhoon-yolanda-
november-11-2013/.
NDRRMC, 2014. NDRRMC Update SitRep No. 87 Effects of Typhoon Yolanda (Haiyan). Technical Report,
National Disaster Risk Reduction and Management Council.
NOAA, 2013a. website. www.weather.noaa.gov.
NOAA, 2013b. Significant Tropical Weather Advisory for the Western and South Pacific Oceans. website.
www.weather.noaa.gov.
NOAA, 2013c. Storm Surge Overview. Technical report, National weather Service - National Hurricane
Center. http://www.nhc.noaa.gov/surge/.
PAGASA, 2013. Typhoon "Yolanda". Philippine Atmospheric Geophysical and Astronomical Services
Administration website. www.pagasa.gov.ph.
Philippine Congress, 2010. Philippine Disaster Risk Reduction and Management Act of 2010. Fourteenth Congress,
Third Regular Session, Metro Manila, Republic of the Philippines.
Ranada, P., 2013. No food for 4 days in Guiuan islands. website. Http://www.rappler.com/move-
ph/issues/disasters/typhoon-yolanda/43665-food-guiuan-islands-haiyan.
Rappler, 2013. Eastern Samar residents not ready for storm surge. website.
Http://www.rappler.com/video/reports/43739-eastern-samar-residents-not-ready-for-storm-surge.
Valderama, T., 2013. What have you done, Yolanda? website. Http://manilatimes.net/what-have-you-done-
yolanda/52057/.
The Washington Herald, 1912. 15,000 Die in Philippine Storm. Newspaper.
http://chroniclingamerica.loc.gov/lccn/sn83045433/1912-11-30/ed-1/seq-1/
WIS-JMA, 2013. Typhoon Best Track 2013-12-18 T00:00:00Z. website. www.wis-jma.go.ph.
56You can also read