SUSTAINABLE CONVENTIONAL RESOURCE COMPANY TSX: SGY MARCH, 2020 - Surge Energy Inc.
←
→
Page content transcription
If your browser does not render page correctly, please read the page content below
SUSTAINABLE CONVENTIONAL RESOURCE COMPANY TSX: SGY MARCH, 2020
REASONS TO OWN SURGE – TSX: SGY
Value based with a strong focus on sustainable production from conventional reservoirs

   In response to the current volatility in global crude oil markets, Surge
   management and Board have reacted proactively, shifting previously budgeted
   capital from Q1 and Q2 2020 into Q4 of the year. Furthermore the Company has
   reduced its dividend until such time as there is a sustainable recovery in world
   crude oil pricing.

▪ Focus on high quality conventional, large OOIP (1), light/medium gravity crude
  oil reservoirs;

▪ Maintains a stable production base with 86% oil & NGL’s and a low corporate
  decline rate of 23%;

▪ Drilling inventory of over 800 net locations (>13 years of drilling) (2); and
      •   >250 of which have an IRR >20%, at $40 WTI(2).

▪ Total Proved Net Asset Value(3) of $2.37 per basic share.

               (1) See the Reserves section of the Oil and Gas Advisories section at the back of this presentation.
               (2) See the Drilling Locations section of the Oil and Gas Advisories section at the back of this presentation.
                FOOTNOTES      INCLUDED      IN THE  BACK on ASslide
                                                                ENDNOTES
                                                                                                                                2
               (3) Net Asset Value   calculation is detailed         5 – Net Asset Value.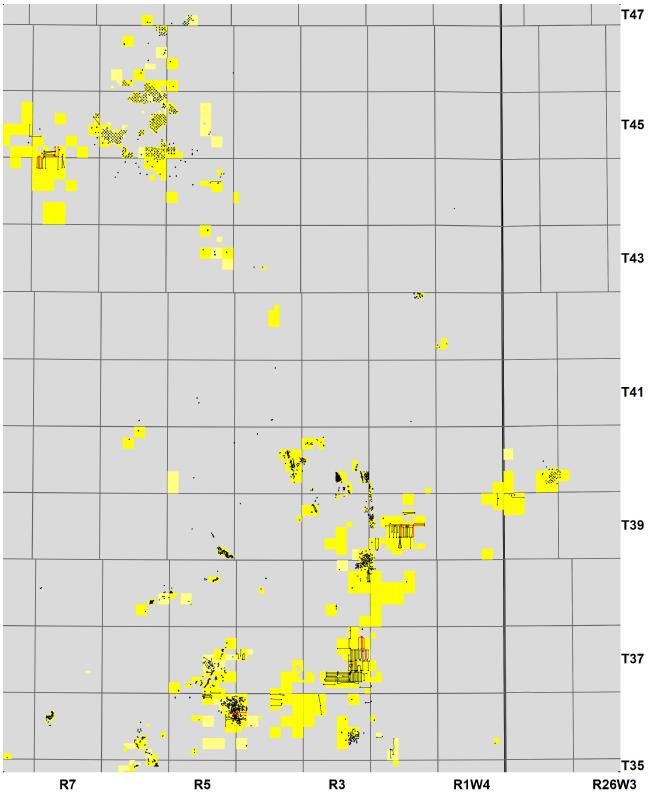
SIGNIFICANT HEDGE POSITION                                                                                                           (1)

      Robust 2020 hedging program provides balance sheet protection

                                                                 OIL HEDGES

                                                                                                                                                 ▪ Well-positioned with 42% of net
                                                                                                                                                   oil production hedged (i.e. 1.6
                                                                                                                                                   million barrels) at approximately
                                                                                                                                                   CAD $80/bbl for Q1 through Q3 of
                                                                                                                                                   2020.

                                                                                                                                                 ▪ Edmonton Light and WCS oil
                                                                                                                                                   differentials protected with
                                                                                                                                                   differential hedging strategy and
                                                                                                                                                   operational flexibility.

                                                                                                                                                 ▪ Attractive natural gas pricing
                                                                                                                                                   hedged in 2020 through a
                                                                                                                                                   combination of swaps and collars.

                         Qtr. 1 2020            Qtr. 2 2020              Qtr. 3 2020               Qtr. 4 2020              Qtr.1 2021
Avg. bbls/d Hedged          7,250                   5,500                     5,000                    1,500                      500

 Avg. Floor Price    $      81.02           $        79.79           $       78.68             $       79.29           $         74.29

                     Note: All USD-denominated WTI hedges have been converted to CAD at a rate of $0.70 USD/CAD in
                     the above graph and table.

                                    (1) For further details on hedging pleas see the “Hedging Section” in the Appendix of this presentation.

                                    FOOTNOTES INCLUDED IN THE BACK AS ENDNOTES
                                                                                                                                                                                       3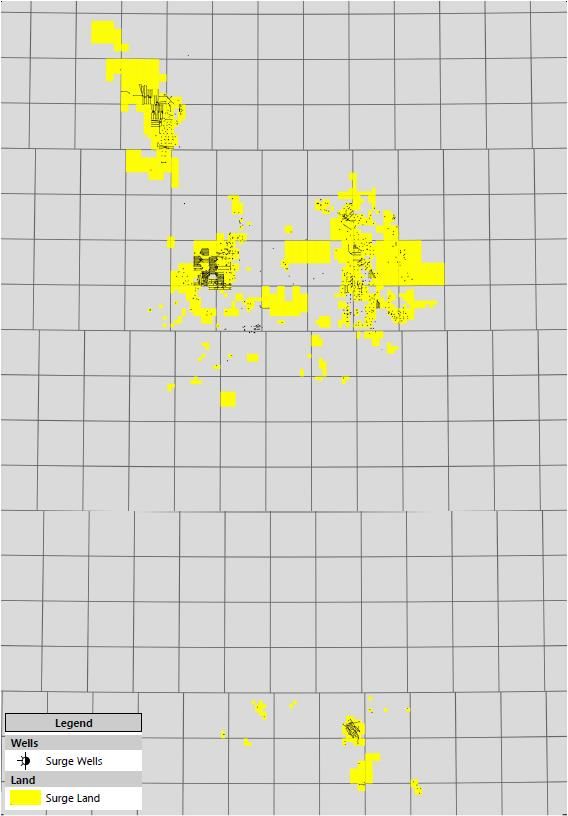
2019 HIGHLIGHTS
Disciplined business strategy provided strong operational and financial results

  ▪ Average daily production increased by 17% in 2019 to 21,175 boepd,
    from 18,058 boepd in 2018;

  ▪ Increased operating netbacks(2) year over year by >27% to $27.66/boe;

  ▪ Maintained an all-in-payout ratio(2) of 91%;

  ▪ Reduced net debt(2) by $79 million over the year;

  ▪ Year end 2019 reserves provide a Total Proved Net Asset Value (3) of
    $2.37 per basic share; and

  ▪ Added 21.6MMboe of Total Proved + Probable reserves over the past 3
    years, replacing 109 percent of production.

              (1) See the Oil and Gas Advisories section at the back of this presentation.
              (2) See the Non-GAAP Financial Measures section at the back of this presentation.
              (3) Net Asset Value calculation is broken down in slide 5 – Net Asset Value.
               FOOTNOTES INCLUDED IN THE BACK AS ENDNOTES
                                                                                                  4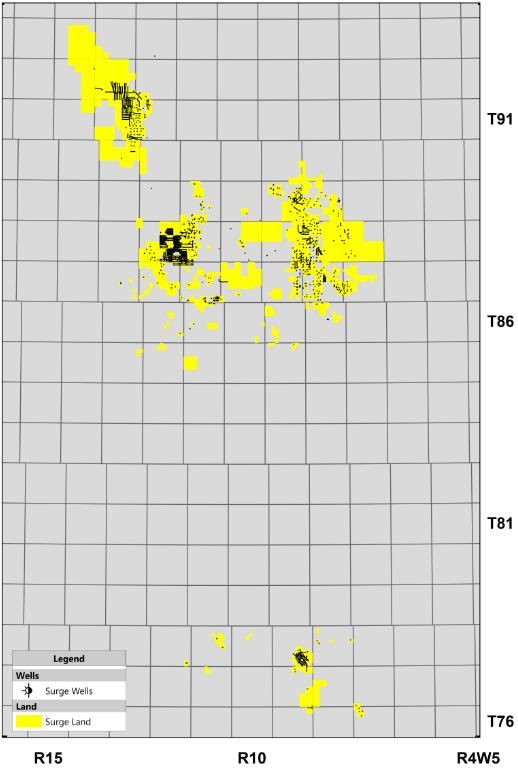
2019 YEAR END RESERVES
>$1.6 Billion of Total Proved plus Probable Reserves Value (NPVBT10)

                              2019 Year End Reserves(1)(2)                                                                                         ▪ Increased Total Proved
                                                                                                                                                     reserves per debt adjusted
                                          Oil & NGLs    Gas                                 Total                 NPVBT10                            share by 4% in 2019;
    Reserve Category                              (3)
                                           (Mbbl)     (MMcf)(4)                            (Mboe)                  ($MM)(5)

     Proved Producing                          34,505                 31,104                39,689                     $603
                                                                                                                                                   ▪ Added 21.6 MMboe of Total
   Proved Non-Producing                           253                   217                   289                        $4                          Proved + Probable reserves
    Proved Undeveloped                         31,589                 35,146                37,446                     $416                          over the last three years,
     Total Proved (1P)                         66,346                 66,467                77,424                    $1,023
                                                                                                                                                     replacing 109% of production;
                                                                                                                                                     and
         Probable                              34,082                 32,006                39,417                     $621

Total Proved + Probable (2P)                  100,428                 98,474               116,841                    $1,644
                                                                                                                                                   ▪ Maintained a 2P reserve life
   2019 Reserves (MMboe)                                                               2019 Reserves Value                                           index of 15 years.
                                                                                              (NPVBT10 $MM)

                  (1) See the Reserves section of the Oil and Gas Advisories at the back of this presentation.
                  (2) Amounts may not add due to rounding.
                  (3) Includes light, medium, heavy and natural gas liquids.
                  (4) Includes conventional
                  FOOTNOTES       INCLUDEDnatural
                                              IN THEgas,
                                                     BACKsolution gas and coal bed methane.
                                                             AS ENDNOTES
                                                                                                                                                                                     5
                  (5) Total ADR (Abandonment, Decommissioning, Reclamation) is included in the reserves report, as it is best practice stated in the COGE Handbook.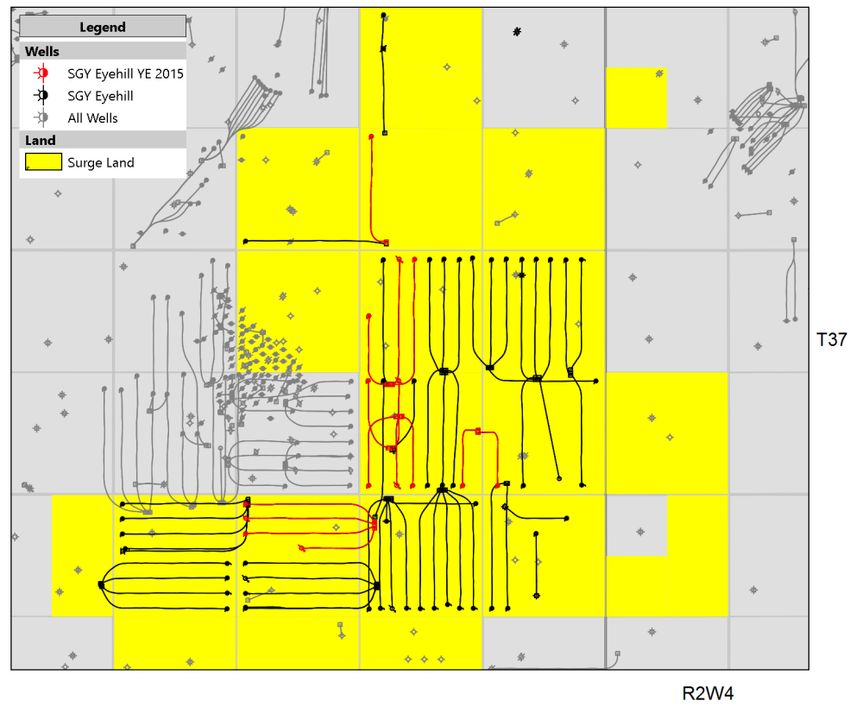
NET ASSET VALUE
High quality conventional reservoirs continue to deliver value to shareholders

                                                                  2019 NAV per Share
                                                                                                                       PDP       TP          TPP
         Reserve Value NPV10 BT ($MM)                                                                                  $603    $1,023       $1,644

         Undeveloped Land and Seismic ($MM) (1)                                                                        $131     $131         $131

         Net Debt ($MM)                                                                                              $(382)    $(382)       $(382)

         Total Net Assets ($MM)                                                                                        $352     $772        $1,393

         Basic Shares Outstanding (MM)                                                                                  326      326          326

         Estimated NAV per Basic Share ($/share)                                                                 $1.08/ sh.   $2.37/ sh.   $4.27/ sh.

              (1) Internally estimated and includes $95 million for non-reserve assigned lands and $36 million for seismic

              FOOTNOTES INCLUDED IN THE BACK AS ENDNOTES
                                                                                                                                                        6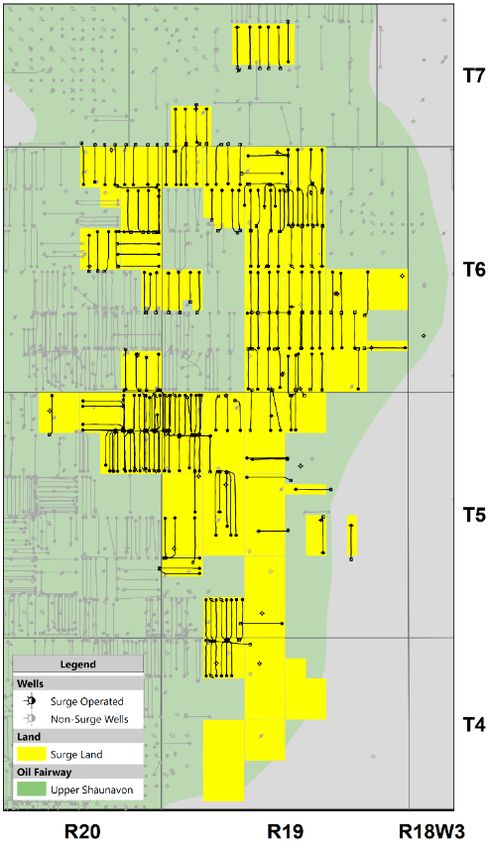
2020 GUIDANCE AND KEY CORPORATE ATTRIBUTES
Cost effective, sustainable, low decline, crude oil production base

 Key Operational and Financial Attributes
  Large Net OOIP:                                                                                                      2.5 Bbbl’s (5.6% cum to date recovery factor)(1)(2)

  High Netback, Oil Weighted Production (liquids weighting):                                                           21,000 boepd (86% light/medium oil + NGL’s)

  Low Corporate Decline:                                                                                               23% per year

  Large Drilling Inventory:                                                                                            13 years (>800 net locations @ >60 wells per year)

  Net Asset Value (Sproule Dec 31/18):                                                                                 $2.37 per share TP; $4.27 per share P+P

  2020e Exploration and Development Capital:                                                                           $98.5 MM *
      Drilling and Completions                                                                                             $68.0 MM

      Facilities, Equipment, and Pipelines                                                                                 $23.5 MM

      Other (Land, Seismic, G&A)                                                                                           $ 7.0 MM

  Capital Efficiency ($ / boepd)(2):                                                                                    $20,400

  Current Annual Dividend:                                                                                             $3.3 MM ($0.01 per share, per annum)

  2020e Net Operating Expenses(3):                                                                                     $14.00-$14.50 per boe

  2020e Transportation Costs:                                                                                          $1.50-$1.75 per boe
  2020e General & Administrative Costs:                                                                                $1.85-$1.95 per boe

* In response to the current volatility in global crude oil markets, Surge management and Board have reacted quickly. The Compa ny has shifted previously budgeted
capital from Q1 and Q2 2020 into Q4/20.

                       (1) OOIP, drilling locations, and recovery factors are inclusive of Surge’s acquisition and divestiture activity to date in 2019.
                       (2) See the Addition Metrics section of the Oil and Gas Advisories at the back of this presentation.
                       (3) See the Non-GAAP Financial Measures section at the back of this presentation.
                        FOOTNOTES INCLUDED IN THE BACK AS ENDNOTES
                                                                                                                                                                             7
OPERATIONS FOCUSED IN 4 CORE AREAS
Large OOIP pools in established conventional reservoir trends

                                                     Greater Sawn:
                                                   Total: ~5,000 boe/d
                                                   (93% Oil & NGL’s)

                                                                          Average Area Production
                                                                            Total: 21,000 boe/d
                                                                             (86% Oil & NGL’s)
                                            Valhalla:
                                      Total: ~4,500 boe/d
                                      (65% Oil & NGL’s)

                                                           Sparky:
                                                    Total: ~9,000 boe/d
                                                    (93% Oil & NGL’s)

                                                                               Shaunavon:
                                                                             Total: ~2,000 boe/d
                                                                             (100% Oil & NGL’s)

                           Minors:
                      Total: ~500 boe/d
                     (50% Oil & NGL’s)

              FOOTNOTES INCLUDED IN THE BACK AS ENDNOTES
                                                                                                    8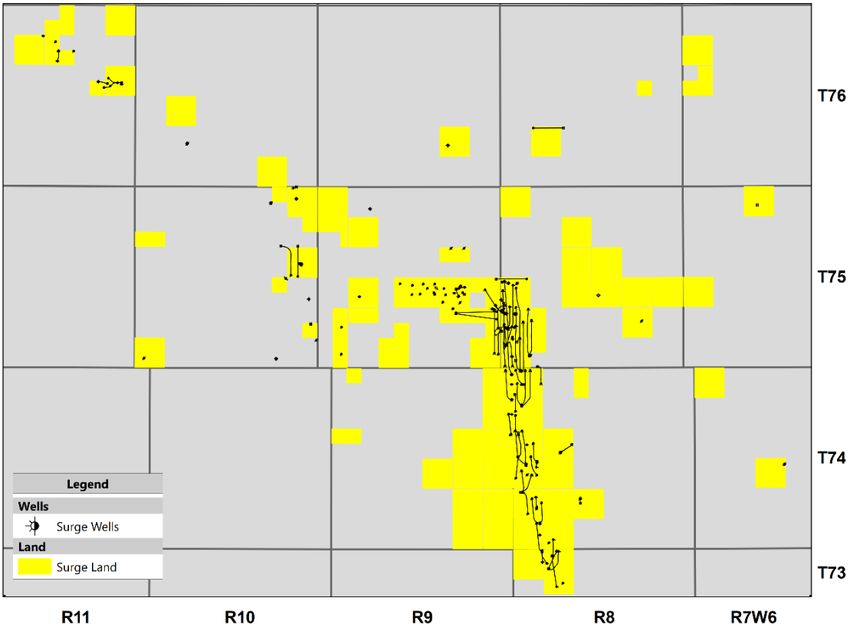
NET OOIP OF >2.5 BILLION BARRELS
Large OOIP, with low recovery factors - focused in conventional reservoirs

                                                                         SGY                                                               Net CTD(2)      Total Booked Net
                                                                                                 Total Net drilling
                                                                    Estimated Net                                                             Oil       Independent Recovery
          Core Area                   Formations                                                    Locations                   Avg. WI
                                                                        OOIP                                                               Recovery           Factor P+P
                                                                      (MMbbls)                          (Booked)(1)                         Factor           (% OOIP)

                              Sparky Formation +                                                           >500
        Sparky Core                                                      >1,000                                                   92%        8.2%             11.8%
                               Mannville Group                                                             (185)

                                 Doig / Montney /                                                           >75
          Valhalla                                                         >200                                                   84%        4.6%              9.5%
                                  Charlie Lake                                                              (44)
                                                                                                           >150
        Greater Sawn                 Slave Point                           >700                                                   90%        5.0%              8.6%
                                                                                                            (84)
                                   Shaunavon                                                               >125
         Shaunavon                                                         >400                                                  100%        1.9%              4.7%
                                 (Upper & Lower)                                                            (92)
                                   (3)                                                                     >800
                     TOTALS :                                            >2,500                                                   91%        5.6%              9.0%
                                                                                                           (428)

            >2.5 Billion barrels of net internally estimated OOIP under ownership;
                               Current net recovery factor ~5.6%.

                 (1) See the Drilling Locations in the Oil & Gas Advisories section at the back of the presentation.
                 (2) CTD means cumulative oil produced to date and is effective to December 31, 2019.
                 (3) Totals doINCLUDED
               FOOTNOTES        not sum asIN
                                           minor
                                             THEproperties
                                                 BACK AShave  been included in the totals but have not been subcategorized in the table.
                                                           ENDNOTES
                                                                                                                                                                               9
TARGETING CONVENTIONAL OIL RESERVOIRS
Surge focuses on high quality reservoirs at the conventional end of the permeability spectrum
Recovery factors, internal rates of return
(IRR)(1), decline rate, and profit to investment
ratio (PIR)(1) improves as reservoir quality
Ultimate Oil
Recovery
improves. PIR
&
IRR
High Risk Low Risk
High Decline CAPITAL / BUSINESS / OPERATIONAL RISK
Low Decline
Unconventional
Conventional Reservoirs
Reservoirs
Extremely Tight Very Tight Tight Low Moderate High
Slave Point
Bakken
Permian Valhalla Doig
Shaunavon
Montney Viking-Cardium
Duvernay
Resource Halo Sparky
0.0001 0.001 0.01 0.1 1 10 100
Source: Modified from US Department of Energy Study
Permeability (mD)
Average Surge Permeability
(1) See the Addition Metrics section of the Oil and Gas Advisories at the back of this presentation. 10SURGE’S ECONOMIC INVENTORY > 20% IRR
13 years of drilling @ US$60 WTI - Average Risked IRR: 96% & PIR10: 1.22
SGY Economic Locations > 20% Risked IRR
900 13 yrs 13 yrs
* Risked weighted average 13 yrs
800
700 10 yrs
SGY Economic Locations
600
Years of Drilling Inventory
500
*PIR10: 1.86
*IRR: 166%
*PIR10: 0.87
*PIR10: 1.22
*PIR10: 1.67
*IRR: 143%
*IRR: 66%
*IRR: 96%
400
300
200
100
0
$50 WTI $60 WTI $70 WTI $80 WTI
Realized EDMN $1.50C$60
AECO $1.50C$73
AECO $1.50C$87
AECO $1.50C$100
AECO
Realized WCS (0.75 FX)
C$45 (0.75 FX)
C$59 (0.75 FX)
C$72 (0.75 FX)
C$85
FX $0.75 $0.75 $0.75 $0.75
Gas $1.50 AECO $1.50 AECO $1.50 AECO $1.50 AECO
>250 locations have >20% IRR at $40 WTI
(> 4 years of drilling)(2)
(1) Profit to Investment ratio, discounted at 10% (PIR10) equals 0.0, when NPV10 equals the original investment capital (i.e. 0.0 = breakeven). See the Additional Metrics section at the back of this
presentation for additional information.
(2) Drilling locations are comprised of both booked and un-booked locations and are net of Surge’s acquisition and divestiture activity to date in 2019. See the Drilling Locations section at the back of
FOOTNOTES
this presentationINCLUDED IN THE BACK AS ENDNOTES
for more information.
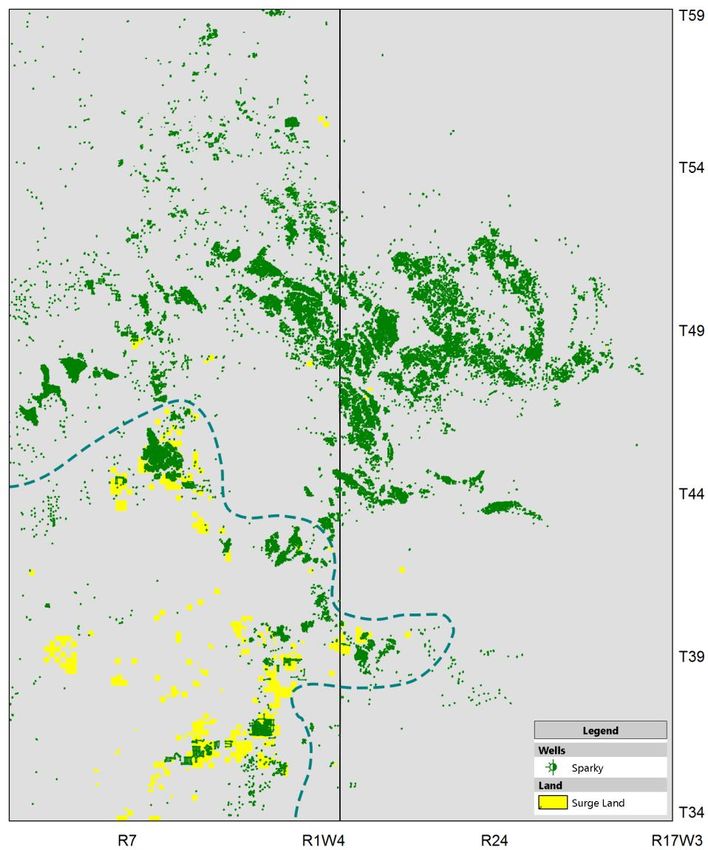
11SPARKY – A DOMINANT POSITION
Applying modern technology to a prolific Western Canadian formation
AB SK ▪ The Sparky is a large, well established, prolific oil
producing formation in Western Canada.
▪ Surge holds a dominant land position in the medium /
light gravity oil window, and is applying modern
horizontal multi-stage fracturing technology.
Key Sparky Value Drivers:
• Shallow depth (700-900m).
• Low cost drilling (D,C&E at $1.2MM per well).
• Surge continues to improve costs and efficiencies with the
implementation of pad drilling.
• Low geological risk due to 3D seismic and thousands of
vertical penetrations.
• Focus on lighter oil gravity (23-31° API) = higher netbacks.
• Proven waterflood potential (Wainwright pool at >35%
recovery factor(1)).
Medium / Light Gravity
Oil Window Sparky Formation Facts(1)
>20° API First Production May 1922
Original Oil in Place > 11 Bbbls
Cum Production > 1 Bbbls
Recovery Factor 20,000
Hz Wells / Multi-Stage Hz /
Surge Multi-Stage Hz
>650 / >200 / >120
(1) Data sourced from Canadian Discovery and GeoScout
FOOTNOTES INCLUDED IN THE BACK AS ENDNOTES
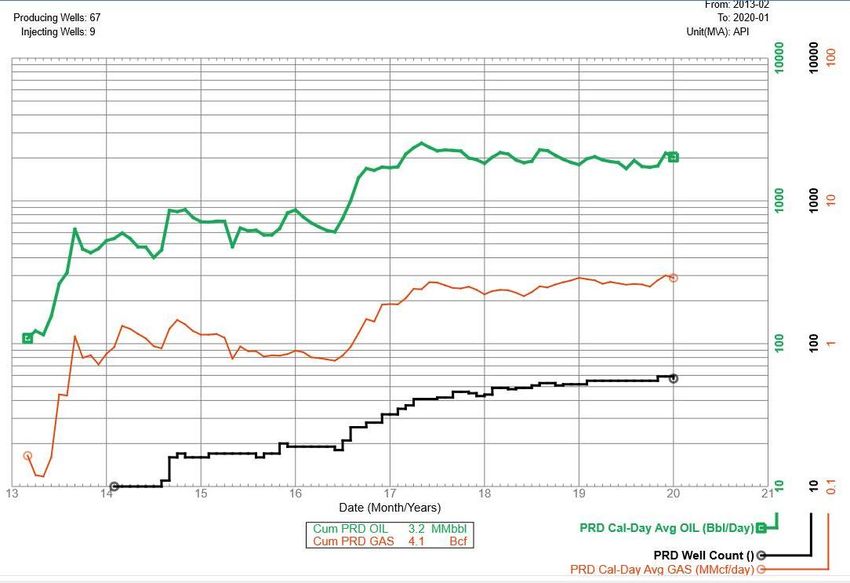
122019 SPARKY DRILLING RESULTS
Production results continue to outperform internal type curve expectations
Wainwright
Betty
Lake
Silver
Macklin
Lakeview Provost
▪ 24 horizontal Sparky wells drilled and on production in 2019:
Sounding
• Normalized average production is well above Surge’s internal type curve
Lake Eyehill
• 12 wells were brought on production in Q4
Eyehill
Sounding
▪ Surge is realizing top tier capital efficiencies of 1.0 Bbbls Net OOIP
down to $1.05 million per well as compared to a budgeted
>500 Drilling Locations
$1.25MM per well). (>10 year inventory, 90% Oil)
Surge Operated Wells
>9,000 boepd currently
2019 Sparky Drills
(1) See the INCLUDED
FOOTNOTES Addition Metrics
IN THEsection
BACK of AS
the ENDNOTES
Oil and Gas Advisories at the back of this presentation.
13EYEHILL – A CASE STUDY
Increased production and cashflow over 380% in 3 years
YE 2015 Maintain Flat Production
as per Divco Model
Surge Eyehill:
▪ >200MMbbls net OOIP
▪ >65 net locations remain
(45 net booked)
Source: GeoScout
• Surge had only 15 horizontal wells producing 500
boepd (80% oil) at year end 2015.
• Surge has drilled an average of 14 wells per year (12
per year excluding acquisitions), increasing
R3W4
production by 400% – inclusive of lost production
associated with water injector conversions.
• Of the 72 operated horizontal wells at Eyehill, Surge drilled 60
and acquired 12. • To date 9 of the 72 wells drilled have been converted
to water injection, providing pressure support and
• Peak production of 2,950 boepd was reached in May 2017.
lowering the pool decline (i.e. Divco model).
TPP TPP
Net OOIP # of producing # of Hz Wtr Production CF/Yr @
% Oil Reserves NPV10
(MMbbl) Hz's Injectors (boepd) US$60 WTI
(Mboe) ($MM)
YE 2015 70 15 1 500 80% $7.0 4,089 $49
YE 2019 200 59 9 2,500 83% $33.7 15,029 $231
4 Yr Change +130 +44 +8 +2,000 +3% $26.7 +10,940 $182
14
+186%
FOOTNOTES INCLUDED IN THE BACK AS ENDNOTES +293% +400% +381% +268% +371%GREATER SAWN - CONCENTRATED LIGHT OIL
>600MMbbls net OOIP in concentrated Slave Point reservoirs
Sawn ▪ OOIP of >700 MMbbls net of light oil
OOIP: >200 MMbbl net
(35-42° API).
Red Earth ▪ Development inventory of 150 net locations
OOIP: >250 MMbbl net
(84 net booked).
▪ Key Slave Point Attributes:
Evi / Otter • 6% recovery to date.
OOIP: >150 MMbbl net • 18% base decline; waterflooded.
• Production derived primarily from large multi-cycle
reef complexes (pay(1) thickness of up to 18
meters).
▪ Active Slave Point Waterfloods:
• Sawn
• Red Earth
Nipisi & Nipisi South • Evi/Otter
OOIP: ~100 MMbbl net
• Nipisi
(1) ) See the Addition Metrics section of the Oil and Gas Advisories at the back of this presentation. 15VALHALLA – STACKED MULTI-ZONE POTENTIAL
Multiple large OOIP light oil reservoirs provide a sustainable drilling inventory and production base
▪ >200MMbbls of net combined OOIP.
▪ Doig wells continue to be among the most
prolific oil producers in Western Canada.
Montney
▪ Recently drilled a horizontal well into the
Company’s large OOIP Montney (turbidite) light
oil pool, with initial production rates exceeding
1,400 bopd.
▪ Drilling inventory includes >75 net locations in
Charlie Lake multiple horizons (44 net booked).
IP30: >200 bopd Doig
▪ Light oil gravity (~40° API) and extensive
infrastructure in the area = attractive netbacks.
Depth Net OOIP Capital IP180 IP 180 Prod Eff
Formation
(m) (MMbbl) ($MM/well) (boe/d) ($/boepd)
Charlie Lk. 1900 >40 $3.0 270 $11,100
Doig 2050 >150 $4.0 450 $8,900
Montney 2200 >40 $4.0 370 $10,800
FOOTNOTES INCLUDED IN THE BACK AS ENDNOTES
16SHAUNAVON
>400 MMbbl net OOIP on Surge lands in the Upper and Lower Shaunavon
▪ Shaunavon produces 100% high netback, low decline
oil.
▪ Upper Shaunavon net OOIP is estimated to be
>200MMbbl.
• >65 net locations – (35 net booked).
• 10 horizontal wells converted to water injection.
• Current recovery in the Upper Shaunavon is ~1%.
▪ Lower Shaunavon net OOIP is estimated to be
>200MMbbl.
• >70 net locations – (57 net booked).
• Surge recently drilled and completed 6 Lower
Shaunavon wells using cemented liner, plug and
perf methodology with 100% success rate.
• Current recovery in the Lower Shaunavon is ~3%.
FOOTNOTES INCLUDED IN THE BACK AS ENDNOTES
17CORPORATE SUSTAINABILITY
Surge is taking a proactive approach to Environmental, Social, and Governance issues
Environmental Social Governance
▪ Surge abandoned 149 ▪ Surge employs a pro- ▪ Surge is committed to
wells in 2019 which is active safety culture and diversity in the workplace
over 4X the number of is proud to be over 4 and on its Board of
wells Surge drilled. years without a lost-time Directors.
incident. ▪ Surge increased the gender
diversity on the Board of
▪ Surge has joined the Directors to 33% from 22% in
Alberta Energy ▪ Surge is proud to be a 2019.
Regulators Area Based Gold Level sponsor of the ▪ Surge’s Board independence
increased to 78% from 71% in
Closure Program, La Glace regional 2019.
allowing Surge to focus recreation centre – ▪ The average age of Surge
on abandoning and providing a new Board members is currently 59
reclaiming entire areas community centre and ice years.
versus single wells, rink to the town of La
greatly increasing the Glace, Alberta.
capital efficiencies of
these projects.
FOOTNOTES INCLUDED IN THE BACK AS ENDNOTES
18APPENDIX
FOOTNOTES INCLUDED IN THE BACK AS ENDNOTES
19OIL HEDGING
Qtr. 1 2020 Qtr. 2 2020 Qtr. 3 2020 Qtr. 4 2020 Qtr.1 2021
Avg. bbls./d Hedged 7,250 5,500 5,000 1,500 500
Avg. Floor Price(1)(2) $ 81.02 $ 79.79 $ 78.68 $ 79.29 $ 74.29
(1) All USD-denominated WTI hedges have been converted to CAD at a rate of $0.70 USD/CAD in the above table and graph.
(2) WTI 3-way hedges consist of a sold put, a bought put and a sold call. Using Q1 2021 as an example ($44/$52/$60), Surge receives
FOOTNOTES INCLUDED IN THE
20
WTI+$8/bbl when WTIBACK
is at AS ENDNOTES
or below $44/bbl; Surge receives $52/bbl when WTI is between $44/bbl and $52/bbl; Surge receives WTI when
WTI is between $52/bbl and $60/bbl; and Surge receives $60/bbl when WTI is above $60/bbl.RISK MANAGEMENT / HEDGING STRATEGY
The Company has an on-going, risk management / hedging program. Below is a list of Surge’s current WTI hedges:
WTI Hedges - Swaps
Quarter Volume Swap (USD)
Qtr. 1 2020 3,250 $ 58.17
Qtr. 2 2020 1,500 $ 57.03
Qtr. 3 2020 500 $ 57.25
WTI Hedges - Collars
Quarter Volume Bought Put (USD) Sold Call (USD)
Qtr. 1 2020 4,000 $ 55.53 $ 65.74
Qtr. 2 2020 4,000 $ 55.41 $ 65.34
WTI Hedges – 3 Ways
Quarter Volume Bought Put (USD) Sold Call (USD) Sold Put (USD)
Qtr. 1 2020 - $- $- $-
Qtr. 2 2020 - $- $- $-
Qtr. 3 2020 4,500 $ 54.83 $ 64.98 $ 46.61
Qtr. 4 2020 1,500 $ 55.50 $ 66.00 $ 46.83
Qtr. 1 2021 500 $ 52.00 $ 60.00 $ 44.00
FOOTNOTES INCLUDED IN THE BACK AS ENDNOTES
21RISK MANAGEMENT / HEDGING STRATEGY
The Company has an on-going, risk management / hedging program. Below is a list of Surge’s current WTI hedges:
WCS Oil Differential Hedges Natural Gas Hedges
Floor Ceiling Type Term Volume Currency Floor Ceiling
Type Term bbl/d Currency
(per bbl) (per bbl)
US$WTI less April –
WCS Swap 1H 2020 1,000 USD - Chicago 3,000 $2.05 per
$16.50 October USD -
Swap MMBTU/d MMBTU
2020
Q2 – Q4 US$WTI less US$WTI less
WCS Collar 1,500 USD Chicago Dec 2019 – 3,000 $3.08 per
2020 $15.50 $20.00 USD -
Swap March 2020 MMBTU/d MMBTU
US$WTI less US$WTI less
WCS Collar 2020 1,000 USD AECO Nov 2019 – 3,000 $1.98 per
$14.60 $19.95 CAD -
Swap Dec 2020 GJ/d GJ
Q2 – Q3 US$WTI less Chicago Nov 2019 – 3,000 $2.25 per $2.90 per
WCS Swap 1,500 USD - USD
2020 $16.40 Collar Oct 2020 MMBTU/d MMBTU MMBTU
US$WTI less AECO 4,000 $1.45 per
WCS Swap 2H 2020 1,000 USD - Cal 2020 CAD -
$17.50 Swap GJ/d GJ
WCS Swap Q3 2020 500 USD
US$WTI less
- Chicago Nov 2020 – 3,000 $2.15 per $2.90 per
$16.45 USD
Collar Oct 2021 MMBTU/d MMBTU MMBTU
MSW Oil Differential Hedges
Floor Ceiling
Type Term bbl/d Currency
(per bbl) (per bbl)
US$WTI less
MSW Swap Q2 2020 1,500 USD -
$5.75
Q2 – Q3 US$WTI less
MSW Swap 3,500 USD -
2020 $4.94
FOOTNOTES INCLUDED IN THE BACK AS ENDNOTES
22INTEREST RATE AND FX HEDGING & CONVERTIBLE DEBENTURE
INTEREST RATE HEDGE
Notional Amount Surge
Type Term Surge Pays Fixed Rate Surge Pays
(CAN$) Receives
Semi-Annual Step Up
• Beginning at 1.786%
Fixed-to-Floating Rate Swap Feb 2018 to Feb 2023 $100,000,000 Floating Rate Fixed Rate
• Ending at 2.714%
• Averaging 2.479%
Fixed-to-Floating Rate Swap July 2019 – June 2024 $50,000,000 Floating Rate Fixed Rate 1.785%
FIXING INTEREST COSTS IN A RISING RATE ENVIRONMENT
Notional Amount Surge Surge
Type Term Effective Fixed Rate Surge Pays
(CAN$) Receives Pays
Fixed-to-Floating Rate Swap Feb 2018 to Feb 2023 $100,000,000 Floating Rate Fixed Rate Effective All in Rate 4.76% (1)
July 2019 – June
Fixed-to-Floating Rate Swap $50,000,000 Floating Rate Fixed Rate Effective All in Rate 4.04% (1)
2024
Convertible Debenture
Nov 2017 to Dec 2022 $44,500,000 Floating Rate Fixed Rate Effective All in Rate 5.75%
Issuance
Convertible Debenture May 2019 to June
$34,500,000 Floating Rate Fixed Rate Effective All in Rate 6.75%
Issuance 2024
Total $229,000,000 Weighted Average All in Rate of 5.09%
FOREIGN EXCHANGE RATE HEDGE
Type Term Notional Amount (USD) Rate
FX average Rate Fund Q2 2020 – Q4 2020 $1,000,000 per month Swap at $1.3245
(1) Based on projected borrowing spread as of December 31, 2019
FOOTNOTES INCLUDED IN THE BACK AS ENDNOTES
23ANALYST COVERAGE
Financial Institution Analyst Email Address
Acumen Capital Partners Trevor Reynolds treynolds@acumencapital.com
BMO Capital Markets Ray Kwan ray.kwan@bmo.com
Canaccord Genuity Anthony Petrucci apetrucci@canaccordgenuity.com
CIBC Dave Popowich dave.popowich@cibc.com
Clarus Securities Inc. Robert Pare rpare@clarussecurities.com
Cormark Securities Inc. Garett Ursu gursu@cormark.com
Eight Capital Adam Gill agill@viiicapital.com
GMP FirstEnergy Robert Fitzmartyn rjfitzmartyn@gmpfirstenergy.com
Industrial Alliance Securities Michael Charlton mcharlton@iagto.ca
Laurentian Bank Securities Todd Kepler KeplerT@lb-securities.ca
National Bank Financial Dan Payne Dan.payne@nbc.ca
Peters & Co. Limited Cindy Mah cmah@petersco.com
Raymond James Jeremy McCrea Jeremy.McCrea@raymondjames.ca
Schachter Asset Management Josef I. Schachter josef@e-sami.com
Scotia Capital Inc. Cameron Bean cameron.bean@scotiacapital.com
TD Securities Juan Jarrah Juan.Jarrah@tdsecurities.com
24CORPORATE PARTNERS
Advisors
National Bank of Canada
Bank of Nova Scotia
Bank of Montreal
ATB Financial
Bankers Syndicate: Canadian Imperial Bank of Commerce
Toronto-Dominion Bank
HSBC Bank Canada
BDC Capital
Goldman Sachs
Auditor: KPMG LLP
Legal Counsel: McCarthy Tétrault
Evaluation Engineers: Sproule
Registrar & Transfer Agent: Computershare Canada
Paul Colborne, President & CEO
Investor Contacts:
Jared Ducs, CFO
2100, 635 – 8th Ave. SW, Calgary Alberta T2P 3M3
T: 403.930.1010 F: 403.930.1011
www.surgeenergy.ca
FOOTNOTES INCLUDED IN THE BACK AS ENDNOTES
25FORWARD-LOOKING STATEMENTS
FORWARD-LOOKING STATEMENTS
More particularly, this presentation contains statements concerning: Management’s expectations and plans with respect to the development of its assets and the timing thereof;
Surge’s assets and the characteristics thereof; Surge’s declared focus and primary goals; Surge’s annual exploration and development capital expenditure program and budget
and its flexibility to make adjustments thereto; commodity prices and management’s ability to react to changes thereto; drilling inventory; Surge’s hedging strategy; maintenance
of Surge’s decline rate; export pipelines; and Surge’s dividend policy and expectations for future dividends.
The forward-looking statements are based on certain key expectations and assumptions made by Surge, including expectations and assumptions the performance of existing
wells and success obtained in drilling new wells; anticipated expenses, cash flow and capital expenditures; the application of regulatory and royalty regimes; prevailing
commodity prices and economic conditions; development and completion activities; the performance of new wells; the successful implementation of waterflood programs; the
availability of and performance of facilities and pipelines; the geological characteristics of Surge’s properties; the successful application of drilling, completion and seismic
technology; the determination of decommissioning liabilities; prevailing weather conditions; exchange rates; licensing requirements; the impact of completed facilities on
operating costs; the availability and costs of capital, labour and services; and the creditworthiness of industry partners.
Although Surge believes that the expectations and assumptions on which the forward-looking statements are based are reasonable, undue reliance should not be placed on the
forward-looking statements because Surge can give no assurance that they will prove to be correct. Since forward-looking statements address future events and conditions, by
their very nature they involve inherent risks and uncertainties. Actual results could differ materially from those currently anticipated due to a number of factors and risks. These
include, but are not limited to, risks associated with the condition of the global economy, including trade, public health and other geopolitical risks; risks associated with the oil
and gas industry in general (e.g., operational risks in development, exploration and production; delays or changes in plans with respect to exploration or development projects or
capital expenditures; the uncertainty of reserve estimates; the uncertainty of estimates and projections relating to production, costs and expenses, and health, safety and
environmental risks); commodity price and exchange rate fluctuations and constraint in the availability of services, adverse weather or break-up conditions; uncertainties resulting
from potential delays or changes in plans with respect to exploration or development projects or capital expenditures; and failure to obtain the continued support of the lenders
under Surge’s bank line. Certain of these risks are set out in more detail in Surge’s MD&A dated March 9, 2020 and in Surge’s AIF for the period ended December 31, 2019,
which have both been filed on SEDAR and can be accessed at www.sedar.com.
The forward-looking statements contained in this press release are made as of the date hereof and Surge undertakes no obligation to update publicly or revise any forward-
looking statements or information, whether as a result of new information, future events or otherwise, unless so required byapplicable securities laws.
FOOTNOTES INCLUDED IN THE BACK AS ENDNOTES
26OIL AND GAS ADVISORIES
The term “boe” means barrel of oil equivalent on the basis of 1 boe to 6,000 cubic feet of natural gas. Boe may be misleading, particularly if used in isolation. A boe conversion ratio of 1 boe for 6,000 cubic
feet of natural gas is based on an energy equivalency conversion method primarily applicable at the burner tip and does not represent a value equivalency at the wellhead. Given that the value ratio based on
the current price of crude oil as compared to natural gas is significantly different from the energy equivalency of 6:1, utilizing a conversion on a 6:1 basis may be misleading as an indication of value. Boe/d
and boepd means barrel of oil equivalent per day. Bbl means barrel of oil. NGLs means natural gas liquids.
In this presentation: (i) mcf means thousand cubic feet; (ii) mcf/d means thousand cubic feet per day (iii) MMcf means million cubic feet; (iv) MMcf/d means million cubic feet per day; (v) bbls means barrels;
(vi) Mbbls means thousand barrels; (vii) MMbbls means million barrels; (viii) bbls/d means barrels per day; (ix) bcf means billion cubic feet; (x) Mboe means thousand barrels of oil equivalent; (xi) MMboe
means million barrels of oil equivalent and (xii) boe/d means barrels of oil equivalent per day.
Reserves
Reserves disclosed in this presentation are derived from a third party external evaluation done by Sproule using standard practices as prescribed in the Canadian Oil and Gas Evaluations Handbook and
account for associated proved and/or probable reserves, as applicable. Reserves referenced in this presentation reflect the bookings that existed as of December 31, 2019 and do not account for Surge’s
Acquisitions and Divestiture activity to date.
For the purpose of this presentation, Original Oil in Place (“OOIP”) means Discovered Petroleum Initially In Place (“DPIIP”) as at December 31st, 2019. DPIIP is derived by Surge’s internal Qualified Reserve
Evaluators (“QRE”) and prepared in accordance with National Instrument 51-101 and the Canadian Oil and Gas Evaluations Handbook (“COGEH”). DPIIP, as defined in COGEH, is that quantity of petroleum
that is estimated, as of a given date, to be contained in known accumulations prior to production. The recoverable portion of DPIIP includes production, reserves and Resources Other Than Reserves
(ROTR). The OOIP/DPIIP and potential recovery rate estimates are as at December 31st, 2019 and are based on current recovery technologies and have been prepared by Surge’s internal QRE. There is
significant uncertainty as to the ultimate recoverability and commercial viability of any of the resource associated with the OOIP/DPIIP estimates, and as such a recovery project cannot be defined for this
volume of OOIP/DPIIP at this time.
The estimated values of the future net reserves of the reserves disclosed in this presentation do not represent the market value of such reserves. The estimates of reserves and future net reserve for
individual properties may not reflect the same confidence level as estimates of reserves and future net reserve for all properties due to the effects of aggregation.
Drilling Locations
This presentation discloses drilling locations in two categories: (i) booked locations; and (ii) unbooked locations. Booked locations are proved locations and probable locations derived from a third party
external evaluation done by Sproule using standard practices as prescribed in the COGEH and account for drilling locations that have associated proved and/or probable reserves, as applicable.
Unbooked locations are internal estimates based on prospective acreage and assumptions as to the number of wells that can be drilled per section based on industry practice and internal review. Unbooked
locations do not have attributed reserves or resources. Unbooked locations have been identified by Surge’s internal QREs as an estimation of our multi-year drilling activities based on evaluation of
applicable geologic, seismic, engineering, production and reserves information. There is no certainty that the Company will drill all unbooked drilling locations and if drilled there is no certainty that such
locations will result in additional oil and gas reserves, resources or production. The drilling locations on which the Company actually drills wells will ultimately depend upon the availability of capital, regulatory
approvals, seasonal restrictions, oil and natural gas prices, costs, actual drilling results, additional reservoir information that is obtained and other factors. While certain of the unbooked drilling locations have
been de-risked by drilling existing wells in relative close proximity to such unbooked drilling locations, the majority of other unbooked drilling locations are farther away from existing wells where management
has less information about the characteristics of the reservoir and therefore there is more uncertainty whether wells will be drilled in such locations and if drilled there is more uncertainty that such wells will
result in additional oil and gas reserves, resources or production.
Assuming a Jan 1, 2020 reference date, the company will have over >800 gross (>800 net) drilling locations identified herein, of these >400 gross (>400 net) are unbooked locations. Of the 428 net booked
locations identified herein 330 net are Proved locations and 98 net are Probable locations based on Sproule’s 2019YE reserves .
Type curve economics referenced on “Surge’s Economic Inventory > 20% IRR” slide, were constructed using a representative, fac tual and balanced analog data set, as of August 31, 2019, and a reference
date of Jan 1, 2020. All locations were risked appropriately, and EUR’s were measured against OOIP estimates to ensure a rea sonable recovery factor was being achieved based on the respective spacing
assumption. Other assumptions, such as capital, operating expenses, wellhead offsets, land encumbrances, working interests an d NGL yields were all reviewed and accounted for on a well by well basis by
Surge’s QRE’s. Over 95% of the locations used in the economic inventory slide were represented by type curves developed by Su rge’s QRE’s, the remaining locations were represented using Sproule’s
2018YE type curves. All type curves fully comply with Part 5.8 of the Companion Policy 51 – 101CP. Type Curve economics were run at US$50/bbl, US$60/bbl, US$70/bbl and US$80/bbl WTI, with
differential assumptions of US$16/bbl WCS and US$5/bbl EDMN, and a 0.75 USD/CAD FX.
Following the collapse of oil prices, Surge has subsequently tested their economic inventory at $40 WTI, and estimate over 25 0 locations still have an IRR > 20%.
FOOTNOTES INCLUDED IN THE BACK AS ENDNOTES
27NON-GAAP FINANCIAL MEASURES
Certain secondary measures in this presentation are disclosed for the purpose of providing investors with additional insight as to how the Company evaluates the management of its
capital and analyze business performance. Non-GAAP financial measures are used by management to analyze cash flow generated from the Company's principal business activities and
it may be useful to investors on the same basis. Non-GAAP financial measures are not used to enhance the Company's reported financial performance or position.
Non-GAAP financial measures do not have a standardized meaning prescribed by IFRS and therefore are unlikely to be comparable to similar measures presented by other issuers. They
are common in the reports of other companies but may differ by definition and application. All secondary measures in this document are defined below:
Adjusted Funds Flow
The Company adjusts cash flow from operating activities in calculating adjusted funds flow for changes in non-cash working capital, decommissioning expenditures, transaction and
other costs, and cash settled stock-based compensation plans, particularly cash used to settle withholding obligations on stock-based compensation arrangements that are settled in
shares. Management believes the timing of collection, payment or incurrence of these items involves a high degree of discretion and as such may not be useful for evaluating Surge’s
cash flows.
Changes in non-cash working capital are a result of the timing of cash flows related to accounts receivable and accounts payable, which management believes reduces comparability
between periods. Management views decommissioning expenditures predominately as a discretionary allocation of capital, with flexibility to determine the size and timing of
decommissioning programs to achieve greater capital efficiencies and as such, costs may vary between periods. Transaction and other costs represent expenditures associated with
acquisitions, which management believes do not reflect the ongoing cash flows of the business, and as such reduces comparability. Subsequent to the third quarter of 2018, all of the
Company’s stock-based compensation plans are equity classified as the Company has the intention of settling all awards with shares. Cash settled stock-based compensation currently
represents the statutory tax withholdings required on stock-based compensation awards and is a discretionary allocation of capital. The Company has the option to either require the
holder to sell shares earned in the stock-based compensation plan to satisfy tax withholdings, or the Company can issue less shares to the individual and remit a cash payment to
satisfy tax withholding requirements. Each of these expenditures, due to their nature, are not considered principal business activities and vary between periods, which management
believes reduces comparability.
Adjusted funds flow per share is calculated using the same weighted average basic and diluted shares used in calculating income per share.
The following table reconciles cash flow from operating activities to adjusted funds flow and adjusted funds flow per share for the three months and year ended December 31, 2019:
Three Months Ended Years Ended
($000s except per share) Dec 31, 2019 Dec 31, 2018 Dec 31, 2019 Dec 31, 2018
Cash flow from operating activities $ 34,474 $ 26,770 $ 149,417 $ 121,907
Change in non-cash working capital 2,876 (25,464) 16,569 (24,338)
Decommissioning expenditures 1,425 1,439 5,522 6,348
Cash settled transaction and other costs 106 3,504 1,480 5,288
Cash settled stock-based compensation - - - 4,447
Adjusted funds flow $ 38,881 $ 6,249 $ 172,988 $ 113,651
Per share – basic $ 0.12 $ 0.02 $ 0.55 $ 0.46
FOOTNOTES INCLUDED IN THE BACK AS ENDNOTES
28NON-GAAP FINANCIAL MEASURES CONT’D
All-in Payout Ratio
All-in payout ratio is calculated using the sum of total exploration and development capital, plus dividends paid, divided by cash flow from operating activities less payments on lease
obligations. For the purpose of 2020e all-in payout ratio calculations, payments on lease obligations of $10.8 million is assumed. This non-GAAP measure is used by management to
analyze allocated capital in comparison to the cash being generated by the principal business activities. This measure is provided to allow readers to quantify the amount of cash flow
from operations that is being used to either: i) pay dividends; or ii) deployed into the Company's development and exploration program. A ratio of less than 100% indicates that a portion
of the cash flow from operations is being retained by the Company and can be used to fund items such as asset abandonment, repayment of debt, fund acquisitions or the costs related
thereto, withholding tax obligations on stock based compensation or other items.
Net Debt
There is no comparable measure in accordance with IFRS for net debt. Net debt is calculated as bank debt plus the liability component of the convertible debentures plus or minus
working capital, however, excluding the fair value of financial contracts and other long term liabilities. This metric is used by management to analyze the level of debt in the Company
including the impact of working capital, which varies with timing of settlement of these balances.
($000s) As at Dec 31, 2019 As at Dec 31, 2018
Bank debt $ (316,404) $ (408,593)
Accounts receivable 41,486 21,084
Prepaid expenses and deposits 4,875 9,222
Accounts payable and accrued liabilities (40,848) (42,350)
Convertible debentures (68,699) (37,973)
Dividends payable (2,719) (2,577)
Total $ (382,309) $ (461,187)
Net Operating Expenses
Net operating expenses are determined by deducting processing and other revenue primarily generated by processing third party volumes at processing facilities where the Company has
an ownership interest. It is common in the industry to earn third party processing revenue on facilities where the entity has a working interest in the infrastructure asset. Under IFRS this
source of funds is required to be reported as revenue. However, the Company’s principal business is not that of a midstream entity whose activities are dedicated to earning processing
and other infrastructure payments. Where the Company has excess capacity at one of its facilities, it will look to process third party volumes as a means to reduce the cost of
operating/owning the facility. As such, third party processing revenue is netted against operating costs in the MD&A.
Operating Netback
Operating netback is a financial measure of petroleum and natural gas revenue and processing and other income net of royalties, operating expenses, transportation expenses and
realized gain (loss on financial contracts). This financial measure is used to benchmark and compare performance of the Company’s assets between time periods, operating areas and
competitors. Most often this is shown as a per barrel or per boe measurement.
FOOTNOTES INCLUDED IN THE BACK AS ENDNOTES
29ADDITIONAL METRICS
Additional Metrics
This presentation contains additional metrics commonly used in the oil and natural gas industry. These terms have been calculated by Management and do not have a standardized
meaning. Management uses these oil and gas metrics to further analyze the performance of the Company over time and to compare the results of the Company with others in the industry.
Additional metrics used in this presentation are as follows:
• Net Present Value (NPV) is the present value of cash inflows less present value of cash outflows. NPV10 assumes a discount rate of 10%.
• Free cash flow from operating activities yield is calculated by taking cash flow from operating activities and subtracting exploration and development capital, dividends, and payments on
lease obligations divided by common shares outstanding.
• Production Replacement is calculated as the total organic reserves additions (i.e., excluding acquisitions and dispositions) divided by annual production (also excluding acquisitions and
dispositions).
• Capital efficiencies is calculated as total exploration and development expenditures during the period, divided by an initial production rate for a specified number of days (i.e., $98.5 MM /
(21,000 BOEPD multiplied by 23% corporate decline). Management uses Capital efficiency to understand the amount of development and exploration capital expenditures are required to
add an additional boe of production per day.
• Internal rate of return (IRR) is the discount rate that makes the NPV of all cash flows from a given project equal to zero.
• Profit to investment ratio (PIR) is calculated as the NPV from a project divided by the capital investment ascribed to that project.
• Recovery factor is defined as the percentage of hydrocarbons currently recovered or potentially recoverable from a known accumulation of such hydrocarbons.
• Pay, for the purpose of this presentation, is defined as hydrocarbons located in the subsurface as determined by Surge’s internal QRE. The overall interval in which pay sections occur is
the gross pay; the smaller portions of the gross pay that meet local criteria for pay (such as minimum porosity, permeability and hydrocarbon saturation) are net pay.
• References to initial production (IP) rates found in this press release are useful for determining the presence of hydrocarbons. There is no assurance as to the length of time that wells will
produce at such rates, and consideration must be given to natural declines thereafter. As such, readers are cautioned when using these production rates to aggregate Surge’s production.
FOOTNOTES INCLUDED IN THE BACK AS ENDNOTES
30You can also read