On the Evaluation of Surface Fatigue Strength of a Stainless-Steel Aeronautical Component - MDPI
←
→
Page content transcription
If your browser does not render page correctly, please read the page content below
Article

On the Evaluation of Surface Fatigue Strength of a
Stainless-Steel Aeronautical Component
Filippo Cianetti 1,*, Moreno Ciotti 2, Massimiliano Palmieri 1 and Guido Zucca 3
 1 Department of Engineering, University of Perugia, 06125 Perugia, Italy;
   massimiliano.palmieri@studenti.unipg.it
 2 UmbraGroup S.p.A, Via V. Baldaccini 1, 06034 Foligno (PG), Italy; MCiotti@umbragroup.com

 3 Italian AirForce, Flight Test Center, Technology Material for Aeronautics and Space Department, Military

   Airport M. De Bernardi, via Pratica di Mare, 000040 Pomezia (RM), Italy; guido.zucca@aeronautica.difesa.it
 * Correspondence: filippo.cianetti@unipg.it; Tel.: +39-75-585-3728

 Received: 8 March 2019; Accepted: 15 April 2019; Published: 17 April 2019

 Abstract: In this paper, a novel method for the evaluation of the surface fatigue strength of a
 stainless-steel component is proposed. The use of stainless steel is necessary indeed, whenever a
 component has to work in a particularly aggressive environment that may cause an oxidation of the
 component itself. One of the major problems that affect stainless-steel components is the possible
 wear of the antioxidant film that reduces the antioxidant properties of the component itself. One of
 the main causes that can lead to wear is related to the surface corrosion that occurs every time two
 evolving bodies are forced to work against each other. If the antioxidant film is affected by surface
 fatigue problems, such as pitting or spalling, the antioxidant capacities of this type of steel may be
 lost. In this context, it is, therefore, necessary to verify, at least, by calculation that no corrosion
 problems exist. The method proposed in this activity is a hybrid method, numerical-theoretical,
 which allows to estimate the surface fatigue strength in a very short time without having to resort
 to finite element models that often are so complex to be in contrast with industrial purposes.

 Keywords: stainless steel; structural dynamics; finite element explicit analysis; Hertz theory

1. Introduction
     The use of stainless steels is spreading in all those sectors where the working conditions of
various mechanical components are quite critical and could trigger structural problems of the
component.
     Following their good strength/ductility combination coupled with their excellent corrosion
resistance [1], stainless steels are adopted in many applications including automotive [2],
construction and building [3], oil and gas [4], aeronautical [5], medical [6,7], and food [8].
     In the abovementioned sectors, the mechanical components have to work in environments that
can be saturated with aggressive substances, risking undermining the mechanical properties of the
material and thus inducing possible problems of strength [9]. It is, therefore, evident that, in this
context, the use of stainless materials becomes essential and, therefore, is increasingly widespread.
     Stainless steel owes its resistance to corrosion to a simple chemical reaction: the combination of
chrome in steel and the oxygen in the air or water on the surface form a very thin passivation film.
This film protects the component against all aggressive substances. If this film is damaged, however,
it spontaneously reforms from the steel matrix [10–13]. For this reason, stainless steels are generally
called self-passivation steel. The main actor in the self-passivation phenomenon is chrome. When the
oxygen content is above a certain level, chrome reacts with this, forming a layer of chromium oxide
or hydroxide. This thin film (with a thickness of the order of a few atoms, 3 ÷ 5∙× 10 mm) protects

Metals 2019, 9, 455; doi:10.3390/met9040455                                      www.mdpi.com/journal/metals
Metals 2019, 9, 455                                                                                 2 of 20

the underlying metal from the action of external agents. The corrosion resistance also depends on the
surface morphology: the more the surface is smooth and homogeneous, the greater its resistance to
corrosion will be.
      On the basis of this, many researchers of different scientific backgrounds are actively working,
studying the properties of stainless steels both from a chemical [11–16] and from a structural point of
view [17–22]. The first category is a majority focus on studying how the properties of these materials
vary according to their chemical composition and electrochemical behaviour, while the second
category is mainly focus on the consequences generated by a possible mechanical degradation of the
component surface.
      It is known how mechanical components working in contact are subjected to degradation issues.
The two most common phenomena that induced the degradation of a mechanical component are
pitting and spalling [23]. According to the American Society for Metals (ASM) handbook, “Usually,
pitting is the result of surface cracks caused by metal-to-metal contact of asperities or defects due to
low lubricant film thickness”[24]. Even if the starting point of pitting phenomena is still under
investigation by the scientific community, the link between bodies working in contact and pitting
issues is real and approved without doubts [25].
      Given the reduction of the antioxidant properties that occur in the case of a degradation of the
surface layer of components, an efficient tool for predicting and evaluating contact fatigue may help
the design engineer when they have to face this kind of problem.
      To solve mechanical contact issues, engineers must generally choice between a kinematic-
theoretical approach and a numerical approach. The first exploits the kinematic laws to determine
impact forces and then applies the Hertz theory [26,27] to calculate stresses. This approach requires,
however, an assessment of the initial condition of contact dynamics. This aspect it is often so complex
to make that this method is not applicable in a real complex model. The second approach is based on
the explicit finite element method (FEM), that allows a more accurate assessment of both the impact
forces and surface pressures. The major drawback of this type of approach is the computational time:
To obtain reliable results in terms of stresses, very complex models and, so, impracticable times of
the simulations are generally required [28].
      The present work seeks to propose a simple procedure for the evaluation of pressures and
contact stresses in mechanical components that may result in surface resistance (pitting) issues. The
aim of the work is that of evaluating, by calculation, the possible occurrence of pitting phenomena,
trying to avoid such phenomenon at the beginning of the design stage [29–31].
      The attempt of the authors is to find a trade-off between the efficiency requirement on one side
and the effectiveness of the other one, typical in the design scenario and in contrast with the time and
economic constraints of industries.
      For this reason, the authors developed a hybrid approach, theoretical-numerical, which allows
the calculation effort to speed up obtaining, at the same time, reliable results. Developing a finite
element model not voted to contact stress calculation but only to contact forces evaluation involves a
drastic reduction in computational efforts. Once contact forces are known, the classical Hertz theory
[27] is used to estimate the stresses on the component surface.
      The fully theoretical and numerical procedures and the hybrid one proposed in this activity are
devoted to evaluating contact stress due to bodies in contact. The evaluation of fatigue life is a shared
step of all three methodologies, and it is always based on the assessment of the fatigue curve and on
the damage computational model. In this case, the linear accumulation law of Palmgren-Miner [32]
is used. The proposed hybrid method was validated on a simple case of sphere-plane contact. At the
end, a more complex case study was used to validate the effectiveness of the proposed approach. The
mechanical component used as benchmark is a stainless-steel recirculation mechanism of a ball screw
developed for aeronautical applications by a leader company in this sector.
      As a matter of fact, ball screws are used successfully in all those applications, both industrial and
aeronautical, in which high-speed and high-accuracy movements of components are required. Ball
screws in aeronautical field are generally used for moving mobile surfaces (flaps and slats) and the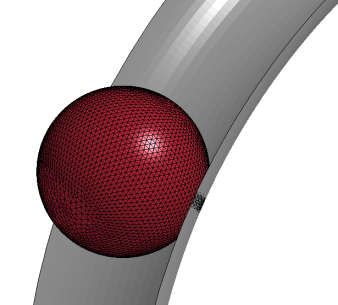
Metals 2019, 9, 455                                                                                3 of 20

stabilizer. For this reason, they are exposed to atmospheric conditions that are sufficiently critical to
require the use of stainless steels.
      Due to the high speed with which these systems have to work, one of the most frequently
encountered problem by ball-screw manufacturers is the premature failure of the evolving
components in contact [26]. The areas most affected by surface fatigue problems in a ball screw are
essentially two: the contact zone between the screw tracks and the balls themselves during normal
operation and the impact zone in the recirculation mechanism where the balls are forced to abruptly
change direction [33,34]. The high number of impacts to which a recirculation system is generally
subject tend to generate a plastic deformation of the recirculation system itself. This modifies the
geometry of the system, causing a rapid increase in the maximum contact pressure on the surface.
This aspect is often shown in a wear on the surface of the recirculation mechanism (pitting) which
leads to a reduction of the antioxidant properties of the stainless steel used and consequently to a
drastic reduction of the fatigue strength of the component.
      Since this phenomenon is often rediscovered, numerous studies have been carried out trying to
better understand the phenomenon of the ball's impact during the recirculation phase and to propose
different approaches for the estimation of the life of ball screws. Jiang et al. [35] studied the dynamics
and impact forces of spheres in a recirculation mechanism, using a multi-body code and trying to
optimize the geometry of the recirculation mechanism itself. Braccesi et al. [36] presented a
relationship between the Hertz equivalent elastic stress limit with typical design parameters such as
the allowable material stress, the geometric characteristics in contact areas, the impact angles, and the
rotational speed for different types of materials, using an elastic-plastic model for a curved body in
contact. Zhang et al. [37] studied the influence of various factors on the impact forces generated
between the spheres and recirculation mechanism for different types of materials and for different
recirculation geometries.
      Although the available methods for the calculation of surface fatigue strength are multiple, the
one proposed in the present activity is aimed at being user-friendly for all those realities that have
not enough resources to devote to the development of complex models that are multi-body model or
finite elements model. What is immediately highlighted by the proposed approach is that, remaining
linked to the theory and exploiting the numerical simulation, it is possible to obtain a more accurate
estimation of the fatigue life than would be obtained using a completely kinematic-theoretic
approach. At the same time, the solution is very close to that obtainable from a completely numerical
approach but, obviously, with a drastic reduction of the computational effort.

2. Theoretical Approach
     In order to obtain a clear exposition, this section describes the theoretical approach that consists
in two consecutive steps:
1. The determination of the contact force starting from the laws of classical mechanics, i.e., the
     conservation of energy and momentum;
2. The evaluation of contact stresses from the Hertz theory on contact.
     The last paragraph of this sections is dedicated to the evaluation of fatigue: as declared in the
previous paragraph, the third step is represented by the fatigue evaluation that is “shared” with the
numerical method.

2.1. From Impact Dynamics to Contact Force: The Relative Approach
     To understand the relationship between impact dynamics and contact forces, two simplifying
assumptions are necessary. The first one foresees that the only component of the velocity during the
impact is perpendicular to the surface; the second is that the impact time is much longer than the
fundamental vibration period of the bodies. The first hypothesis allows the impact to be treated as a
centred impact, while the second one instead allows an application of the principle of energy and
momentum conservation. Under these hypothesis, impact waves are exchanged between two bodies
and there is no energy dissipation [38]. Adopting these assumptions and adopting the formulation
proposed by Braccesi et al. [36], contact forces can be easily expressed as a function of the second
Metals 2019, 9, 455 4 of 20
derivative of the mutual deformation of the two bodies at the time of contact: the approach
acceleration α̈ . With reference to Figure 1, the approach acceleration α̈ can be written as shown in
Equation (1):
+
α̈ = − , (1)
∙
where is the force that presses the two bodies against each other and and are the masses
of the two bodies, respectively. If a mass is much greater than the other ≫ , it is possible to
rewrite Equation (1) as follows:
−
α̈ = , (2)
Figure 1. A Hertzian distribution of contact pressure.
In order to integrate Equation (2), the Hertz theory, which expresses the contact force as a
function of the relative approach, must be introduced. The contact between machine components,
bearings, gears, cams, etc., is a problem known since more than a century and a half, and it was
accurately addressed by Hertz [27] in an analytical-nonlinear theory. In general, the problem consists
in having very small contact surfaces, theoretically degenerating in a point or in a line, through which
the bodies exchange forces. As a direct result, there are very intense pressure distributions
surrounded by sharp gradients. In particular, with reference to the scheme of Figure 2, two general
curved geometries were placed in contact each other by the action of the force .
Figure 2. A Hertzian distribution of contact pressure.Metals 2019, 9, 455 5 of 20
In the general case, there are four different curvature radii, and the contact surface is an ellipse
of semiaxes (the major) and (the minor) (see Figure 2). The pressure ( , ) will have a
semielliptic distribution of maximum . Such quantities can easily be derived from the Hertz
theory as
( , )= 1− − , (3)
3∙
max
= , (4)
2∙π∙ ∙
The Hertz theory [27] leads to an accurate modeling of reality, in particular in all those cases, where
no plastic deformation occurs. If yield occurs, it is possible to define the contact yield pressure as
2∙ ∗∙
= , (5)
π∙ ∗
which indicates the limit to not be exceeded. In Equation (5), is the contact radius when a yield
occurs. Let α be the relative approach between two bodies at the contact point due to the presence
of force . Introducing:
1 1−
∗
= , (6)
1 1
∗
= , (7)
, ,
2π 2 ∙ ( ) (8)
= ,
3∙ ( )
where and are the Poisson and Young's modulus of th body, , the radius of the th
curvature and ( ) and ( ) are elliptic integrals defined in Reference [36]. The relation between
the relative approach and the contact force [36] is shown in Equation (9).
∗ ∗ (9)
= ∙ ∙ ∙α
Equation (9) allows the determination of the contact force in case of elastic behaviour. If yield
occurs, i.e., in case of the plasticization of the component, Equation (8) is not still valid and Thornton's
hypotheses [26] must be introduced.
2.1.1. 1st Thornton's hypothesis
The pressure distribution presents a cutoff to the yield stress (Figure 3); the contact force is
expressed in the following equation:
= − 2π (σ( ) − σ ) , (10)
where is the radius of the plasticized area, is the force resulting from the perfectly elastic
behavior and σ is the yield contact stress.Metals 2019, 9, 455 6 of 20
Figure 3. The Thornton cutoff at yielding stress.
Integrating Equation (10) and considering Equation (5), it is possible to evaluate the contact load
as shown in Equation (11).
∗
= +π∙σ ∙ ∙ (α − α ), (11)
Equation (11) describes the elastic-plastic behavior of the material after yielding an identification
of the linear relation with the relative approach. In Equation (11), α represents the relative approach
when a yield occurs. The material will assume a hysteretic behavior, described in Error! Reference
source not found.4. In this way, when the maximum value is reached, the material will follow the
unloading curve shown in Equation (12).
4 ∗
= ∙ ∙ ∙ α−α , (12)
3
where α represents the permanent deformation.
2.1.2. 2nd Thornton's hypothesis
Identified with ( ; α ), the conditions at the time of discharge, the contact area developed by
the contact force, and the reduced curvature (caused by the plastic deformation) will be equal to that
developed under elastic conditions by an equivalent force and by the curvature contact. By
Equation (13), it is possible to determine the reduced radius by plastic deformations:
α∗ ∗
= , (13)
α∗ −α
Recalling what previously stated that the general elastic plastic loading and unloading curves
are defined in Equation (14) and in Equation (15) respectively:
3 ∗
= + ∙ ∙ ∙ ∙ α ∙ (α − α ), (14)
2
= ∙ ∗
∙ ∙α ∙ α−α . (15)Metals 2019, 9, 455 7 of 20
Contact Load [N]
Figure 4. The elastic vs. perfect plastic curve.
Replacing Equation (9) or Equation (14) and (15) in Equation (1) and imposing a zero approach
velocity (α̇ = 0), it is possible to obtain the equivalent approach as shown in Equation (16)
5
α= ∙ , (16)
4 ∗ ∗
In Equation (16), is the approach velocity of the two bodies at the beginning of the impact.
Using the obtained equivalent approach value α, it is possible to determine the impact force and the
corresponding maximum pressure value.
2.2. From Contact Force to Contact Stress
Setting , = , , and , = , , the problem is simplified to the contact between two spheres.
In this case stress components can be calculated analytically. Considering the variable as from the
reference system of Figure 2, the contact stresses can be computed as in Equations (17)–(19) [27].
1 1
σ , =σ , = − 1− ∙ tan (1 + ) − , (17)
2∙ 1+
1
σ =σ = − ∙ ,
(18)
1+
σ , −σ
τ = , (19)
2Metals 2019, 9, 455 8 of 20
Stress / Max contact pressure [MPa / MPa]
Figure 5. Subsurface stresses distributions.
The stress components are shown as a function of the distance from the surface (see Error!
Reference source not found.5). As can be seen, the tangential stress reaches its maximum at a depth
equal to about half of the contact area radius. The rolling through the latter generates an inversion of
the stress giving rise to a purely alternating main component responsible for surface fatigue.
Figure 6. The tangential stress after and before rolling contact.
2.3. Method for Surface Fatigue Damage Evaluation
Contact fatigue or surface fatigue is a particular phenomenon of fatigue that presents itself with
characteristics different from the traditional ones and leads to the early and sometimes catastrophic
wear and tear of the affected components. It is characterized by the formation of cavities on the
surface, generally small, which can, however, grow, resulting in a characterization of the surface
itself. Surface fatigue breaks derive from the repeated application of loads that produce stresses onMetals 2019, 9, 455 9 of 20
the surfaces in contact and below them. The forms of damage due to superficial fatigue are pitting or
spalling.
Surface fatigue resistance depends mostly on the surface resistance of the material, and
therefore, it is necessary to readapt formulas generally used in classical fatigue before using them
also for the evaluation of surface fatigue life.
The most used law for calculating the fatigue damage is the linear accumulation law of
Palmgren-Miner [32,39,40]. This theory states that the component fatigue failure occurs when the
cumulative damage is equal to one, i.e., when 100% of available life has been "consumed". The
Palmgren-Miner rule is expressed as follows:
= , (20)
!
where is the number of cycles to which the component is subject to a certain value of alternating
stress and is the number of cycles at which, given the value of alternating stress, the component
is able to resist. This value is uniquely determined by the Wöhler curve (fatigue strength curve) which
is described by the following Equation:
= ∙ , (21)
Parameters and respectively represent the intercept and slope of the above curve. For the
calculation of the damage, however, it is convenient to rearrange Equation (21) as follows:
σ , / (22)
= ,
where σ , is the alternating stress value to which the component is subjected, obtainable by a cycle
counting algorithms. Substituting Equation (22) in Equation (20), it is possible to obtain the following
formula that is most useful for calculating the fatigue damage:
(23)
= /
,
σ ,
Equation (23) is the most used formula for calculating the classical fatigue life of a component
subjected to fluctuating loads over time. With some consideration, it is possible to use both the fatigue
curve formulation and the damage formula to surface fatigue problems.
Considering what was stated in Section 2.2, when two bodies are forced to roll against each
other, an inversion of the tangential stress occurs. This fact makes possible the hypothesis that the
bodies are subjected to a purely alternate stress state (Figure 6).
Recalling the Tresca criterion [41,42], which states that the surface stress is twice the maximum
tangential stress and taking advantage of the previous hypothesis, it is possible to affirm that even
the surface stress is purely alternate, and therefore, it is the alternating stress of Equation (22) and
Equation (23) (σ = 2 ∙ τ ). The previous equations are indeed still valid. In Equation (23), is
the number of cycles to which the component is subjected and σ , = σ is the alternating stress at
the th cycles.
Recalling what was stated in Section 2.2, i.e., that the maximum tangential stress is 0.3 times the
maximum pressure (τ = 0.3 ∙ ), it is possible to rewrite Equation (21) and Equation (23) as a
function of the contact pressure. In such a way, it is possible to evaluate the fatigue life of the
component directly from the computed contact pressures.
The fatigue strength curve, expressed as a function of the contact pressure, is therefore described
by the following equation:
= ∙ , (24)
where is the fatigue limit in terms of pressure and = . . As a consequence, Equation (23) can
also be rearranged as well as a function of the contact pressure, as shown in Equation (25).
= /
, (25)
As in Equation (23), is the number of impulses to which the component is subject and is
the pressure generated by the th impulse.Metals 2019, 9, 455 10 of 20
With the previous formulas, it is possible to write the fatigue strength curve of the material
according to both the surface stress and the contact pressure. The same is valid for the formula used
to calculate the surface fatigue damage.
3. Theoretical vs. Numerical: The Birth of a Hybrid Method
In the previous paragraph, the theoretical approach for contact stress evaluation and contact
fatigue prediction was briefly explained. The theoretical method exploits the kinematical laws [43]
and the Hertz theory [27], determining the surface fatigue life of the component. A second option
that can be followed by the mechanical designer is a completely numerical approach that, exploiting
the potentialities of explicit dynamic analysis codes, allows the very accurate determination of both
the forces and the contact pressures. To demonstrate the potentials and limitations of both
approaches, a simple test case has been analyzed, i.e., a sphere that falls from a 26-mm height on a
plane, determining both impact forces and contact pressures. To this aim, the inputs shown in Table
1 were considered.
It has been imposed that the sphere falls perpendicular to the plane and, therefore, with an angle
of 90°. From the inputs of Table 1 the estimated impact velocity is 520 mm/s. Taking advantage of
the equations described in Section 2.1, a contact force of 77.7 N and a maximum contact pressure of
2624 MPa was determined.
Table 1. The geometrical and material parameters used in the simulation.
Description Symbol Value Unit
Sphere diameter 6.3 mm
Curvature radius (First direction) 3.15 mm
Sphere Curvature radius (Second direction) 3.15 mm
(Mat. 100 Weight 0.001 Kg
Kg
Cr6) Density 7.85 × 10
mm
Young modulus 205,000 MPa
Poisson coefficient 0.3 -
Curvature radius (First direction) +∞ mm
Plane
Curvature radius (Second direction) +∞ mm
(Mat. 17–
Young modulus 196,500 MPa
4 PH)
Poisson coefficient 0.27 -
The same case study was reproduced in an explicit finite element environment (LS-DYNA FEM
code) in which the same parameters previously obtained were evaluated. Figure 7 shows the initial
instant of the simulation and the used mesh. 4-node tetrahedral elements were used both for the
sphere and for the impact plane. The simulation foresees 1,199,262 elements and 4,797,048 nodes. To
model the contact between two bodies, the contact type “automatic surface to surface” available in
LS-DYNA was used.
To reduce the calculation effort, the sphere was placed near the contact plane and the analytically
calculated initial velocity was set. This allowed for a drastic reduction in the calculation effort.
Figure 8 shows the trends of the contact force obtained from the numerical analysis as the mesh
size changes. The obtained results show that the mesh has a negligible influence on the calculation of
the contact force. The obtained force values are identical to those theoretically obtained. Figure 9
instead shows the contact pressure trends obtained from the numerical analysis when the mesh
dimensions vary.Metals 2019, 9, 455 11 of 20
Figure 7. The initial position of the sphere in a dynamic simulation.
Contact [N]
Figure 8. A comparison between the theoretical and numerical impact forces obtained for different
mesh size.
Contact pressure [MPa]
Figure 9. A comparison between the theoretical and numerical contact pressure obtained for
different mesh sizes.Metals 2019, 9, 455 12 of 20
It is clear that when the mesh varies, the results are significantly different. To get results close to
the theoretical ones, it is necessary to use a very fine mesh. This fact is directly related to the
calculation time necessary for the simulation, which is as much larger as the mesh is finer.
From the results thus obtained, one might think that a completely theoretical approach may be
sufficient to determine both impact forces and contact pressures without the aid of explicit FEM
codes. It is important to highlight, however, that, to accurately determine both impact forces and
contact pressures exploiting theoretical laws, it is necessary to assess a set of variables such as the
trajectory of the bodies, the speed of impact, the radii of curvatures, the stiffness of the bodies, etc. In
complex real models these variables are not a priori known since they are random variable. For this
reason, a suitable way would be a stochastic approach.
In this context, the hybrid method proposed in this activity represents a way out to bypass the
weakness of previously described approaches. Exploiting the potentialities of the finite element
analysis software (where initial variables are automatically known), it is possible to obtain contact
forces in a relatively short time, since forces are sufficiently independent from the mesh size. Once
contact forces are known, contact stresses can be accurately computed using the Hertz theory [27]
(See Section 2.2) and the fatigue life can be easily addressed. In such a way, it is possible to not deal
with such complex models to often not be feasible. In Figure 10a summarizing flow chart is proposed.
Figure 10. A flow chart summarizing the theoretical and numerical methods (white boxes) and the
proposed approach (grey boxes).Metals 2019, 9, 455 13 of 20
4. Test Case
To evaluate the goodness of the proposed hybrid method for calculating the surface fatigue life
of stainless-steel components, an explicit finite elements analysis was performed on the recirculating
system of a ball screw using LS-DYNA FEM code. It often happens that these components, due to
their function, are subjected to a series of impulses that may cause surface fatigue problems. The
recirculating ball screw used in this activity is an existing ball screw used in different applications.
This has a center sphere diameter of 40 mm, a screw pitch equal to 20 mm, a sphere diameter of
6.35 mm, and a radial insert. Since attention was paid to the recirculation system and, therefore, only
to an evaluation of the fatigue life of the recirculating mechanism only to reduce the simulation effort,
it was decided to model only the ball screw and ball-nut surfaces that act as a guide for the sphere
through shell elements. A total of 57,918 elements and 231,672 were used to mesh the ball screw and
ball-nut surfaces. The sphere and the insert have been modelled with solid 4-node tetrahedral
elements. A total of 246,533 element and 986,132 nodes were used for the sphere and the recirculating
mechanism. This allowed for a good approximation in the curvature, both of the sphere and of the
recirculation mechanism, thus obtaining a good approximation with regard to the physics of the
impact that has been simulated. In this activity, the roughness of cooperating surfaces was set equal
to zero due to the accuracy of the manufacturing process.
The following figure shows the model used for this analysis.
Ball
Recirculating mechanism
Ball-nut thread
Ball-screw thread
Figure 11. The finite element model of the recirculating mechanism.
The recirculating mechanism of Figure 11 is made of 17–4 PH steel: 17–4 PH stainless steel is, in
fact, one of the steels obtained by precipitation and hardening most used in aeronautics. In fact, this
material, besides being stainless, offers excellent mechanical characteristics. Table 2 summarizes
some features of the material.
Table 2. The 17–4 PH material parameters.
Description Symbol Value Unit
Young Modulus 196,500 MPa
Poisson Modulus 0.27 -
Density 7700 Kg/m
Ultimate tensile strength 1241 MPa
Yield strength 993 MPa
Hardness Brinell 388 -Metals 2019, 9, 455 14 of 20
Error! Reference source not found.12 shows the mesh obtained with the parameters previously
illustrated.
(a) (b)
Figure 12. Detailed views of the mesh: (a) sphere and (b) a recirculating mechanism.
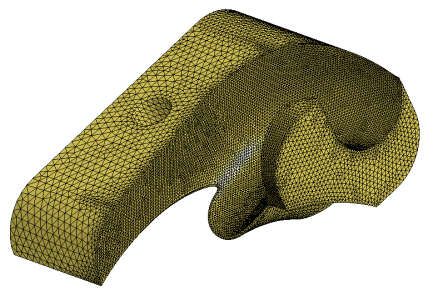
About the boundary conditions, the recirculating system has been fixed in correspondence with
the hole. This hole is, in fact, used to fasten the recirculation mechanism on the seat obtained in the
ball nut. Furthermore, five degrees of freedom of the ball nut were constrained (three rotations and
two displacement), as this system is a rotating ball screw. The principal inertia tensor and the mass
of the total ball screw were assigned to the ball-screw surface with the aim of reproducing the real
movement of the ball screw itself. This means that the ball screw only rotates while the ball nut
performs a linear motion. A rotation speed of the screw was set equal to 3000 RPM. The contact type
“automatic surface to surface” allowable in LS-DYNA was used to model the contact between the
sphere and the recirculating mechanism.
To model the system as more realistic as possible, it is necessary to consider also a viscosity
dissipation inherent the material. For this purpose, a percentage damping ξ = 0.02 was imposed in
a frequency range between 1000 Hz and 50,000 Hz . This frequency range was taken into
consideration following a modal analysis of the recirculation system only, imposing the same
conditions of constraint of the dynamic analysis. What emerged from the modal analysis is that the
vibrating modes that mostly participate in the total vibration are the first 7 and are all in the range
between 1000 Hz and 50,000 Hz.
Figure 13. The impact forces by FE explicit analysis.Metals 2019, 9, 455 15 of 20
The impact forces used to evaluate the surface fatigue life were extrapolated from the performed
simulation. Figure13 shows the trend of the impact force as a function of time. As visible, the
maximum value is equal to about 120 N. To evaluate the fatigue life of the component, first the
fatigue strength curves expressed in terms of alternating surface stress and alternating pressure were
first obtained for three different level of reliability, equal to 10%, 50%, and 90%, adopting Equation
(21) shown in Section 2.3 and using the characteristics of the material shown in Table 2. Starting from
the hardness of the material, corresponding to 388 MPa, the surface ultimate stress of the
material was obtained according the Equation (29).
= 3.45,∙ = 1458.6 MPa, (29)
The fatigue strength curves, both in terms of the alternating stress and contact pressure are
shown in Figure 14. As shown in Figure 14 for the slope of the fatigue curve after 10 cycles, the
hypothesis of Hybach [31,41] was taken into account. The Hybach hypothesis states that the slope of
the fatigue curve after 10 cycles is one third of the slope of the previous stretch.
The ball screw in question has been used for a total duration of 140 km. Considering a screw
pitch equal to 20 mm and a number of spheres per turn equal to 8, the total duration in number of
cycles corresponds to 5.6 × 10 cycles. The alternating surface stress and contact pressure values
obtainable from the curves of Figure 14 are shown in Table 3 for the different considered reliability
values.
Table 3. The alternating strength and contact pressure for the designed number of cycles.
Reliability Number of cycles Alternating strength Pressure
(%) - (MPa) (MPa)
10 5.6 × 10 866.1 1443
50 5.6 × 10 658.1 1095
90 5.6 × 10 454.3 757.2
The values shown in Table 3 are also graphically shown in Figure 15 by the yellow dots. In order
to estimate the surface fatigue life, it is still necessary to calculate the semiaxes of the contact ellipse
using the Hertz theory (Section 2.1). From the 3D model, three different combinations of the curvature
radii at the contact point have been calculated as shown in Table 4. Applying the maximum force
obtained by the simulation, equal to 120 N, and considering the obtained curvature radii, it was
possible to estimate the maximum alternating stress and the maximum pressure. These values are
shown in Table 4.
Table 4. The alternating stress and contact pressure for the considered curvature radii with a contact
force equal to 120 N.
Sphere Curvature Recirculating Mechanism Alternating Contact Pressure
ID
Radius (mm) Curvature Radius (mm) Stress (MPa) (MPa)
1 3.375 3.625 342.6 571
2 3.375 3.75 380.4 634
3 3.375 3.875 414.6 691Metals 2019, 9, 455 16 of 20
(a)
(b)
Figure 14. The fatigue curve for the recirculating mechanism: (a) The fatigue curve in terms of
alternating stress and (b) the fatigue curve in terms of pressure.
By tracing these values in the fatigue strength curves, it is possible to determine from the
intersection with the curves the number of cycles to which the component can withstand for the three
reliability values considered in terms of both the maximum alternating stress and the maximum
pressure as shown in Figure 15. The obtained cycles at each surface stress values or contact pressure
are shown in Table 5 for all the reliability values considered.
As shown in Figure 15 and in Table 5, these values attest that no surface fatigue problems are
expected for this component. This fact was also found on the real recirculating mechanism, where no
surface fatigue problem was detected by a visual inspection.Metals 2019, 9, 455 17 of 20
(a)
(b)
Figure 15. Comparisons between the working point obtained by the hybrid approach and the real
ones: (a) the working point in terms of alternating stress and (b) the working points in terms of
pressure.
Table 5. The estimated allowable number of cycles for the considered curvature radii pairs and
reliability levels.
Alternating Stress Contact Pressure Number of Reliability
ID
(MPa) (MPa) Cycles (%)
2.06 × 10 10
1 342.6 571 7.75 × 10 50
5.45 × 10 90
1.78 × 10 10
2 380.4 634 1.68 × 10 50
4.64 × 10 90
4.01 × 10 10
3 414.6 691 7.09 × 10 50
6.27 × 10 90Metals 2019, 9, 455 18 of 20
5. Conclusions
Stainless steels are necessarily used in all sectors, from aerospace to medical, where mechanical
components find themselves working in environmental conditions full of aggressive substances that
can affect the mechanical properties of the component itself. The antioxidant properties of such steels
are due to the surface film that is created thanks to a chemical reaction between chromium and
oxygen. Although stainless steels are, by nature, self-passivating, i.e., the protective film
spontaneously recreates thanks to a chemical reaction between oxygen and chrome, problems related
to a degradation of the surface can lead to a slowing down the self-passivation process or, in the worst
cases, to a total loss of antioxidant properties. One of the main causes of surface deterioration is
related to surface fatigue issues. When two or more evolving bodies are working against each other,
a stress state is generated on the surface, which can cause opening cracks. The two most common
phenomena are pitting and spalling. To minimize the probability of occurrences of this phenomenon,
it is necessary that, at least during the design stage, the surface resistance of the component is verified.
The evaluation of surface fatigue strength can be addressed with two different approaches. The
first one is a completely theoretical approach which, merging the impact dynamic laws and the Hertz
theory, allows an estimation of the contact stresses and, therefore, an evaluation of the fatigue life of
the component. However, this approach requires an assessment of a set of variables, such as bodies
trajectory, velocity, stiffness, and curvature radii, in order to obtained accurate results. If these
quantities are known, the theoretical approach allows for an accurate estimate of both the impact
forces and the contact stresses. The determination of these quantities tends to be, however,
particularly complex in real models in which all the abovementioned quantities are random variables.
In this context, the second possible approach for the estimation of surface fatigue strength is a
completely numerical approach. This, exploiting the potentialities of the finite element codes, allows
the drawbacks of the theoretical approach to be overcome regardless of the complexity of the model.
The major drawback of this approach is the need to use meshes so fine that makes the simulation not
always feasible.
To merge the benefits of both approaches, in this activity, a hybrid theoretical-numerical
calculation method has been proposed, which allows a drastic reduction in the calculation effort
obtaining, at the same time, accurate results. This method exploits the potentialities of finite element
software to determine the impact forces, bypassing the inconvenience of assessing dynamic variables
hardly a priori known. Once the impact forces are assessed, classical formulas of Hertz theory and
fatigue are used to evaluate the fatigue life of the component. This possibility raised a comparison of
the results obtained by an explicit finite element analysis and the theoretical results for a simple case
study, a sphere-plane impact, for different mesh sizes. From the comparison carried out, it was
highlighted that the force values obtained are independent from the mesh size and very close to,
almost identical, those obtained by using the shock theory. It is not valid instead in the case of contact
pressures where results are strongly influenced by mesh size. This means that to obtain the pressure
and/or contact stress directly from a numerical simulation, a fine mesh is necessary.
The main advantage of the proposed method is to drastically reduce the calculation effort while
obtaining results consistent with reality as well. Given these aspects, the proposed calculation
method is aimed to all those realities in which it is necessary to reduce the computational effort as
much as possible without precluding the goodness of the results.
The proposed hybrid method was then validated on an aeronautical component, a recirculation
system of a ball screw. This component, in fact, is subjected to many shocks due to the balls that it is
often subjected to surface fatigue problems. The obtained results show how it is possible to obtain
realistic results in terms of fatigue life with relatively short calculation times.
Author Contributions: Methodology and supervision, F.C.; software and validation, M.C., M.P., and G.Z.;
writing—review and editing, F.C., M.P., and G.Z.
Funding: The research received no external funding.
Conflicts of Interest: The authors declare no conflict of interest.Metals 2019, 9, 455 19 of 20
References
1. Rufini, R.; Di Pietro, O.; Di Schino, A. Predictive Simulation of Plastic Processing of Welded Stainless Steel
Pipes. Metals 2018, 8, 519.
2. Ciuffini, A.F.; Barella, S.; Di Cecca, C.; Di Schino, A.; Gruttadauria, A.; Napoli, G.; Mapelli, C.
Transformation-Induced Plasticity in Super Duplex Stainless Steel F55- UNS S32760. Metals 2019, 9, 191.
3. Corradi, M.; Di Schino, A.; Borri, A.; Rufini, R. A review of the use of stainless steel for masonry repair and
reinforcement. Constr. Build. Mater. 2018, 181, 335–346.
4. Di Schino, A.; Porcu, G.; Turconi, G.L. Tenaris: Metallurgical design and development of C125 grade for
mild sour service application. In Proceedings of the Corrosion 2006, San Diego, CA, USA, 12–16 March
2006; pp. 1–14.
5. Aurégan, G.; Fridrici, V.; Kapsa, P.; Rodrigues, F. Experimental simulation of rolling-sliding contact for
application to planetary roller screw mechanism. Wear 2015, 332–333, 1176–1184.
6. Talha, M.; Behera, C.K.; Sinha, O.P. A review on nickel-free nitrogen containing austenitic stainless steels
for biomedical applications. Mater. Sci. Eng. C 2013, 33, 3563–3575.
7. Yang, K.; Ren, Y. Nickel-free austenitic stainless steels for medical applications. Sci. Technol. Adv. Mater.
2010, 11, 1–13.
8. Boulané-Petermann, L. Processes of bioadhesion on stainless steel surfaces and cleanability: A review with
special reference to the food industry. Biofouling 1996, 10, 275–300.
9. Schweitzer, P.A. Fundamentals of Metallic Corrosion: Atmospheric and Media Corrosion of Metals. Corrosion
Engineering Handbook; CRC Press/Taylor & Francis Group: Boca Raton, FL, USA, 2006; ISBN 0849382432 .
10. Okamoto, G. Passive film of 18-8 stainless steel structure and its function. Corros. Sci. 1973, 13, 471–489.
11. Zheng, Z.B.; Zheng, Y.G. Effects of surface treatments on the corrosion and erosion-corrosion of 304
stainless steel in 3.5% NaCl solution. Corros. Sci. 2016, 112, 657–668.
12. Olefjord, I.; Wegrelius, L. The influence of nitrogen on the passivation of stainless steels. Corros. Sci. 1996,
38, 1203–1220.
13. Barbosa, M.A. The pitting resistance of AISI 316 stainless steel passivated in diluted nitric acid. Corros. Sci.
1983, 23, 1293–1305.
14. Arrabal, R.; Pardo, A.; Merino, M.C.; Coy, A.E.; Viejo, F.; Matykina, E. Effect of Mo and Mn additions on
the corrosion behaviour of AISI 304 and 316 stainless steels in H2SO4. Corros. Sci. 2008, 50, 780–794.
15. Kemp, M.; van Bennekom, A.; Robinson, F.P.A. Evaluation of the corrosion and mechanical properties of a
range of experimental CrMn stainless steels. Mater. Sci. Eng. A 1995, 199, 183–194.
16. Pohjanne, P.; Carpén, L.; Hakkarainen, T.; Kinnunen, P. A method to predict pitting corrosion of stainless
steels in evaporative conditions. J. Constr. Steel Res. 2008, 64, 1325–1331.
17. Greiner, R.; Kettler, M. Interaction of bending and axial compression of stainless steel members. J. Constr.
Steel Res. 2008, 64, 1217–1224.
18. Luecke, W.E.; Slotwinski, J.A. Mechanical Properties of Austenitic Stainless Steel Made by Additive
Manufacturing. J. Res. Natl. Inst. Stand. Technol. 2014, 119, 398–418.
19. Nezhadfar, P.D.; Shrestha, R.; Phan, N.; Shamsaei, N. Fatigue behavior of additively manufactured 17-4 PH
stainless steel: Synergistic effects of surface roughness and heat treatment. Int. J. Fatigue 2019, 124, 188–204.
20. Siddiqui, S.F.; Fasoro, A.A.; Cole, C.; Gordon, A.P. Mechanical Characterization and Modeling of Direct
Metal Laser Sintered Stainless Steel GP1. J. Eng. Mater. Technol. 2019, 141, 031009.
21. Wang, Y.; Charbal, A.; Hild, F.; Roux, S.; Vincent, L. Crack initiation and propagation under thermal fatigue
of austenitic stainless steel. Int. J. Fatigue 2019, 124, 149–166.
22. Carneiro, L.; Jalalahmadi, B.; Ashtekar, A.; Jiang, Y. Cyclic deformation and fatigue behavior of additively
manufactured 17–4 PH stainless steel. Int. J. Fatigue 2019, 123, 22–30.
23. Murakami, Y.; Klinger, C.; Madia, M.; Zerbst, U.; Bettge, D. Defects as a root cause of fatigue failure of
metallic components. III: Cavities, dents, corrosion pits, scratches. Eng. Fail. Anal. 2019, 97, 759–776.
24. Totten, G.E. Friction, Lubrication, and Wear Technology; ASM International: Ohio, USA, 2018; Volume 18,
ISBN 978-1-62708-192-4.
25. Kattelus, J.; Miettinen, J.; Lehtovaara, A. Detection of gear pitting failure progression with on-line particle
monitoring. Tribol. Int. 2018, 118, 458–464.
26. Barber, J.; Ciavarella, M. Contact mechanics. Int. J. Solids Struct. 2000, 37, 29–43.
27. Hertz, H. On the contact of rigid elastic solids. J. fur die Reine und Angew. Math. 1882, 92, 156–171.
28. Bathe, K.-J. Finite Element Procedures; Prentice Hall, Pearson Education, Inc. Watertown, USA, 2016; ISBNMetals 2019, 9, 455 20 of 20
9780979004957.
29. de los Rios, E.R.; Walley, A.; Milan, M.T.; Hammersley, G. Fatigue crack initiation and propagation on shot-
peened surfaces in A316 stainless steel. Int. J. Fatigue 1995, 17, 493–499.
30. Maiya, P.S.; Busch, D.E. Effect of surface roughness on low-cycle fatigue behavior of type 304 stainless steel.
Metall. Trans. A 1975, 6, 1543–1940.
31. Huang, H.W.; Wang, Z.B.; Lu, J.; Lu, K. Fatigue behaviors of AISI 316L stainless steel with a gradient
nanostructured surface layer. Acta Mater. 2015, 87, 150–160.
32. Fatemi, A.; Yang, L. Cumulative fatigue damage and life prediction theories: A survey of the state of the
art for homogeneous materials. Int. J. Fatigue 1998, 20, 9–34.
33. Wei, C.C.; Lin, J.F. Kinematic Analysis of the Ball Screw Mechanism Considering Variable Contact Angles
and Elastic Deformations. J. Mech. Des. 2004, 125, 717–733.
34. Lin, M.C.; Ravani, B.; Velinsky, S.A. Kinematics of the Ball Screw Mechanism. J. Mech. Des. 2008, 116, 849–
855.
35. Jiang, H.; Song, X.; Xu, X.; Tang, W.; Zhang, C.; Han, Y. Multibody dynamics simulation of balls impact-
contact mechanics in ball screw mechanism. In Proceedings of the International Conference on Electrical
and Control Engineering (ICECE 2010), Wuhan, China, 25–27 June 2010.
36. Braccesi, C.; Landi, L. A general elastic-plastic approach to impact analisys for stress state limit evaluation
in ball screw bearings return system. Int. J. Impact Eng. 2007, 34, 1272–1285.
37. Zhang, Z.Y.; Zhang, W.L.; Xu, C. Research on the Impact between Balls and Re-Circulating Mechanism of
Ball Screws. Appl. Mech. Mater. 2014, 551, 370–377.
38. Hung, J.P.; Wu, J.S.-S.; Chiu, J.Y. Impact failure analysis of re-circulating mechanism in ball screw. Eng.
Fail. Anal. 2004, 11, 561–573.
39. Braccesi, C.; Cianetti, F.; Lori, G.; Pioli, D. An equivalent uniaxial stress process for fatigue life estimation
of mechanical components under multiaxial stress conditions. Int. J. Fatigue 2008, 30, 1479–1497.
40. Braccesi, C.; Morettini, G.; Cianetti, F.; Palmieri, M. Development of a new simple energy method for life
prediction in multiaxial fatigue. Int. J. Fatigue 2018, 112, 1–8.
41. Budynas, R.G.; Nisbett, J.K. Shigley’s Mechanical Engineering Design, Eighth Edition; McGraw-Hill: New
York, NY, USA, 2008, ISBN 0390764876.
42. Collins, J.A.; Smith, C.O. Failure of Materials in Mechanical Design; Wiley Interscience: New York, NY, USA,
1993, ISBN 0471558915.
43. Shabana, A.A. Dynamics of Multibody Systems; Cambridge University Press: Chicago, IL, USA, 2009; ISBN
9781107337213.
© 2019 by the authors. Licensee MDPI, Basel, Switzerland. This article is an open access
article distributed under the terms and conditions of the Creative Commons Attribution
(CC BY) license (http://creativecommons.org/licenses/by/4.0/).You can also read