Microstructural degradation during the storage of biomass pellets
←
→
Page content transcription
If your browser does not render page correctly, please read the page content below
ARTICLE
                  https://doi.org/10.1038/s43246-020-00113-y                OPEN

                  Microstructural degradation during the storage of
                  biomass pellets
                  Luis Cutz       1 ✉,   Urša Tiringer2, Hamid Gilvari              3,   Dingena Schott          3,   Arjan Mol      2   & Wiebren de Jong             1✉
1234567890():,;

                  The use of biomass pellets as a source of renewable energy has increased in recent times.
                  However, pellet storage during transportation can compromise their properties, due to
                  fluctuating temperature and humid environments. Here, we show that extended storage of
                  one month at 40 °C and 85% relative humidity causes significant biomass pellet degradation.
                  This was evidenced by higher pellet porosity, weight gain, increased inclusion body formation
                  and creation of an internal network of cracks. We quantify the inclusion and pore growth
                  processes at the surface and within the pellets, which has implications for subsequent
                  thermochemical conversion. The global bioenergy transition may depend upon biomass
                  pellets, and this study shows that storage conditions are critical in the supply chain, so to
                  maintain their quality. Without the development of stronger policies to avoid premature
                  degradation of biomass pellets, they may not realize their full potential as a bioenergy source.

                  1 Section
                          of Large-Scale Energy Storage (LSE), Department of Process & Energy, Faculty of Mechanical, Maritime and Materials Engineering, Delft University
                  of Technology, Delft, The Netherlands. 2 Section of Corrosion Technology and Electrochemistry, Department of Materials Science and Engineering, Faculty of
                  Mechanical, Maritime and Materials Engineering, Delft University of Technology, Delft, The Netherlands. 3 Section of Transport Engineering and Logistics,
                  Department of Maritime & Transport Technology, Faculty of Mechanical, Maritime and Materials Engineering, Delft University of Technology, Delft, The
                  Netherlands. ✉email: luis.cutz@tudelft.nl; Wiebren.deJong@tudelft.nl

                  COMMUNICATIONS MATERIALS | (2021)2:2 | https://doi.org/10.1038/s43246-020-00113-y | www.nature.com/commsmat                                             1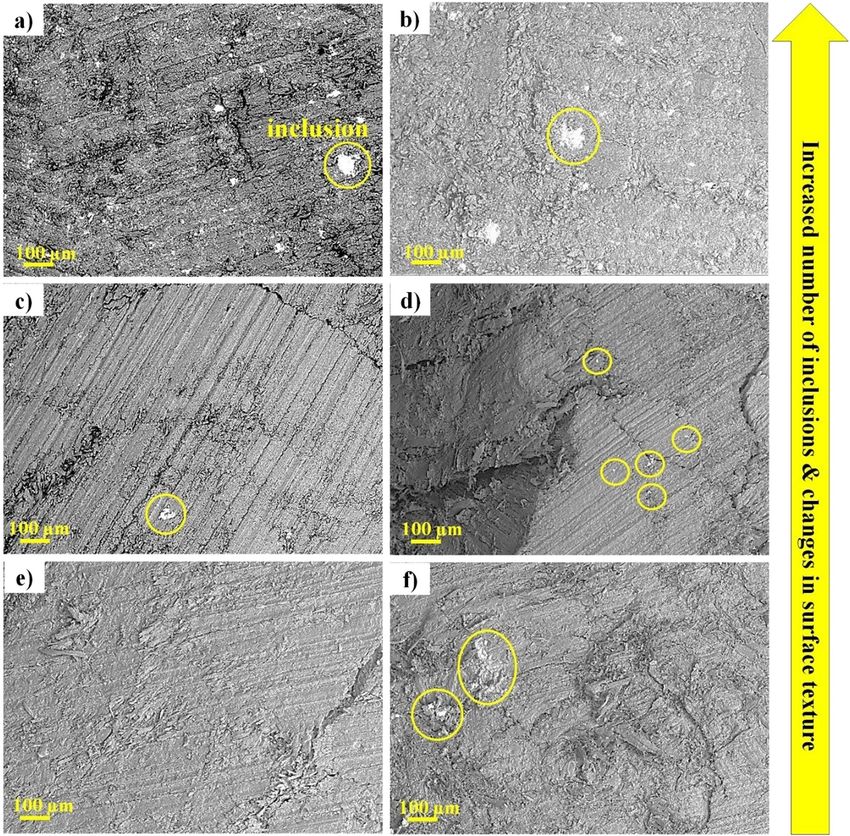
ARTICLE                                                              COMMUNICATIONS MATERIALS | https://doi.org/10.1038/s43246-020-00113-y

T
        he use of biomass as a renewable fuel has increased sharply           content (proximate and ultimate analysis), moisture sorption,
        during the last decade as a result of the concern of                  mechanical strength and heating value. In the present work we
        high anthropogenic emissions1. However, due to the                    provide insights on pellets degradation during storage at relatively
challenges in establishing sustainable supply chains for biomass,             high but possible temperature. To this end, we studied two
its heterogeneity, and the inherent physicochemical properties of             untreated and one type of torrefied wood pellets stored in a cli-
biomass feedstock, such as low bulk density and high moisture                 mate chamber, during a period of one month at a constant
content, biomass implementation has not grown as originally                   condition of 40 °C and 85% relative humidity (RH). By the use of
anticipated2,3. To overcome these challenges and to make raw                  digital microscopy, scanning electron microscopy equipped with
biomass easier to handle, pretreatment processes and pelletization            energy dispersive X-ray spectroscopy (SEM-EDS) and high-
are used to improve its quality for later use in residential heating,         resolution micro-computed tomography (micro-CT), we study
large-scale electricity generation and as renewable carbon feed-              surface, structural and chemical changes in biomass pellets,
stock for the chemical industry4. However, many countries do not              resulting from storage. We demonstrate the expansion of pre-
have a large potential of biomass resources or have only marginal             existing fractures and the growth mechanism of inclusions at the
land available for biomass production, which has rocked the                   surface and inside the cracks of biomass pellets as a result of
global biomass pellet market and trade (Fig. 1).                              storage conditions. Ensuring the quality parameters of biomass
   A considerable amount of the overall global consumption of                 pellets and avoiding premature degradation are crucial for
pellets are traded from the Americas to Europe and Asia, around               increasing the adoption of biomass and to avoid costly mod-
one third in 20185. In 2018 the global demand of pellets for                  ifications to the existing infrastructure, especially in large-scale
heating and industrial purposes totalled 34 million tonnes and it             power generation.
is expected to increase to around 69 million tonnes, by 20256.
Depending on the transportation type, transport distance and
storage conditions, biomass pellets are being stored for a period             Results and discussion
from up to one week or to three months in a fluctuating tem-                   The effect of storage conditions on the development of biomass
perature and humidity environment7. Storage during extended                   pellet surface damage. Optical images of the three types of pellets
periods of time, especially at high temperatures8–11, accelerates             studied before and after storage are presented in Fig. 2. Pellet
the degradation of pellets, reducing the quality of the fuel and              surface damage is typically present in the form of cracks and
consequently the fuel conversion behavior12. Recently, coupling               damage (e.g., regions with different surface texture and color),
advanced pretreatment processes4, such as torrefaction with                   from now on referred to as damage. The damage analysis for all
pelletization, have opened new frontiers to enhance the physi-                nine samples is provided in Supplementary Note 3, Supplemen-
cochemical properties of raw biomass to stand the current                     tary Fig. 1 and Supplementary Table 3.
environmental conditions during transport and storage4,13.                       Figure 2 illustrates that all fresh pellets already exhibit large
However, similar problems as those observed in untreated bio-                 areas of damage at the surface before being exposed to the storage
mass pellets, such as particle breakage and moisture-induced                  conditions. Results show that after storage at 40 °C and 85% RH,
damage, are still present during logistics of torrefied pellets,               all biomass pellets are heavily damaged at the surface. Surface
leading to structural degradation13. Biomass degradation, espe-               degradation due to the storage is attributed to breakage of bonds,
cially when dealing with large volume of pellets, can lead to self-           expansion of pre-existing cracks into networks of cracks (creep
heating, spontaneous combustion, pellet attrition, equipment                  damage) and de-cohesion of fibers21. After storage, the damaged
fouling, and numerous health threats to workers exposed to dust               area with respect to the total area of the front surface of all pellets
particles9,14–17.                                                             (area ratio), increased in average by 5%. Of all samples, wood
   To the best of our knowledge, limited studies have focused on              pellets type II were the most affected at the surface level (Fig. 2f).
studying qualitatively the morphological modifications at the                     The presence of large longitudinal cracks at the pellet surface
surface of biomass pellets18,19 and quasi in situ quantification of            is not necessarily predictive for strength reduction as it also
changes in their physicochemical properties resulting from                    depends on their in-depth growth. Cracks related to pellet
storage8,20. Typical investigated properties are density, chemical            breakage are more likely to occur in radial direction due to the

Fig. 1 Global volume of pellets traded in 2018. Light blue arrows represent the traded volume of pellets between regions. The traded volume of pellets in
million tonnes was extracted from Bioenergy Europe Statistical Report5. Other Europe refers to Albania, Bosnia and Herzegovina, Belarus, Switzerland,
Montenegro, Norway, Serbia, Russia, and Ukraine. Average temperature data were extracted from Climate Research Unit (CRU)50.

2                         COMMUNICATIONS MATERIALS | (2021)2:2 | https://doi.org/10.1038/s43246-020-00113-y | www.nature.com/commsmat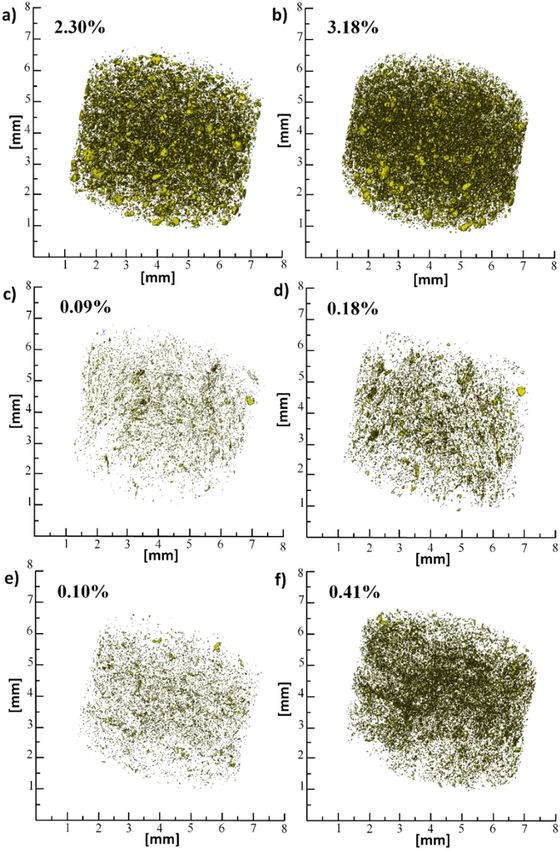
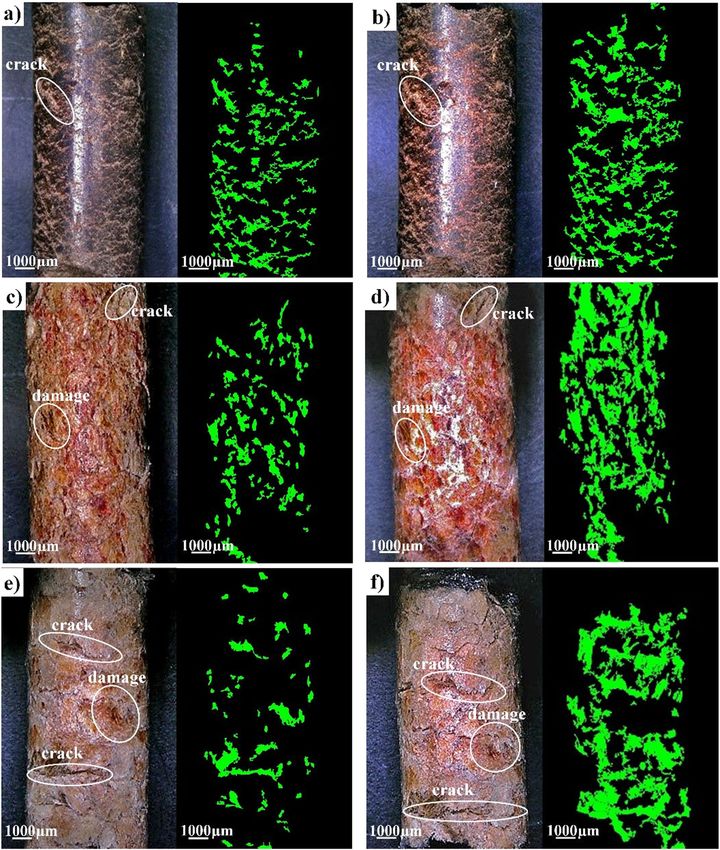
COMMUNICATIONS MATERIALS | https://doi.org/10.1038/s43246-020-00113-y                                                               ARTICLE

Fig. 2 Digital images and corresponded determined damage area of pellets. a, b Torrefied pellet (tor_sample3) before storage (a) and after 1 month of
storage (b). c, d Wood pellet type I (wp1_sample3) before storage (c) and after 1 month of storage (d). e, f Wood pellet type II (wp2_sample3) before
storage (e) and after 1 month of storage (f). Surface damage is highlighted in green.

high length-to-cross-section ratio of pellets9. Thus, to monitor the           depth (Supplementary Fig. 2). Cracks start to form at the surface
expansion of cracks, we performed a three-dimensional (3D)                     and the mean apparent depth of their penetration with respect to
surface profile analysis of pellets at different storage times using            the diameter of the pellet is 9% for torrefied pellets, 7% for wood
digital microscopy. The mean apparent crack depth at the pellet                pellets type I and 9% for wood pellets type II (Fig. 3), before
surface before storage, 2 weeks after storage and one month after              storage. We found that the mean apparent crack depth decreased
storage is provided in Fig. 3. The apparent crack depth for all                gradually after storage, 65% for torrefied pellets, 43% for wood
evaluated samples is provided in Supplementary Fig. 2.                         pellets type I and 71% for wood pellets type II, due to pellet
   We found that before storage, torrefied pellets and wood pellets             swelling. Results from the profile analysis do not necessarily
type II have deeper cracks compared to wood pellets type I. For                indicate that the apparent crack depth decreased after storage,
example, in some torrefied samples, cracks almost reached 1 mm                  but rather imply less space between the wall fibers at the surface.

COMMUNICATIONS MATERIALS | (2021)2:2 | https://doi.org/10.1038/s43246-020-00113-y | www.nature.com/commsmat                                        3
ARTICLE                                                              COMMUNICATIONS MATERIALS | https://doi.org/10.1038/s43246-020-00113-y

                                                                              regions or detachment of small particles from pellet’s surface. For
                                                                              wood pellet type II in particular, the ash content was relatively
                                                                              low (Supplementary Note 1). However, sufficient minerals
                                                                              existed in this type of pellet to produce a significant difference
                                                                              in surface morphology and texture after one month, the biggest
                                                                              compared to all other samples (Fig. 4f).
                                                                                 Increased inclusion formation has been reported in biomass
                                                                              harvest24, drying22, devolatilization25, and ash storage26. Never-
                                                                              theless, as far as the authors are concerned, no previous studies
                                                                              have quantified the formation or enlargement of inclusions
                                                                              neither at microscale during storage nor in any of the
                                                                              aforementioned stages. Inclusions are mainly observed between
                                                                              fibers or at the cracks located at the pellet surface (Fig. 4). Image
                                                                              analysis confirms inclusion growth on the pellet surface after one
                                                                              month of storage (Fig. 5). The mean number of inclusions in
                                                                              torrefied pellets increases by 80%; in wood pellets type I and II by
                                                                              650% and 700%, respectively. Detailed analysis is provided in
                                                                              Supplementary Table 4–6. Despite thermal pretreatment, SEM
                                                                              images of torrefied pellets show similar structural pattern as
Fig. 3 Mean apparent depth of the cracks observed at the surface of
                                                                              untreated biomass pellets. Nevertheless, the number of inclusions
biomass pellets at 0 days, 2 weeks, and 1 month after storage. Light blue,
                                                                              detected at their surface before storage is higher than that for
orange, and green bars represent the apparent crack depth per type of
                                                                              wood pellets due to the pretreatment method itself (Fig. 5a).
pellet in μm for 0 days, 2 weeks, and 1 month, respectively. The error bars
                                                                              Torrefaction converts a certain part of the original organic
represent the standard deviation.
                                                                              structures into new formed polymeric structures and ashes that
                                                                              later bind to the fiber wall4. In general, a higher number of
The surrounding moisture fills the interstitial volume within the              inclusions could limit diffusion into and from the biomass pellet,
biomass fibers at the surface of all pellets and expands them due              affecting the transfer of the surrounding medium (e.g., oxidant)
to moisture build-up, resulting in a mean increase of 0.4 mm in               to the pellet and reducing char conversion. Similar phenomena
pellet diameter (Supplementary Table 2). Swelling of pellets is               has already been reported in combustion of poplar wood and
confirmed by an average pellet diameter increase of 2% for                     wheat straw25.
torrefied pellets, 9% for wood pellet type I and 7% for wood pellet               There are four mechanisms that can explain increased
type II, after one month of storage. A relatively small radial strain         inclusion formation due to storage: (M1) mineral precipitation;
is noticed for the torrefied pellets, due to the crystalline structure         (M2) solid-gas chemical reactions; (M3) mineral transport
of the torrefied biomass microfibrils4, which hold back the                     through moist-softened polysaccharides; and (M4) agglomeration
swelling. A decrease in the apparent crack depth after storage                of inclusions. These mechanisms are further elaborated through-
might also be attributed to increased inclusion body formation as             out the manuscript. Earlier studies on the chemical composition
a result of chemical reactions (e.g., oxidation) on the edge of the           of biomass indicate that there is intensive mineral precipitation
cracks and agglomeration within the cavities and fibre walls.                  (M1) due to moisture evaporation after biomass harvesting22.
                                                                              Such mineral formations result of natural degradation could
Inclusion formation at the surface and inside the cavities/                   explain the increase in the number of inclusions detected at the
cracks of biomass pellets. We next describe the changes in                    surface of all pellets, after 1 month of storage. These minerals are
morphology and elemental composition at the pellet surface, as a              in the form of in water-soluble phosphates, carbonates, sulphates,
result of storage conditions. For simplicity, we refer to the                 chlorides, and nitrates22. When biomass is left in the field for a
microstructure of the pellets as “solid matrix” and all bright                prolonged time and combined with rainfall, these water-soluble
discernible amorphous particles as “inclusions”. Inclusions com-              salts tend to contribute to enhanced leaching of Ca, Cl, K, Mg,
prise original inorganic-forming elements in biomass such as Ca,              Na, P, and S22,24. Other mechanisms involved in inclusion growth
K, Si, Mg, Al, Fe, P, Cl, Na, Mn, and Ti22. Hence, inclusions also            (M2–M4) are linked to the inherent chemical composition of
include the new minerals or phases formed during storage. Fig. 4              biomass and will be further explained using SEM-EDS analysis
presents the scanning electron microscopy (SEM) imaging con-                  and micro-computed tomography.
ducted on pellets before storage (a, c, e) and after one month of                Biomass is generally composed of organic (cellulose, hemi-
storage (b, d, f). Searching for an optimal way to quantify                   cellulose, and lignin), inorganic constituents (e.g., amorphous
inclusions at the pellet surface after storage, we performed image            components and minerals), and fluid matter (e.g., moisture)22.
analysis of each SEM image (Fig. 5). In SEM images using                      The concentrations of each constituent depend on the type of
backscattered electron detector, elements with higher atomic                  biomass, harvest practices, and environmental conditions.
number appear brighter than those with a small atomic num-                    Furthermore, when biomass is subjected to thermochemical
ber23. Supplementary Note 4 provide SEM images and corre-                     processes (>200 °C4), new minerals or inorganic phases are
sponding image analysis for all six samples, at two different                 created, commonly referred as ash22. Ash contains forming
surface regions, before and after storage.                                    elements such as Si, K, Na, S, Cl, P, Ca, Mg, and Fe responsible for
   SEM images confirm that at micro level, untreated or torrefied               toxic particulate matter emissions, fouling and slagging14,27. To
biomass pellets, have pre-existing cracks at the surface, which is            complement morphological changes observed in pellets, we
in accordance with previous studies18. Pre-existing cracks are an             performed EDS analysis on our samples. Fig. 6 presents the
indication of poor adhesion between adjacent fibers resulting                  percentage change of mean elemental concentrations of region 1
from pelletization conditions12. After 1 month of storage, we                 and region 2, for all analyzed pellets, before storage and after one
observed changes in surface morphology and texture in all pellets             month of storage. Values presented in Fig. 6 can be interpreted as
due to moisture sorption (Fig. 4b, d, f). This could lead to pellet           enrichment/depletion of elements with respect to the conditions
abrasion9 during handling as a result of fracture of uneven                   before storage. The results are separated by the mean elemental

4                         COMMUNICATIONS MATERIALS | (2021)2:2 | https://doi.org/10.1038/s43246-020-00113-y | www.nature.com/commsmat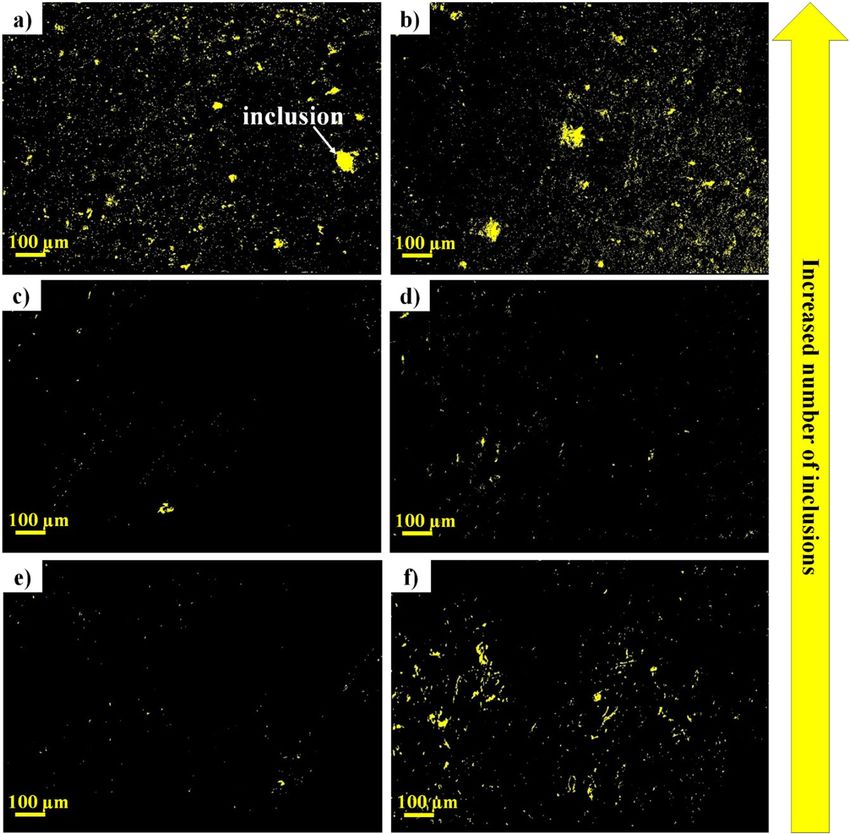
COMMUNICATIONS MATERIALS | https://doi.org/10.1038/s43246-020-00113-y                                                                  ARTICLE

Fig. 4 SEM images of samples #4 at region 1 before and after storage. a, b Torrefied pellet (tor_sample4) before storage (a) and after 1 month of storage
(b). c, d Wood pellet type I (wp1_sample4) before storage (c) and after 1 month of storage (d). e, f Wood pellet type II (wp2_sample4) before storage
(e) and after 1 month of storage (f). Yellow circles indicate example inclusions detected at the surface of the samples.

composition (at. %) of matrix (Fig. 6a, c, e) and of the inclusions            and wood pellets type I. This could be attributed to the formation
(Fig. 6b, d, f) detected at the surface of the sample pellets. Detailed        of Ca(OH)2 from CaO and moisture uptake, as has been observed
elemental analysis is provided in Supplementary Note 5.                        in studies of biomass ash storage26. Ca(OH)2 could further react
                                                                               with CO2 from air or from pellet off-gassing to produce crystal-
                                                                               line CaCO326 (M2). During thermochemical conversion, Ca
Energy dispersive X-ray spectroscopy (EDS) analysis of the                     carbonates can contribute to enhanced leaching and emission
skeletal matrix of pellets. EDS results show that C > O are the                volatile elements during combustion27. CaCO3 is known as a
major elements (>1% at.) in pellets (Supplementary Figs. 9a, c;                brittle material28, which could compromise the integrity of
10a, c; 11a, c). Meanwhile, the minor elements (1–0.1% at.) found              the pelletʼs microstructure and lead to changes in surface mor-
on average at the skeletal matrix include Si > N > Ca > Mn > Fe >              phology such as decreased particle size. This observation is
K > S for torrefied pellets, Mn > Fe > N for wood pellets type I,               backed by the decrease in the average area of the inclusions in
and N > Fe > Ca for wood pellets type II. After 1 month, EDS                   torrefied pellets and wood pellets type I, as shown in Fig. 5b, f,
measurements report on average an increase of trace elements                   Supplementary Tables 4, 5. In wood pellets type II, the mean
such as K, Si, and Mg in the solid matrix of wood pellets type I               concentration of Ca decreased 10% in the matrix and 88% in the
and type II (Fig. 6c, e). In the solid matrix of torrefied pellets,             inclusions, after one month of storage. It is plausible that other
concentration of Si, K, and Mg decreased after 1 month. Also, it is            inorganic-forming elements play a more active role in reacting
observed that Ca increased in the solid matrix of torrefied pellets             with the surrounding moisture/gases than Ca. After 1 month of

COMMUNICATIONS MATERIALS | (2021)2:2 | https://doi.org/10.1038/s43246-020-00113-y | www.nature.com/commsmat                                           5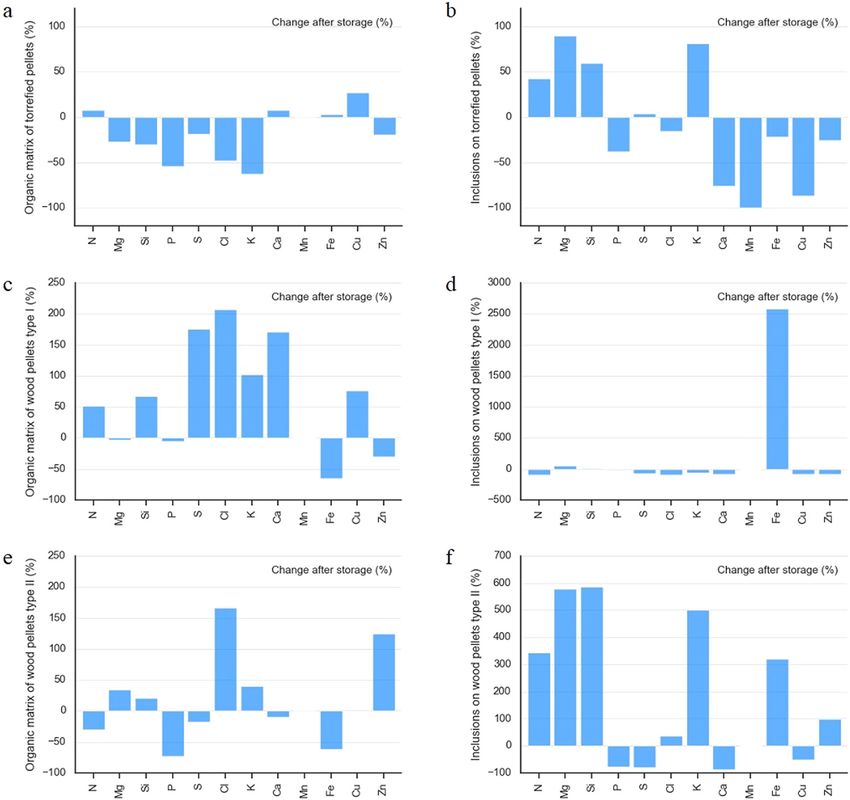
ARTICLE                                                              COMMUNICATIONS MATERIALS | https://doi.org/10.1038/s43246-020-00113-y

Fig. 5 Image analysis of SEM images of samples #4 at region 1 before and after storage. a, b Torrefied pellet (tor_sample4) before storage (a) and after
1 month of storage (b). c, d Wood pellet type I (wp1_sample4) before storage (c) and after 1 month of storage (d). e, f Wood pellet type II (wp2_sample4)
before storage (e) and after 1 month of storage (f). Yellow colour indicates the inclusions detected at the surface of the samples.

storage, wood pellets type II inclusions got enriched in Si, Mg,                 After 1 month of storage, inclusions in wood pellets type I
and K. As expected, torrefied pellets were the most resistant to               and II (Fig. 6d, f) got mainly enriched in Fe (1453%) and Si
chemical changes due to the nature of its hydrophobic struc-                  (296%). Si is mostly found in biomass as amorphous silica
ture29. We also observe a decrease of 10% in the oxygen content               (SiO2)22, while in ash, Si and Fe are mostly found as glass,
in the organic matrix of all pellets after 1 month of storage. This           silicates, and oxyhydroxides30. We ascribe this large increase in
suggests that pellets suffer oxygen-induced degradation, leading              concentrations to the untreated fibers of wood pellets, which
to an increase of oxygen-based inclusions, which is consistent                are more prone to moisture sorption (M2) than the reacted
with results presented in Fig. 5.                                             organic material of torrefied pellets, which have a lower pore
                                                                              size29. Enrichment of Si and Fe is also consistent with increased
                                                                              size of inclusions observed from SEM images (Fig. 5d, f). Image
EDS analysis of inclusions at the surface of biomass pellets.                 analysis of these SEM images indicates an increase in the
Before storage, inclusions at the surface of all samples are, in              average maximum area of the inclusions in wood pellets type I
average, consisting of major elements such as C > O > Fe > Si > Ca            and II (Supplementary Tables 5, 6). During thermochemical
for torrefied pellets, C > O > Si > Ca > N for wood pellets type I,            conversion, Si- and Fe-bearing glass, silicates and oxyhydr-
and C > O > Ni for wood pellets type II. Minor elements found in              oxides can increase ash yield, enhance abrasion-erosion,
the inclusions of torrefied pellets, wood pellets type I and II are            decrease combustion efficiency and increase operation costs
Zn > K > N > Mg > Cu, Cu > Cl > Zn > K > Fe > S, and Fe > Ca >                for handling of ashes27. The enrichment of SiO2 at the surface
Si > Mg > S, respectively.                                                    of the pellets can also lead to a decrease of thermochemical fuel

6                         COMMUNICATIONS MATERIALS | (2021)2:2 | https://doi.org/10.1038/s43246-020-00113-y | www.nature.com/commsmat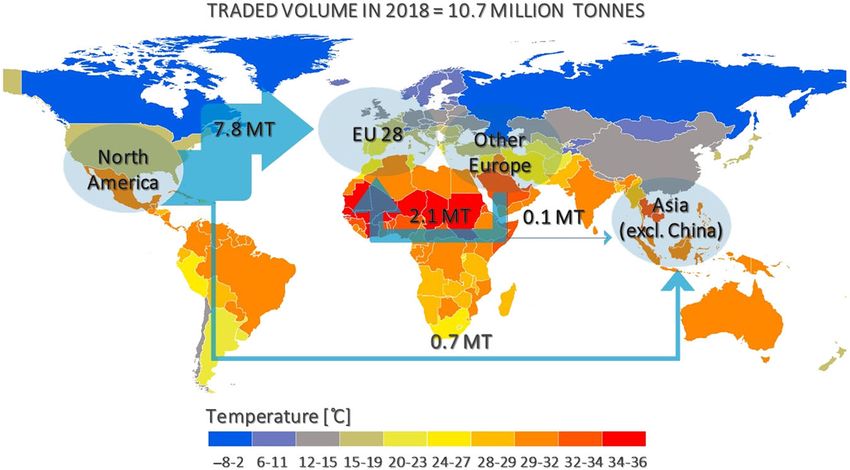
COMMUNICATIONS MATERIALS | https://doi.org/10.1038/s43246-020-00113-y                                                                      ARTICLE

Fig. 6 Percentage change of mean elemental concentrations of the matrix and surface inclusions of biomass pellets after 1 month of storage. a
Organic matrix of torrefied pellets. b Inclusions on torrefied pellets. c Organic matrix of wood pellet types I. d Inclusions on wood pellets type I. e Organic
matrix of wood pellet type II. f Inclusions on wood pellets type II. Light blue bars represent the mean elemental concentration of each element detected at
the surface of the samples.

conversion rates, due to the low melting temperature of                         Enrichment of K after storage could be attributed to the
silicates, which might encapsulate the remaining char25.                        formation/enlargement of K-silicates27. In the case of torrefied
Additionally, when moisture is adsorbed by the pellets,                         pellets, K-silicates could already have been formed during thermal
free hydroxyl ions (OH−) coupled with alkali cations (K+                        pretreatment34. Low melting temperature of K-silicates leads to
and Ca2+) might react with siliceous phases31. The reaction                     increased ash deposition and fouling35. Furthermore, in biomass
products are water-insoluble compounds based on calcium,                        combustion processes, K can be released as vapor species, which
alkalis and dissolved silica, leading to inclusion growth due to a              can further react with other gas components to form slag36. On
concentration gradient through biomass pores31. A similar                       the other hand, Mg after storage can be present as dolomite
phenomenon has already been observed in concrete32.                             (CaMg(CO3)2)26 or MgO37, which can cause heat exchanger
   Regarding minor inorganic-forming elements, after 1 month of                 fouling through increased alkali devolatilization36.
storage, inclusions in all pellets got enriched in Mg, followed by                 After 1 month of storage, EDS indicates a decrease in Ca
K, except in wood pellets type I. These elements are known to be                content from major to minor constituent for torrefied samples
present in the organic structure as Mg-K oxalates33 and                         and wood pellets type I. Meanwhile, in wood pellets type II, Ca
carbonates22, while in ash in the form of glass, silicates,                     decreases from minor to trace element. As explained above, a
carbonates, oxyhydroxides, sulphates, and phosphates27. Either                  carbonatation from Ca(OH)2 could have diluted the average
at the solid matrix or at the inclusions, increases in the                      concentration of Ca in the inclusions of all samples26.
concentration of Mg and K are associated with increased                            Lastly, each of the EDS detected elements in inclusions have
inclusion body formation. This is the result of the mobile                      different surface energy that could lead to agglomeration (M4).
nature30 of these elements, agglomeration, and moisture sorption.               Inclusions with lower surface area tend to agglomerate into larger

COMMUNICATIONS MATERIALS | (2021)2:2 | https://doi.org/10.1038/s43246-020-00113-y | www.nature.com/commsmat                                                7

ARTICLE                                                           COMMUNICATIONS MATERIALS | https://doi.org/10.1038/s43246-020-00113-y

inclusions to reduce their surface energy38. This rearrangement            exceed occupational standards for worker exposure43. Potential
also leads to creation or expansion of cracks.                             solutions to reduce oxidation, moisture sorption and off-gassing
                                                                           during storage are the use of antioxidants42 or hydrophobic
                                                                           coatings44 during pellet production.
Micro-CT scans of biomass pellets: porosity and inclusion                     Changes in porosity are in agreement with weight measure-
growth mechanism. Given the tortuous nature of the cracks                  ments, which report that after one month of storage, torrefied
within the pellets, we used micro-CT to gain insight into the              samples, wood pellet type I and type II, increased in average 2.8%,
porosity, development of inclusions, cavities and crack formation          2.7%, and 2.8%, respectively, compared to their initial weight
and growth during storage. Micro-CT provides advantages                    (Supplementary Note 2). Weight change is also in agreement with
compared to conventional microscopy, which is not effective at             measurements of pellet diameter (Supplementary Table 2). Results
quantifying buried crack formation away from the pellet surface            of the statistical analysis indicate that the two pairs of variables,
(Fig. 3). Figs. 7, 8 show the 3D images of the porosity and                weight-diameter and porosity-diameter, have a strong positive
inclusions along the sample of 4-mm length from the top to the             correlation with a p value less than 0.01 (Supplementary Note 8).
bottom of the pellets. Values of the porosity and inclusion-to-               A volume increase of the inclusions within the internal cavities
pellet volume ratio for each of the pellets are given in Supple-           also leads to expansion of cracks (Fig. 8 and Supplementary
mentary Table 7. Detailed 3D representation of porosity evolution          Movie 3). After 1 month of storage, the inclusion-to-pellet
and inclusion formation, growth, and agglomeration, as a func-             volume ratio increased in torrefied pellets by 38%, in wood pellets
tion of storage time, is provided in Supplementary Note 6 and              type I by 800% and in wood pellets type II by 310%, with respect
Supplementary Movies 1–3.                                                  to the ratio calculated for pellets before storage. Increased
   Results of the CT scans confirm our hypothesis regarding the             inclusion growth can also be attributed to the presence of rubbery
reduction in the apparent crack depth after storage (Fig. 3). Due          amorphous polysaccharides which are responsible for mineral ion
to the tortuous nature of the cracks within the pellets and the            transport (M4). Especially at high humidity, such as the one used
increased inclusions at the surface and within the pellets after           in this work; amorphous polysaccharides pass through a
1 month of storage, the light from the microscope does not                 moisture-induced glass transition inside the wood cell wall layers
penetrate deep (enough) into the biomass fibres, restricting the            which facilitates the diffusion of chemicals45. Thus, our findings
application of digital microscopy in crack imaging seriously. CT           support this hypothesis that moisture-softened polysaccharides
scans show that although wall fibres expand within the pellets, the         facilitated the growth of inclusions at 40 °C and 85%. To
void space is higher after one month of storage.                           complement the results presented on Figs. 7, 8, Supplementary
   Storage at 40 °C and 85% RH produces changes in the internal            Movies 1–3 show how the enlargement of inclusions affect the
porous structure of the pellets. The porosity of the torrefied              structure of the pellet and increased cracks.
pellets, wood pellets type I and type II increased by 35%, 66%, and
59%, respectively, after 1 month of storage. Our findings confirm
previous experiments and support the suggestion9 that the                  Conclusion. Our results suggest that significant degradation of
volume of the pellet expands as a result of moisture sorption              biomass pellets was proven due to storage conditions at 40 °C and
(M2) during high humidity storage (85% RH). This phenomenon                85% RH. We show that the creation and expansion of cracks in
could lead to decreased bulk density and reduced pellet strength9.         pellets is tightly linked to the increased porosity, regained
Furthermore, the void space within the pellets can be filled by             moisture content, higher inclusion body formation and inclusion
entrapped air, water molecules and gaseous compounds (CO2,                 agglomeration as a result of extended storage of 1 month. After
CO, CH4, and volatile organic compounds)8,15 released from                 1 month of storage, the damaged area with respect to the total
decomposition of biomass during storage. All these compounds               area of the front surface of all pellets (area ratio) increased in
fill the pre-existing cracks and expand them, producing a tortuous          average by 5%.
3D network of cracks. The findings presented in Figs. 7, 8 add to              To the best of our knowledge, no other authors have quantified
observations made by Strandberg et al.25, who reported enlarge-            the microstructural changes occurring in pellets during storage.
ment of cracks and internal cavities during devolatilization of            Quantification of crack formation and inclusion body formation
biomass pellets. Internal cavities and cracks can affect the               at the surface and within the pellets is obtained with the use of
conversion rates by increasing active char oxidation surface25.            micro-CT. Results indicate that the increase in the inclusion-to-
Thus, storage degradation could enhance char oxidation by                  pellet volume ratio can be as high as 800% in wood pellets after
further increasing gas transport to and from the pellet.                   one month of storage. As described in previous sections, inclusion
   Although we did not monitor off-gassing from stored pellets,            growth is the result of multiple mechanisms (M1–M5). Although
there is a large difference between the weight change estimated            mechanical properties, such as durability are important to
from porosity calculations and the weight change estimated from            understand the behavior of pellets as a bulk, inclusion formation
weight measurements (Supplementary Note 7 and Supplementary                and agglomeration within the pellets should be studied to
Table 9). This difference in weight implies that pellets are not           optimize fine particulate emissions, thermochemical conversion
only absorbing moisture but there are also off-gassing emissions.          and fuel particle modeling. Inclusion agglomeration may affect
Gases denser (aldehydes and ketones)8 than moist air are known             large-scale thermochemical conversion processes, such as cen-
to be present in the off-gassing of biomass pellets during storage.        tralized district heating and biomass co-firing. On the other hand,
For example, volatile organic compounds, such as acetaldehyde              pellets with a higher number of cracks at the surface and within
and propanal, which have densities two orders of magnitude                 the structure are more sensitive to degradation during storage,
higher than moist air.                                                     possibly resulting in revenue loss to companies and consumers as
   Furthermore, the resulting highly porous structure exposes a            part of the material could be lost. To the extent of discouraging
higher surface area of pellet fibers to interact with the                   the use of biomass pellets and slowing down the bioenergy
surrounding medium during storage. This phenomenon leads                   transition. Our results challenge existing local and international
to increased oxidation8,15,39 accelerating pellet degradation.             certifications to develop new standards for handling, transport
Examples of the consequences are reduced mechanical durabil-               and storage of biomass pellets. Creation of stronger policies to
ity18, decreased calorific value40, increased microbial activity41,         avoid degradation of pellets could help to reduce breakage, reduce
increased risk of self-ignition8,42, and gas concentrations that can       off-gassing and increase pellet conversion efficiency.

8                      COMMUNICATIONS MATERIALS | (2021)2:2 | https://doi.org/10.1038/s43246-020-00113-y | www.nature.com/commsmat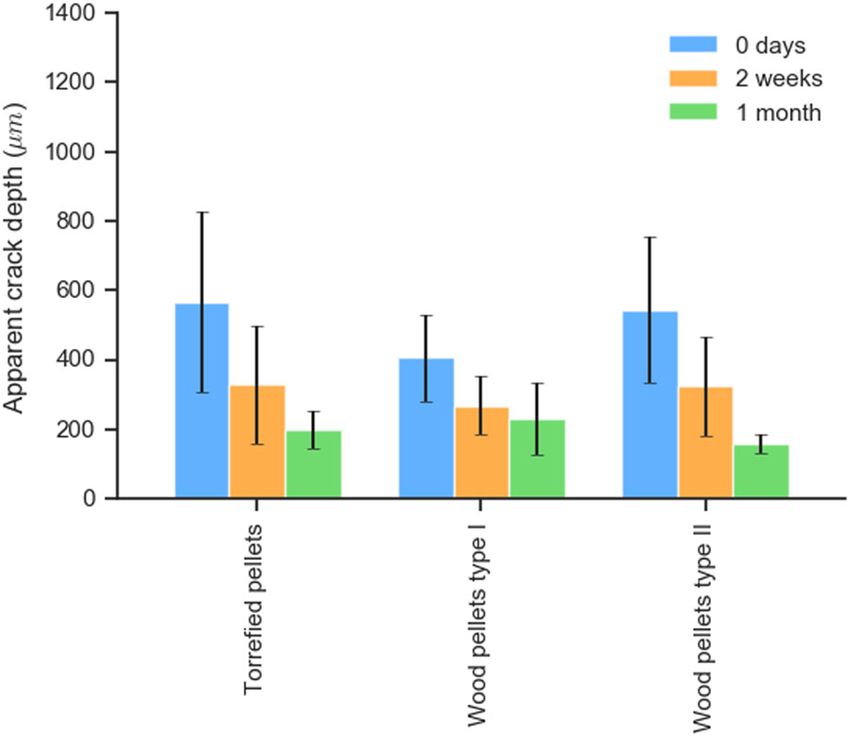
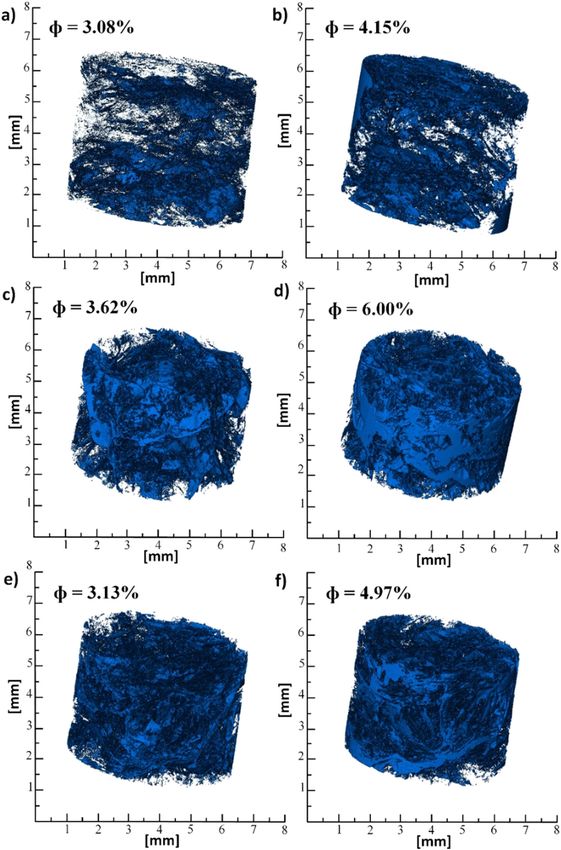
COMMUNICATIONS MATERIALS | https://doi.org/10.1038/s43246-020-00113-y                                                                                 ARTICLE

Fig. 7 3D images of porosity (Φ) in samples #3 before and after storage. a, b Torrefied pellet (tor_sample3) before storage (a) and after 1 month of
storage (b). c, d Wood pellet type I (wp1_sample3) before storage (c) and after 1 month of storage (d). e, f Wood pellet type II (wp2_sample3) before
storage (e) and after 1 month of storage (f). Blue colour represents 3D porosity. Percentages shown in the figure indicate the porosity of the samples
expressed in %. See Supplementary Table 7 for detailed information on porosity calculations.

Methods                                                                               was used to characterize the pellet structure using high lateral resolution 3D
Experimental techniques. In the present work the following techniques were used       images.
to characterize the degradation of biomass pellets before and after storage: weight
and diameter change, digital microscopy, scanning electron microscopy equipped
with energy dispersive X-ray spectroscopy (SEM-EDS), and X-ray micro-computed         Sample. In this work, we monitored two types of untreated commercial white
tomography (micro-CT). Morphological changes at the pellet surface were mon-          wood pellets, wood pellet type I (wp1) and wood pellet type II (wp2), and one
itored using digital microscopy. SEM-EDS analysis was carried out at the surface      type of torrefied wood pellets (tor). Wood pellets were made from sawdust and
and at the cross section of the pellets for better understanding of the changes in    purchased from local stores in the Netherlands. No information regarding the
morphology and elemental composition of pellets, due to storage. Then, micro-CT       manufacturing process was provided. The torrefied pellets were obtained from a

COMMUNICATIONS MATERIALS | (2021)2:2 | https://doi.org/10.1038/s43246-020-00113-y | www.nature.com/commsmat                                                            9
ARTICLE                                                                       COMMUNICATIONS MATERIALS | https://doi.org/10.1038/s43246-020-00113-y

Fig. 8 3D images of inclusions in samples #3 before and after storage. a, b Torrefied pellet (tor_sample3) before storage (a) and after 1 month of storage
(b). c, d Wood pellet type I (wp1_sample3) before storage (c) and after 1 month of storage (d). e, f Wood pellet type II (wp2_sample3) before storage
(e) and after 1 month of storage (f). Yellow colour represents 3D inclusions. Percentages shown in the figure indicate the inclusion-to-pellet volume ratio
expressed in %. See Supplementary Table 7 for detailed information on inclusion-to-pellet volume ratio calculations.

pilot-scale production facility in the UK and no information about the origin of the   deterioration9,11 and off-gassing8 have proven to be significant in the degradation
pellets and production process was disclosed. The main characteristics of the          of biomass pellets. The temperature and relative humidity inside the chamber were
studied pellets based on ultimate and proximate analysis are provided in Supple-       kept constant all the time and monitored continuously. We did not investigate
mentary Note 1. Samples were stored in a climate chamber (C + 10/600 Climate           higher storage temperatures because, at industrial level, temperatures above 60 °C
Test Chamber) with a volume of 600 L for a period of one month at a constant           are already a concern and then cooling is needed through mechanical ventilation16.
condition of 40 °C and 85% RH. These conditions were selected since they               During the storage period, pellets were examined at 3 sample dates: 0 days, 2 weeks,
represent typical conditions of transatlantic transportation (from North America to    and 1 month. A detailed description of the characterization and analytical tech-
Europe)8,46. Furthermore, at and above this temperature and RH value,                  niques used to carry out this study are described in the following sections.

10                           COMMUNICATIONS MATERIALS | (2021)2:2 | https://doi.org/10.1038/s43246-020-00113-y | www.nature.com/commsmat
COMMUNICATIONS MATERIALS | https://doi.org/10.1038/s43246-020-00113-y                                                                                         ARTICLE

The as-received properties such as proximate and ultimate analysis, weight, dia-           AVISO software was also used to estimate the porosity of the pellets and the
meter, surface morphology, and microstructure of the pellets before storage are            inclusion-to-pellet ratio after different times of storage. Porosity is defined as the
given as the benchmark for assessment and comparison. Therefore, any changes in            fraction of the total volume, which is void (free) space in the pellet. The inclusion-
the pellet properties after storage can be compared to the as-received properties.         to-pellet volume ratio is defined as the ratio of the volume of the inclusions to the
                                                                                           total volume of the pellet. Image processing steps comprises image segmentation
                                                                                           (quantification and image separation), noise reduction filters, and label analysis to
Weight and diameter of pellets. An electronic balance (Sartorius Practum 124-1             extract statistical and numerical information49.
S analytical) was used to measure the mass of each pellet at three sampling dates:
0 days, 2 weeks, and 1 month. At the same time, the diameter of each pellet was
measured with a Kunzer 7EMS01 digital caliper 150 mm with an accuracy of 0.01              Statistics. In order to determine associations between the storage time, volume
mm. Data on weight change for all samples are reported in Supplementary Note 2.            expansion, porosity and weight change for all three type of pellets, we used
                                                                                           Pearson’s correlation analysis and calculated the corresponding p values. After we
                                                                                           applied a logarithmic transformation LogWorth to convert relatively small p values
Physical changes at the pellet surface. Pre-existing cracks, expansion of pre-             into a more readable scale. Detailed statistical analysis is provided in Supple-
existing cracks and formation of new ones were quantified using a digital micro-            mentary Note 8. P < 0.01 was used to indicate significance.
scope, Keyence VHX- 5000 series, ocular VH-Z100R/W/T. A total of nine samples
were examined: three samples per each type of pellet. The notation of these samples
is the following: wp1_sample1-3, wp2_sample1-3 and tor_sample1-3. A mark was               Data availability
placed on one side of each sample to ensure that the observation area remained the         Data supporting the findings presented in this paper are available within the manuscript
same during the three sample dates. The damaged surface area at the front face of          and in the Supplementary Material. Datasets for 3D reconstruction of micro-CT images
the pellets was measured using the area measurement built-in function in the digital       of pellets are available from the corresponding author upon request.
microscope that allows detection of cracks based on brightness and contrast var-
iations. The front surface of the pellet is defined as the surface facing the lens of the
microscope. Besides the pre-existing cracks, pellets contain regions with different        Received: 18 June 2020; Accepted: 29 November 2020;
surface texture with interparticle gaps and voids result of poor adhesion between
adjacent biomass fibers during the pelletization process47. The pelletization process
also produces regions with fiber ends and particles sticking out of the surface as a
result of adhering structures being torn apart47. These regions were detected by the
microscope as they differ from the pellet material lighter color. In the manuscript
such regions and cracks are referred to as “damage”. Although large damaged areas          References
were easy to detect automatically, the manual marking mode was used to include             1.    Melton, N., Axsen, J. & Sperling, D. Moving beyond alternative fuel hype to
small cracks in the computation of the total area of the cracks. The percentage of               decarbonize transportation. Nat. Energy 1, 16013 (2016).
increase in the damaged area was calculated as the difference between the damaged          2.    Staples, M. D., Malina, R. & Barrett, S. R. H. The limits of bioenergy for
area after storage and before storage related to the damaged area before storage.                mitigating global life-cycle greenhouse gas emissions from fossil fuels. Nat.
    The apparent depth of surface cracks was determined using the built-in tool                  Energy 2, 16202 (2017).
from the digital microscope to construct a 3D surface profile measurement of the            3.    Smith, P., Nkem, J. & Calvin, K. In Climate Change and Land: An IPCC Special
front face of the pellet. The built-in tool is based on photographic stitching                   Report on Climate Change, Desertification, Land Degradation, Sustainable Land
combined with a depth composition function and multi-lighting48. A line was
                                                                                                 Management, Food Security, and Greenhouse Gas Fluxes in Terrestrial
drawn between two points along the front face of the pellet to get a profile graph of
                                                                                                 Ecosystems (Intergovernmental Panel on Climate Change (IPCC), 2019).
the surface. Three profile lines were drawn along the front face of each sample to
                                                                                           4.    Shankar Tumuluru, J., Sokhansanj, S., Hess, J. R., Wright, C. T. & Boardman,
ensure repeatability.
                                                                                                 R. D. REVIEW: A review on biomass torrefaction process and product
                                                                                                 properties for energy applications. Ind. Biotechnol. 7, 384–401 (2011).
Surface and elemental composition analysis. Observations related to the mor-               5.    Calderón, C. et al. Statistical report 2019: Report Pellet. (2019).
phology and composition of pellets before and after 1 month of storage were                6.    Strauss, W. & Walker, S. Global pellet market outlook in 2018. Canadian
obtained by SEM-EDS. SEM analysis was performed on a JEOL IT100 Scanning                         Biomass in Canadian Biomass Magazine (Canadian Biomass, 2018).
Electron Microscope using a backscattered electron detector, coupled with an EDS           7.    Magelli, F., Boucher, K., Bi, H. T., Melin, S. & Bonoli, A. An environmental
analyser. Data were processed with the corresponding InTouchScope™ software.                     impact assessment of exported wood pellets from Canada to Europe. Biomass
The diameter of the analysed area was a few hundred micrometres and the ana-                     Bioenergy 33, 434–441 (2009).
lysed depth around 1 µm. EDS measurements were carried at low-vacuum due to                8.    Wang, S. et al. Variation in the physical properties of wood pellets and
the nonconductivity of the samples. Images were recorded in a compositional mode                 emission of aldehyde/ketone under different storage conditions. Fuel 183,
using an accelerated voltage of 10 kV and probe current of 65 pA. The cross section              314–321 (2016).
of the samples was mechanically ground up to 800 grit with SiC grinding sand-              9.    Deng, T., Alzahrani, A. M. & Bradley, M. S. Influences of environmental
paper and glued to the sample holder using double-sided tape. Just the side, which               humidity on physical properties and attrition of wood pellets. Fuel Process.
was grinded, was taped to the SEM-EDS holder to avoid the detection of Si and C                  Technol. 185, 126–138 (2019).
from the grinding paper. A mark was made on one side of each sample to ensure              10.   Shojaeiarani, J., Bajwa, D. S., Bajwa, S. G., Shirzadifar, A. & Pandey, P. A
that the observation area remained constant during the three sampling dates. For                 numerical model approach to predict moisture absorption in densified solid
comparison, SEM was conducted on the cross section of the sample pellets before                  biomass during storage. Ind. Crops Prod. 140, 111529 (2019).
storage and after one month of storage. We examined six pellets, two samples per
                                                                                           11.   Gilvari, H. et al. The effect of environmental conditions on the degradation
each type of pellet and inspected two regions per each sample. The notation of
                                                                                                 behavior of biomass pellets. Polymers 12, 970 (2020).
these samples is the following: wp1_sample4-5, wp2_sample4-5 and tor_sample4-
                                                                                           12.   Biswas, A. K., Rudolfsson, M., Broström, M. & Umeki, K. Effect of pelletizing
5. In average we selected 4 points per each region per each sample for scanning, on
                                                                                                 conditions on combustion behaviour of single wood pellet. Appl. Energy 119,
the matrix and on the inclusions. The elemental composition of biomass comprises:
major (>1% at.), minor (1–0.1% at.), and trace (
ARTICLE COMMUNICATIONS MATERIALS | https://doi.org/10.1038/s43246-020-00113-y
20. Dyjakon, A. & Noszczyk, T. The influence of freezing temperature storage on 45. Jakes, J. E. Mechanism for diffusion through secondary cell walls in
the mechanical durability of commercial pellets from biomass. Energies 12, lignocellulosic biomass. J. Phys. Chem. B 123, 4333–4339 (2019).
2627 (2019). 46. Lee, J. et al. The effects of storage on the net calorific value of wood pellets.
21. Lemaitre, J. & Dufailly, J. Damage measurements. Eng. Fract. Mech. 28, https://doi.org/10.7451/CBE.2015.57.8.5. (2015).
643–661 (1987). 47. Stelte, W. et al. A study of bonding and failure mechanisms in fuel pellets
22. Vassilev, S. V., Baxter, D., Andersen, L. K. & Vassileva, C. G. An overview of from different biomass resources. Biomass Bioenergy 35, 910–918 (2011).
the chemical composition of biomass. Fuel 89, 913–933 (2010). 48. KEYENCE. Digital Microscope VHX-5000. User’s Manual. https://www.
23. Goldstein, J. I. et al. in Scanning Electron Microscopy and X-Ray Microanalysis keyence.com/products/microscope/digital-microscope/vhx-5000/ (2014).
(eds. Goldstein, J. I. et al.) pp. 15–28 (Springer, 2018). 49. Thermo Fisher Scientific. Thermo Scientific Avizo Software 9 User’s Guide.
24. Sander, B. Properties of Danish biofuels and the requirements for power https://assets.thermofisher.com/TFS-Assets/MSD/Product-Guides/user-guide-
production. Biomass Bioenergy 12, 177–183 (1997). avizo-software.pdf (2018).
25. Strandberg, A. et al. Biomass pellet combustion: cavities and ash formation 50. CRU. Climate Research Unit (CRU) datasets. https://crudata.uea.ac.uk/cru/
characterized by synchrotron X-ray micro-tomography. Fuel Process. Technol. data/temperature/#sciref (2014).
176, 211–220 (2018).
26. Supancic, K., Obernberger, I., Kienzl, N. & Arich, A. Conversion and leaching
characteristics of biomass ashes during outdoor storage—results of laboratory Acknowledgements
tests. Biomass Bioenergy 61, 211–226 (2014). This work was supported by the Top Consortium for Knowledge and Innovation for the
27. Vassilev, S. V., Vassileva, C. G., Song, Y.-C., Li, W.-Y. & Feng, J. Ash contents Biobased Economy under grant TKI-BBE project number BBE-1801. Additional support
and ash-forming elements of biomass and their significance for solid biofuel was provided by the European Union’s Horizon 2020 research and innovation pro-
combustion. Fuel 208, 377–409 (2017). gramme under the Marie Skłodowska-Curie grant agreement No. 707404 and TKI
28. Steenari, B.-M. & Lindqvist, O. Stabilisation of biofuel ashes for recycling to BioBased Economy project No. 1713 “Biomass pellets: degradation during transport and
forest soil. Biomass Bioenergy 13, 39–50 (1997). handling”. We would also like to acknowledge W. Verwaal, E. Meijvogel-de Koning for
29. Tumuluru, J. S. Effect of deep drying and torrefaction temperature on assistance with micro-CT scans measurements, and J.G. van Meel for guidance regarding
proximate, ultimate composition, and heating value of 2-mm Lodgepole Pine the 3D reconstructions of micro-CT data.
(Pinus contorta) Grind. Bioengineering 3, 384–401 (2016).
30. Vassilev, S. V., Baxter, D., Andersen, L. K. & Vassileva, C. G. An overview of Author contributions
the composition and application of biomass ash. Part 1. Phase–mineral and L.C., U.T., and H.G. formulated the research question. L.C. and U.T. designed and
chemical composition and classification. Fuel 105, 40–76 (2013). performed the experiments, analyzed the data and led the manuscript writing. A.M. and
31. Powers, T. C. & Steinour, H. H. An interpretation of some published W.d.J. provided suggestions on the experiments and data interpretation. H.G., D.S., A.M.,
researches on the alkali-aggregate reaction part 1-the chemical reactions and and W.d.J. contributed to editing the manuscript.
mechanism of expansion. J Am. Concr. Inst. 26, 497–516 (1955).
32. Deschenes, R., Giannini, E., Drimalas, T., Fournier, B. & Hale, W. Effects of
moisture, temperature, and freezing and thawing on alkali-silica reaction. ACI Competing interests
Mater. J. 115, 575–584 (2018). The authors declare no competing interests.
33. Jong, W. de & Ommen, J. R. van. Biomass as a Sustainable Energy Source
for the Future: Fundamentals of Conversion Processes (John Wiley & Sons,
2014).
Additional information
Supplementary information is available for this paper at https://doi.org/10.1038/s43246-
34. Fagerström, J., Steinvall, E., Boström, D. & Boman, C. Alkali transformation
020-00113-y.
during single pellet combustion of soft wood and wheat straw. Fuel Process.
Technol. 143, 204–212 (2016).
Correspondence and requests for materials should be addressed to L.C. or W.d.J.
35. Lalak, J. et al. Comparison of selected parameters of biomass and coal. Int.
Agrophys. 30, 475–482 (2016).
Peer review information Primary handling editor: John Plummer
36. Thy, P., Lesher, C. E. & Jenkins, B. M. Experimental determination of
high-temperature elemental losses from biomass slag. Fuel 79, 693–700
Reprints and permission information is available at http://www.nature.com/reprints
(2000).
37. Werkelin, J., Lindberg, D., Boström, D., Skrifvars, B.-J. & Hupa, M. Ash-
Publisher’s note Springer Nature remains neutral with regard to jurisdictional claims in
forming elements in four Scandinavian wood species part 3: Combustion of
published maps and institutional affiliations.
five spruce samples. Biomass Bioenergy 35, 725–733 (2011).
38. Kocjan, A., Logar, M. & Shen, Z. The agglomeration, coalescence and sliding
of nanoparticles, leading to the rapid sintering of zirconia nanoceramics. Sci.
Rep. 7, 1–8 (2017). Open Access This article is licensed under a Creative Commons
39. Wen, C. Metallic Foam Bone: Processing, Modification and Characterization Attribution 4.0 International License, which permits use, sharing,
and Properties (Woodhead Publishing, 2016). adaptation, distribution and reproduction in any medium or format, as long as you give
40. Graham, S. Degradation of biomass fuels during long term storage in indoor appropriate credit to the original author(s) and the source, provide a link to the Creative
and outdoor environments. (University of Nottingham, 2015). Commons license, and indicate if changes were made. The images or other third party
41. Noll, M. & Jirjis, R. Microbial communities in large-scale wood piles and their material in this article are included in the article’s Creative Commons license, unless
effects on wood quality and the environment. Appl. Microbiol. Biotechnol. 95, indicated otherwise in a credit line to the material. If material is not included in the
551–563 (2012). article’s Creative Commons license and your intended use is not permitted by statutory
42. Sedlmayer, I. et al. Off-gassing reduction of stored wood pellets by adding regulation or exceeds the permitted use, you will need to obtain permission directly from
acetylsalicylic acid. Fuel Process. Technol. 198, 106218 (2020). the copyright holder. To view a copy of this license, visit http://creativecommons.org/
43. Rahman, M. A., Rossner, A. & Hopke, P. K. Carbon monoxide off-gassing licenses/by/4.0/.
from bags of wood pellets. Ann. Work Expo. Health 62, 248–252 (2018).
44. Whittaker, C. & Shield, I. Factors affecting wood, energy grass and straw pellet
durability—a review. Renew. Sustain. Energy Rev. 71, 1–11 (2017). © The Author(s) 2021
12 COMMUNICATIONS MATERIALS | (2021)2:2 | https://doi.org/10.1038/s43246-020-00113-y | www.nature.com/commsmatYou can also read


