A multi-scale daily SPEI dataset for drought characterization at observation stations over mainland China from 1961 to 2018 - ESSD
←
→
Page content transcription
If your browser does not render page correctly, please read the page content below
Earth Syst. Sci. Data, 13, 331–341, 2021
https://doi.org/10.5194/essd-13-331-2021
© Author(s) 2021. This work is distributed under
the Creative Commons Attribution 4.0 License.

                     A multi-scale daily SPEI dataset for drought
                    characterization at observation stations over
                         mainland China from 1961 to 2018
       Qianfeng Wang1,3 , Jingyu Zeng1 , Junyu Qi2 , Xuesong Zhang2,3 , Yue Zeng1 , Wei Shui1 , Zhanghua Xu1 ,
                                Rongrong Zhang1 , Xiaoping Wu1 , and Jiang Cong4
         1 Fujian  Provincial Key Laboratory of Remote Sensing of Soil Erosion and Disaster Protection/College of
                             Environment and Resource, Fuzhou University, Fuzhou, 350116, China
                    2 Earth System Science Interdisciplinary Center, University of Maryland, College Park,

                                  5825 University Research Ct, College Park, MD 20740, USA
       3 Joint Global Change Research Institute, Pacific Northwest National Laboratory and University of Maryland,

                                                College Park, MD 20740, USA
              4 School of Urban Planning and Design, Peking University, Shenzhen, Guangdong, 518055, China

                             Correspondence: Qianfeng Wang (wangqianfeng@fzu.edu.cn)

                                   Received: 26 June 2020 – Discussion started: 6 October 2020
                      Revised: 12 December 2020 – Accepted: 2 January 2021 – Published: 11 February 2021

      Abstract. The monthly standardized precipitation evapotranspiration index (SPEI) can be used to monitor and
      assess drought characteristics with 1-month or longer drought duration. Based on data from 1961 to 2018 at 427
      meteorological stations across mainland China, we developed a daily SPEI dataset to overcome the shortcoming
      of the coarse temporal scale of monthly SPEI. Our dataset not only can be used to identify the start and end
      dates of drought events, but also can be used to investigate the meteorological, agricultural, hydrological, and
      socioeconomic droughts with a different timescales. In the present study, the SPEI data with 3-month (about
      90 d) timescale were taken as a demonstration example to analyze spatial distribution and temporal changes
      in drought conditions for mainland China. The SPEI data with a 3-month (about 90 d) timescale showed no
      obvious intensifying trends in terms of severity, duration, and frequency of drought events from 1961 to 2018.
      Our drought dataset serves as a unique resource with daily resolution to a variety of research communities
      including meteorology, geography, and natural hazard studies. The daily SPEI dataset developed is free, open,
      and publicly available from this study. The dataset with daily SPEI is publicly available via the figshare portal
      (Wang et al., 2020c), with https://doi.org/10.6084/m9.figshare.12568280.

      Highlights. A multi-scale daily SPEI dataset was developed across mainland China from 1961 to 2018.
      The daily SPEI dataset can be used to identify the start and end days of the drought event. The developed daily
      SPEI dataset in this study is free, open, and publicly available.

Published by Copernicus Publications.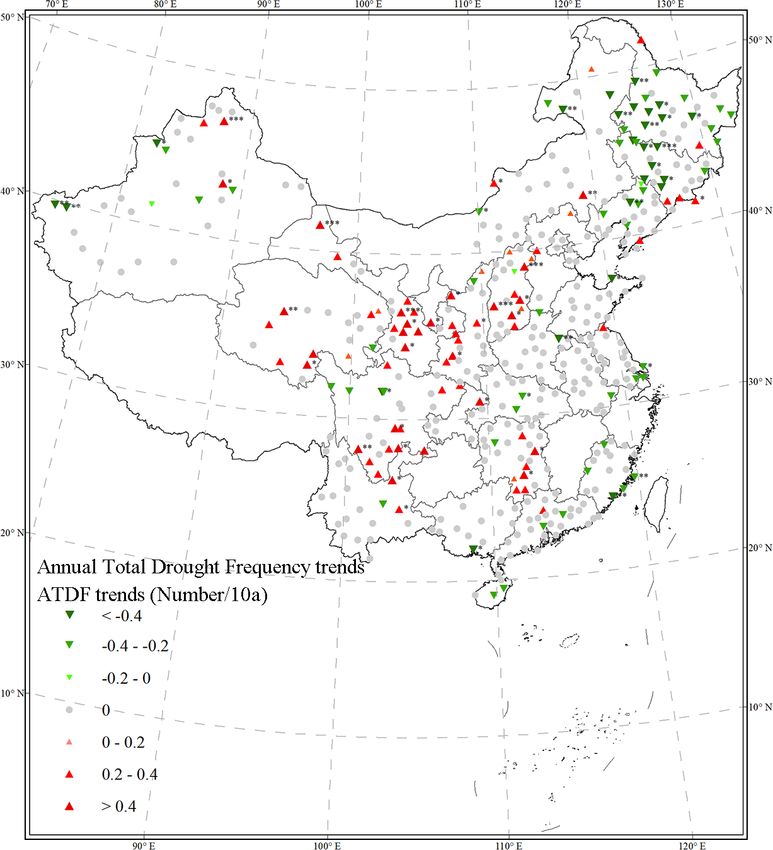
332                                              Q. Wang et al.: A multi-scale daily SPEI dataset for drought characterization

1   Introduction                                                   multiple spatial scales at a monthly time step, it only consid-
                                                                   ers the precipitation factor and neglects effects of evaporation
Drought is one of the most destructive natural hazards world-      stemming from temperature and other meteorological factors
wide. It can lead to adverse effects to the ecological sys-        (Wang et al., 2014, 2017; Yang et al., 2018). To solve the
tem, industrial production, agricultural practices, drinking       above problems, the standardized precipitation evapotranspi-
water availability, hydrological processes, and water qual-        ration index (SPEI), which considers the advantages of both
ity (Bussi and Whitehead, 2020; Lai et al., 2019; Vicente-         PDSI and SPI, was developed to monitor and assess droughts
Serrano et al., 2012; Wang et al., 2014, 2017). Drought            (Vicente-Serrano et al., 2010). It not only accounts for the
caused ca. USD 221 billion in loss from 1960 to 2016 re-           effect of evaporation on drought, but also has the capabil-
ported by the International Disaster Database (EM-DAT),            ity of spatial comparability and characterization of different
and the drought events in South Asia influenced over 60 mil-       drought types with multiple timescales (Feng and Su, 2019;
lion residents from 1998 to 2001 (Agrawala et al., 2001). Un-      Wang et al., 2015). SPEI can be used to delineate spatial–
fortunately, drought is expected to increase in frequency and      temporal evolution of drought, drought characteristics, and
intensity due to the future warming air temperature (Tren-         impacts of drought at the regional and global scales (Mallya
berth et al., 2014; Zambrano et al., 2018). The exacerbated        et al., 2016; Wang et al., 2014).
drought conditions have promoted some national legislation            However, the commonly used SPEI fails to identify
(such as drought preparedness and planning) to carry out           droughts with a duration less than 1 month (Van der Schrier
risk management and adaptive strategy for drought disasters        et al., 2011; Vicente-Serrano et al., 2010). With future cli-
(Garrick et al., 2017).                                            mate change, flash droughts have been recently categorized
   The various drought types result in the difficulty of           as a type of extreme climate event. Flash droughts occur
drought characterization and assessment. Drought definition        along with sudden onset, rapid aggravation, and sudden end
is not unique. Some studies proposed defining drought ac-          of drought and could lead to severe consequences (Pen-
cording to the water deficit (Wilhite and Glantz, 1985), while     dergrass et al., 2020). It is imperative to characterize flash
others defined drought based on the period of abnormal             droughts with short-term duration (e.g., several days). To
arid conditions (Eslamian et al., 2017). The most common           use the sub-month-resolution drought index, we have devel-
drought can be classified into four types including (1) meteo-     oped the daily SPEI for the first time, and our daily SPEI
rological, (2) agricultural, (3) hydrological, and (4) socioeco-   has been used to assess the drought and its impacts in previ-
nomic (Mishra and Singh, 2010). Meteorological drought re-         ous studies (Wang et al., 2015, 2017). The new SPEI can not
sults from precipitation deficit or evaporation increases (Mc-     only identify drought with a duration of 1 month and more
Kee et al., 1993). Meteorological drought can propagate into       than 1 month, but also monitor drought with a duration of
agricultural drought with lower soil moisture availability, and    several days. In addition, our new daily SPEI has filled the
it also can lead to hydrological drought with lower stream-        gap in the capability to monitor the onset and duration of
flow and socioeconomic drought with lower water availabil-         droughts. Our daily SPEI has similar principles as the com-
ity (Barella-Ortiz and Quintana-Seguí, 2019; Gevaert et al.,       monly used monthly SPEI in terms of time accumulation ef-
2018). In general, drought indices are normally used to mon-       fects (Vicente-Serrano et al., 2010; Wang et al., 2015; Yu et
itor and assess the condition or spatial–temporal characteris-     al., 2014). The daily SPEI data with different timescales can
tics of drought.                                                   also meet the requirements of characterizing and assessing
   Many drought indices have been developed for drought            different drought types (meteorological drought, agricultural
characterization and assessment, such as the Palmer drought        drought, and hydrological drought) at multiple timescales
severity index (PDSI) (Dai et al., 2004), standardized pre-        (Wang et al., 2014).
cipitation index (SPI) (McKee et al., 1993), vegetation wa-           The SPEI can be calculated by the difference between
ter supply index (VWSI) (Carlson et al., 1994), vegetation         daily precipitation and daily potential evapotranspiration
health index (VHI) (Kogan, 2002), vegetation temperature           (PET) (Vicente-Serrano et al., 2012). Precipitation can gen-
condition index (VTCI) (Wan et al., 2004), and other drought       erally be directly obtained by the meteorological observa-
indices (Men-xin and Hou-quan, 2016; Wang et al., 2015,            tion stations (Wang et al., 2015). But PET can only be es-
2017). PDSI and SPI are the most popular drought studies           timated by drivers of meteorological data or remote sensing
worldwide (Dai et al., 2004; McKee et al., 1993); however,         data (Wang et al., 2018, 2017). Although there are at least
they have some limitations. PDSI is only suitable to the agri-     50 methods to calculate the PET, the methods estimate the
cultural drought through characterization of the soil water        inconsistent and different values due to diverse assumptions,
deficit, and it cannot identify the meteorological, hydrologi-     data inputs, and climatic regions (Grismer et al., 2002; Lu
cal, and socioeconomic droughts (Feng and Su, 2019). In ad-        et al., 2005). PET plays an important role in understanding
dition, PDSI limits the spatial comparability of drought due       fluxes of the heat and mass of the atmospheric system at lo-
to the fact that it is heavily dependent on data calibration       cal and global scales (Thomas, 2000). Thus, it is necessary to
(Sheffield et al., 2009; Yu et al., 2014). Although the SPI        choose a suitable method to estimate PET. The choice of can-
can be used to monitor and assess different drought types on       didate probability distributions for SPEI calculation is also

Earth Syst. Sci. Data, 13, 331–341, 2021                                            https://doi.org/10.5194/essd-13-331-2021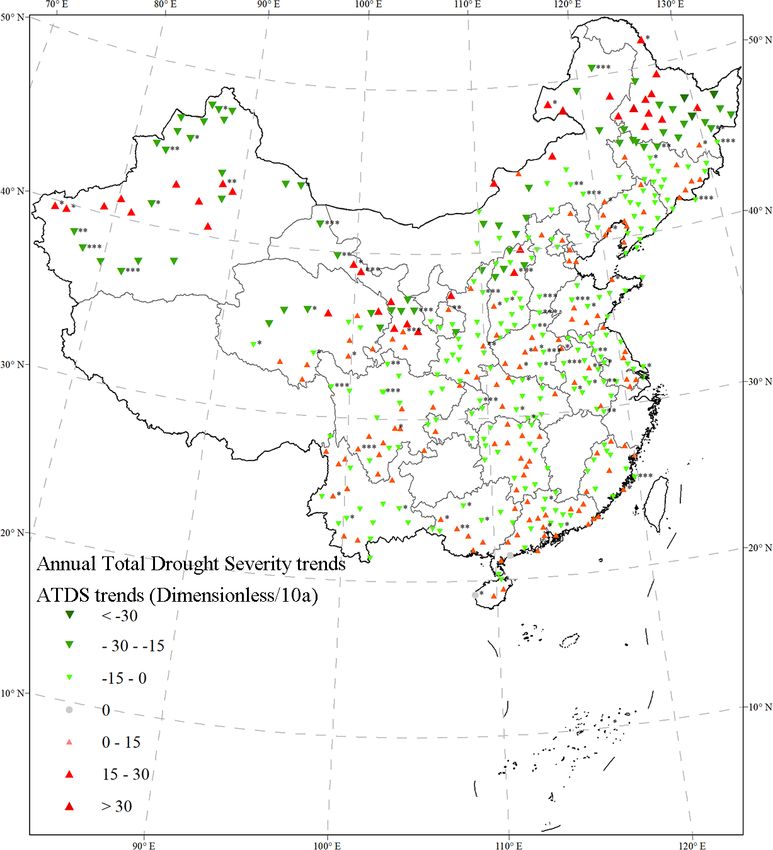
Q. Wang et al.: A multi-scale daily SPEI dataset for drought characterization 333
very important (Vicente-Serrano et al., 2010, 2012). The cho-
sen distribution for SPEI generally needs a location parame-
ter because climatic water balance may have negative values
(when PET is greater than precipitation in certain periods)
(Wang et al., 2015, 2017). Distributions for SPEI normal-
ization have a generalized logistic distribution, Pearson type
III distribution, normal distribution, and generalized extreme
value (GEV) distribution (Stagge et al., 2015). The four can-
didate SPEI distributions have the best goodness of fit for
the accumulated climatic water balance (Stagge et al., 2015;
Wang et al., 2015; Wang et al., 2017). However, the GEV
distribution has the best performance among all four proba-
bility distributions across all of continental Europe, because
of the lower rejection frequencies of GEV using several
tests (Kolmogorov–Smirnov (K–S), Anderson–Darling (A–
D), and Shapiro–Wilk (S–W)) (Stagge et al., 2015). There-
fore, we choose the GEV distribution fitting the accumulated
climatic water balance to calculate SPEI. The SPEI is suited
to investigate the effects of climate change and global warm-
ing on drought severity. SPEI has been widely used in diverse
studies on drought variability and impact and drought mon-
itoring systems (Boroneant et al., 2011; Fuchs et al., 2012;
Potop et al., 2014; Sohn et al., 2013).
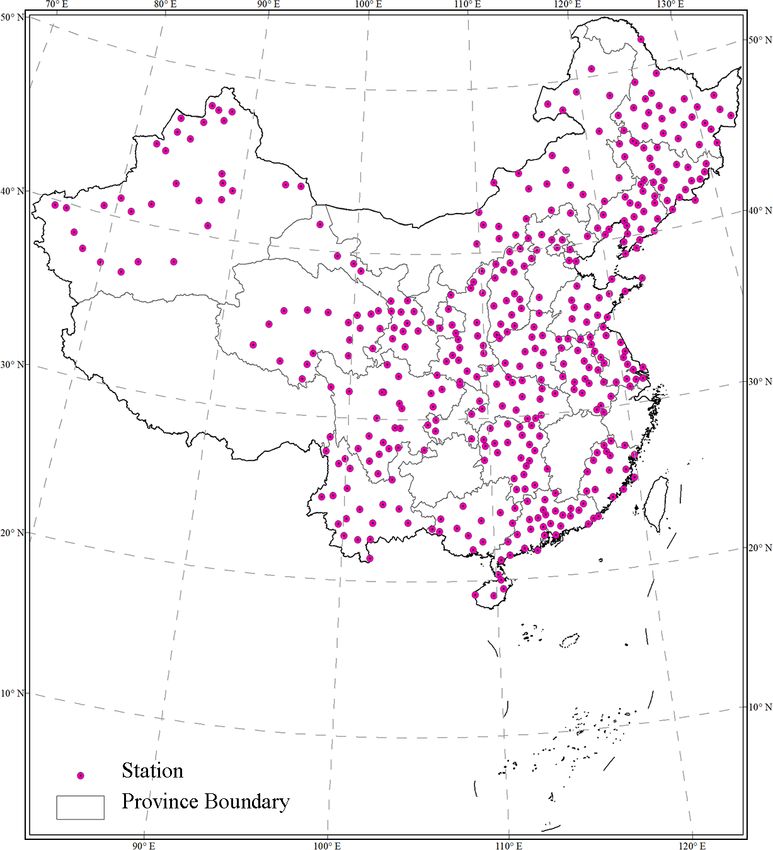
Figure 1. The location of meteorological stations across mainland
The aim of this study, therefore, is to produce a long
China.
(1961–2018) daily drought index dataset for all of mainland
China. Specifically, we used the new daily SPEI algorithm to
produce the multi-timescale drought dataset at a daily time 2.2 Daily SPEI calculation
resolution. Meteorological data with 427 stations including
The daily SPEI can be calculated by the difference between
multiple factors (daily precipitation, daily average air tem-
daily precipitation and daily potential evapotranspiration.
perature, daily minimum air temperature, daily maximum air
Because air temperature and solar radiation explained at least
temperature, and sunshine) are used. The developed drought
80 % of evapotranspiration variability (Martí et al., 2015;
dataset at the national scale has the potential to be used to
Priestley and Taylor, 1972), the Hargreaves model based on
monitor and assess droughts and their impacts for the sectors
temperature and solar radiation can be used to estimate the
including the agricultural sector, forest sector, hydrological
daily potential evapotranspiration (Hargreaves and Samani,
sector, ecological sector, environmental sector, and so on.
1982; Mendicino and Senatore, 2013; Wang et al., 2015).
The daily potential evapotranspiration can be obtained by the
2 Data sources and methods following formula:
p
2.1 Data sources PET = 0.0023 · (Tmean + 17.8) · (Tmax − Tmin ) · Ra , (1)
Daily meteorological data from 1960 to 2018 were collected where Tmean is the daily average air temperature (◦ C); Tmax
from the National Meteorological Science Data Sharing Ser- and Tmin are the daily maximum and minimum air tempera-
vice Platform (http://data.cma.cn/, last access: 15 July 2020). tures (◦ C), respectively; and Ra is the daily net radiation on
The data, which have gone through quality controlling, have the land surface (MJ m−2 d−1 ).
been used in many studies on drought (Li et al., 2019; Wang SPEI calculation depends on the accumulating deficit or
et al., 2019). In total, there are 839 stations with public data. surplus (Di ) of water balance at different timescales. Di can
To ensure continuous and complete data records, 427 me- be determined based on precipitation (P ) and PET formula
teorological stations are chosen for our study by removing given day i:
stations with missing data exceeding 30 d over the whole Di = Pi − PETi . (2)
period. Meteorological variables include the minimum and
maximum air temperature (◦ C), precipitation (mm), and sun- The obtained Di values are summed at different timescales,
shine duration (h). The sunshine duration was converted to following the same procedure as that for the commonly used
solar radiation based on the Ångström function (Chen et al., SPEI. The Di,jk on a given day j and year i depends on the
2010; Wang et al., 2015). The station location is shown in chosen timescale k (days). For example, the accumulated dif-
Fig. 1. ference for 1 d in a particular year i with a 30 d timescale (or
https://doi.org/10.5194/essd-13-331-2021 Earth Syst. Sci. Data, 13, 331–341, 2021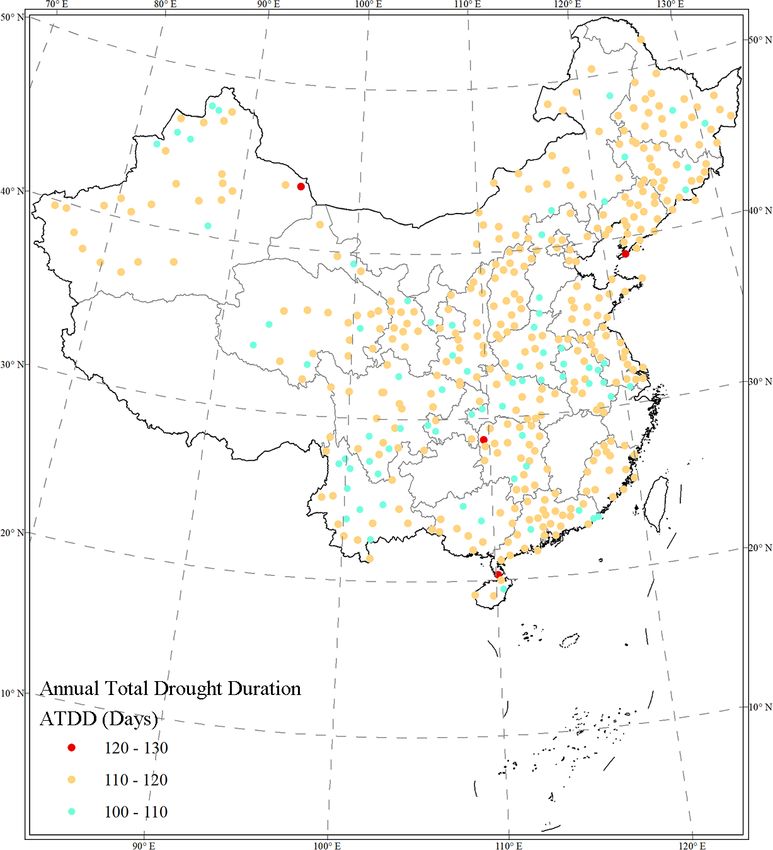
334 Q. Wang et al.: A multi-scale daily SPEI dataset for drought characterization
other timescales) is calculated using Table 1. Categorization of drought and wet grade according to the
Pj SPEI (Wang et al., 2014).
k = P30
Xi,j if j < k and
l=31−k+j Di−1,l + l=1 Di,l
k Pj (3)
Xi,j = l=j −k+1 Di,l if j ≥ k. Categorization SPEI values
Extremely wet SPEI ≥ 2
We also need to normalize the water balance into a proba- Severely wet 1.5 ≤ SPEI < 2
bility distribution to get the SPEI series. The best distribu- Moderately wet 1 ≤ SPEI < 1.5
tion for SPEI calculation is the generalized extreme value Mildly wet 0.5 < SPEI < 1
(GEV) distribution (Stagge et al., 2015), which can overcome Normal −0.5 ≤ SPEI ≤ 0.5
the limitation of the original SPEI through generalized logis- Mild drought −1 < SPEI < −0.5
tic distribution for short accumulation (1–2-month) periods Moderate drought −1.5 < SPEI ≤ −1
(Stagge et al., 2015; Vicente-Serrano et al., 2010). Therefore, Severe drought −2 < SPEI ≤ −1.5
we adopted the GEV distribution to standardize the D series Extreme drought SPEI ≤ −2
into SPEI data series (Monish and Rehana, 2020). The GEV
probability density function is
1
ξ +1 −(1+ξ z(x))−1/ξ 2.3 Drought analysis method
σ (1 + ξ z(x))−1/ξ e ,
ξ 6 = 0, 1 + ξ z(x) > 0
The daily SPEI dataset was calculated in five accumulating
f (x) = (4) periods (30, 90, 180, 360, 720 d) based on the water balance
1
e −z(x)−e−−z(x) ,
σ (difference between precipitation and PET). The classifica-
ξ 6 = 0, −∞ < x < ∞, tions for the SPEI drought classes are presented in Table 1.
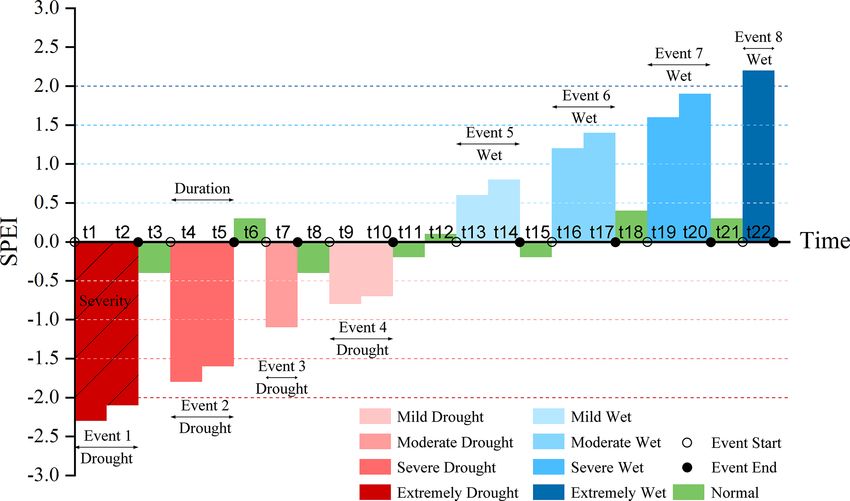
We used the method described by Yevjevich (1967) to de-
where fine the drought characteristics (severity, duration, and inten-
x −µ sity). A drought event can first be determined by drought
z(x) = , (5) start and end dates, and its duration and severity were then
σ
assigned. Thus, we accounted for the continuity of drought
where ξ , σ , and µ are the shape, scale, and location parame- propagation. The continuous days with SPEI values less than
ters, respectively. The cumulative distribution function F (x) the threshold (such as −0.5, −1.0, −1.5, −2) are defined as
of GEV can be calculated by the following equation: the duration of a drought event. The severity is the integral
F (x) = e−(t(x)) , (6) area between absolute value of the SPEI with value < −0.5
and the horizontal axis (SPEI = 0) from the drought start day
where to the drought end day. The drought frequency is the total
number of drought events in a period. The drought event and
−1
1 + ξ (x−µ)
ξ
, if ξ 6 = 0 its characteristics (severity, duration, and intensity) can be
t(x) = σ (7) seen in Fig. 2.
e−(x−µ)/σ , if ξ = 0. The SPEI data based on 90 d (3-month) timescales can
Thus, the probability distribution function of the D series is be used to identify soil moisture or agriculture droughts
given by (Wang et al., 2014). Due to its important applications, we
selected the SPEI data with the 90 d timescales as the exam-
" β #−1 ple data for analysis in the present study. To investigate the
α
F (x) = 1 + . (8) spatial–temporal characteristics of the example data, we de-
χ −γ fined three variables including annual total drought severity
(ATDS), annual total drought duration (ATDD), and annual
With F (x), the SPEI can easily be obtained as the standard-
total drought frequency (ATDF). The three variables were
ized values of F (x). Following the classical approximation
obtained by summing the severity, duration, and frequency
of Abramowitz and Stegun (1965),
of all the drought events in each year at 427 stations.
C0 + C1 W + C2 W 2 We also used the non-parametric Mann–Kendall (MK) test
SPEI = W − , (9) to detect monotonic trends (Kendall, 1948; Mann, 1945), be-
1 + d1 W + d2 W 2 + d3 W 3
√ cause the MK test does not require data normality (Mann,
where W = −2 ln(P ) for P ≤ 0.5 and P is the probability 1945; Wang et al., 2020a, b). We computed slopes for ATDS,
of exceeding a determined D value, P = 1 − F (x). If P > ATDD, and ATDF using the Sen method (Sen, 1968). These
0.5, then P is replaced by 1 − P and the sign of the resultant statistical methods are commonly used in analyses of water
SPEI is reversed. The constants are C0 = 2.515517, C1 = resources, climate, and ecology data. For the MK test, the
0.802853, C2 = 0.010328, d1 = 1.432788, d2 = 0.189269, global trend for the entire series is significant when P value
and d3 = 0.001308. < 0.05.
Earth Syst. Sci. Data, 13, 331–341, 2021 https://doi.org/10.5194/essd-13-331-2021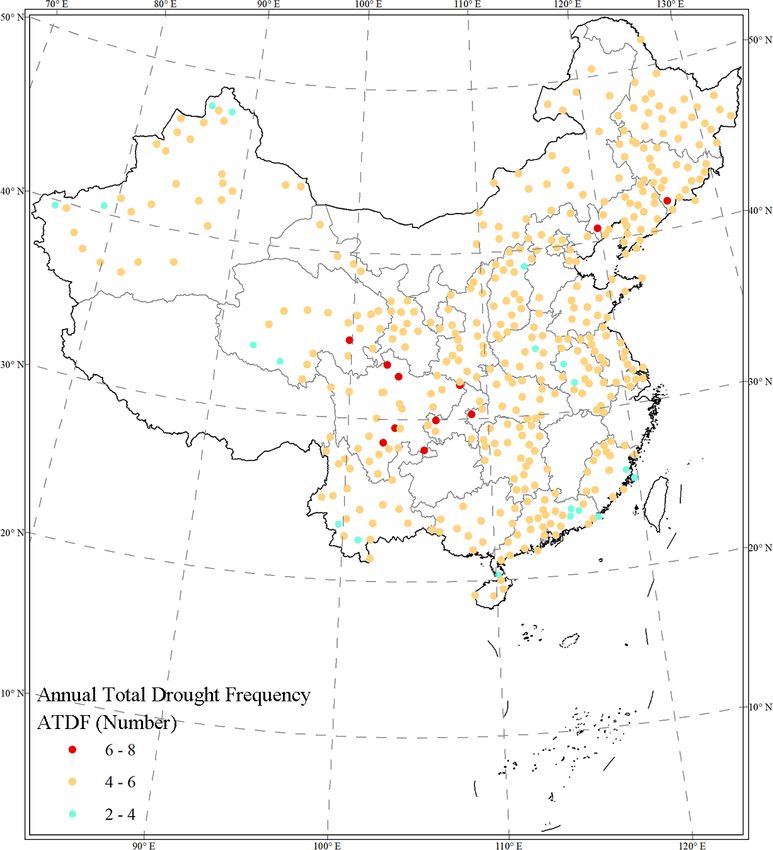
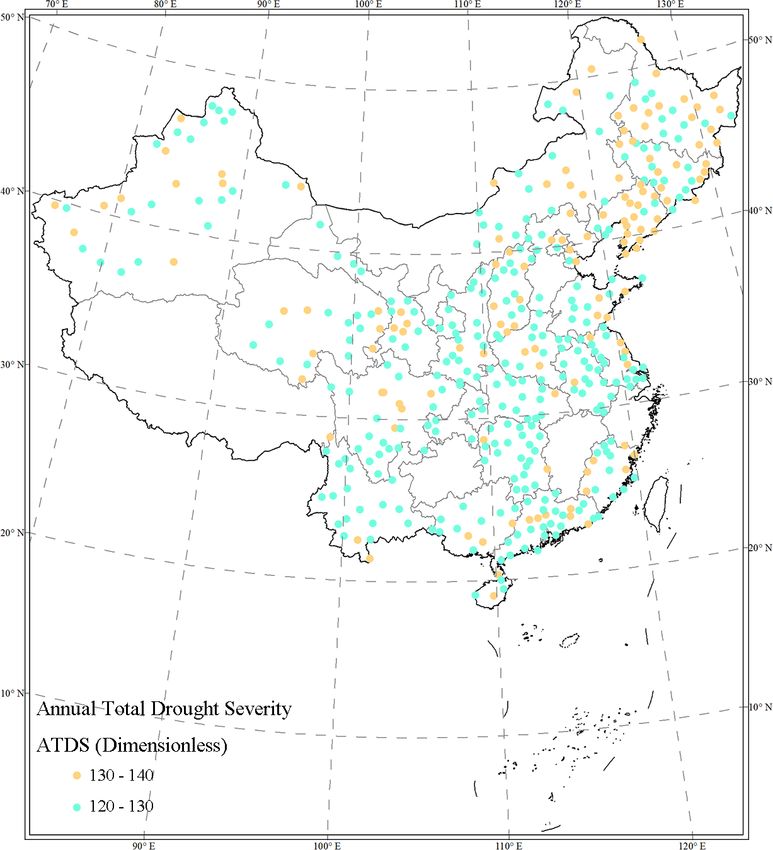
Q. Wang et al.: A multi-scale daily SPEI dataset for drought characterization                                                     335

Figure 2. Schematic diagram of drought and wet events (the red shaded area denotes the drought events; the blue shaded area denotes the
wet events).

3     Analysis results

3.1    Spatial distribution of drought characteristics

The ATDS can be used to identify hot spots with more se-
vere drought conditions. Figure 3 shows the calculated ATDS
values across mainland China. We categorized ATDS values
into two main groups, with higher ATDS values indicating
more severe drought conditions. The distribution of ATDS
values shows that, in general, the northeastern parts of China
had more severe drought conditions than the southern parts.
However, our results also indicate that the humid climate
zone in the south also experienced severe drought conditions,
though not as much as for northern parts of China (Fig. 3).
   Figure 4 shows that ATDD values ranged from 100 to
110 d for most stations across mainland China. This indi-
cates that there was nearly one-third of a year when most
stations were experiencing drought conditions. More stations
with ATDD values ranging from 100 to 110 were found com-
pared with stations with ATDD values of 120–130 (Fig. 4).
For drought years, the duration days of drought events are
expected to be longer. The ATDD had similar spatial distri-
bution characteristics to those of the ATDS, indicating that
droughts also occurred in the humid climate zone.
   Figure 5 shows the spatial distribution of ATDF values
across mainland China. In general, most stations had four
to six annual drought events. There were fewer stations with          Figure 3. The spatial distribution of ATDS across mainland China.
six to eight annual drought events compared with stations
with two to four annual drought events. We also detected that
drought events could occur in both arid and humid regions
based on spatial distributions of ATDF values (Fig. 5). Since

https://doi.org/10.5194/essd-13-331-2021                                                Earth Syst. Sci. Data, 13, 331–341, 2021
336                                             Q. Wang et al.: A multi-scale daily SPEI dataset for drought characterization

the ATDF indicated only the annual average drought events,
we could expect that for the more severe drought years the
ATDF would have greater values for different stations.

3.2    Trends in drought characteristics
The changing trends of ATDS can be used to detect whether
drought severity is weakening or intensifying with time. Fig-
ure 6 shows the spatial distribution of changing trends of
ATDS from 1961 to 2018 across mainland China. In general,
there were more stations with weakening trends in drought
severity than those with intensifying trends across all sta-
tions (Fig. 6). It seems that both weakening and intensify-
ing absolute values were largest in the northeast, northwest,
and central China compared with other parts. However, after
scrutiny, we found that drought severity tended to weaken in
the northeast, northwest, and central China, with more sta-
tions having significant weakening trends according to sta-
tistical tests (P value < 0.05; Fig. 6). For southern China,
most stations had no significant trends in either weakening
or intensifying of drought severity (P value > 0.05; Fig. 6).
   The changing trends of ATDD can be used to detect
whether drought duration is getting shorter or longer. Fig-
ure 7 shows the spatial distribution of changing trends for the
ATDD across all stations. In general, stations in the southeast
                                                                  Figure 4. The spatial distribution of ATDD across mainland China.
demonstrated downward trends with shortening drought du-
ration, while stations in the northwest had upward trends for
the ATDD with increasing drought duration (Fig. 7). Note
that the increasing or decreasing trends for ATDD were sig-
nificant (P value < 0.05) for stations across central China,
indicating that the central China regions were suffering dra-
matic changes of drought conditions.
   The changing trends of ATDF can be used to detect
whether the frequency of drought events is increasing or de-
creasing with time. Figure 8 shows the spatial distribution
of changing trends of ATDF across all stations. Most stations
demonstrated no significant trend in the frequency of drought
events, except for dozens of stations in western China hav-
ing significant upward trends (P value < 0.05) with increas-
ing frequency in drought events, and stations in northeastern
China demonstrated significant downward trends (P value
< 0.05) with decreasing frequency of drought events.

4     Discussion

The reason for selecting a 90 d (3-month) timescale to assess
spatial and temporal characteristics of drought conditions
across mainland China is because the SPEI with the 90 d (3-
month) timescale can indicate the agricultural drought (or
soil moisture) (Van der Schrier et al., 2011; Wang et al.,
2014, 2017), and its results are comparable with the PDSI
(Dai et al., 2004; Van der Schrier et al., 2011) and other
drought indices including the surface water supply index          Figure 5. The spatial distribution of ATDF across mainland China.
(SWSI) and moisture adequacy index (MAI) (Doesken et al.,
1991; McGUIRE and Palmer, 1957). The commonly used

Earth Syst. Sci. Data, 13, 331–341, 2021                                            https://doi.org/10.5194/essd-13-331-2021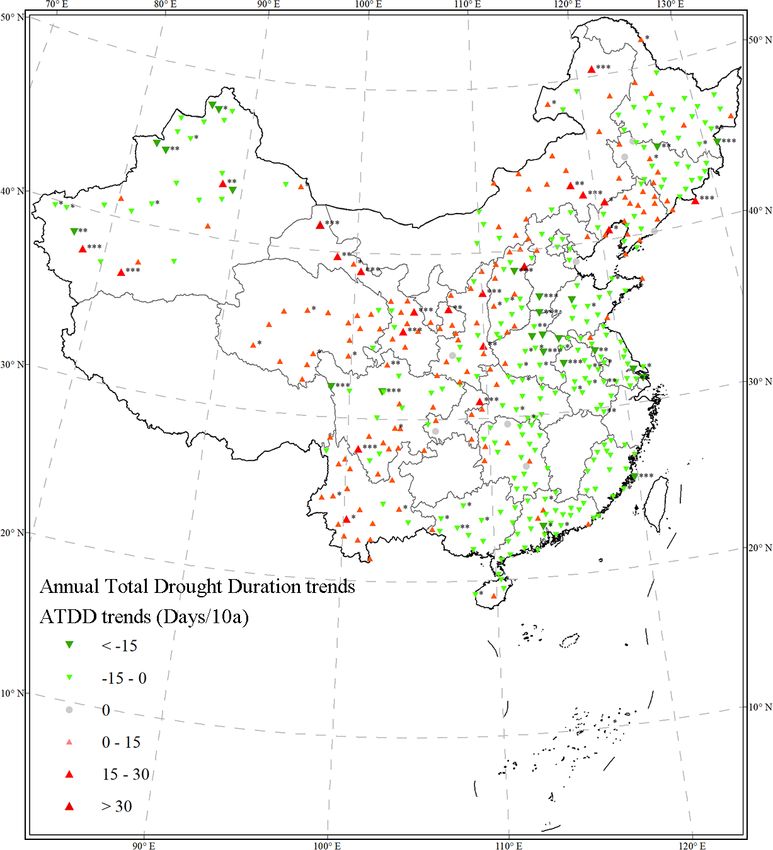
Q. Wang et al.: A multi-scale daily SPEI dataset for drought characterization                                                   337

Figure 6. The spatial distribution of the changing trends of ATDS   Figure 7. The spatial distribution of the changing trends of ATDD
(the red and green triangles indicate increasing and decreasing     (the red and green triangles indicate increasing and decreasing
trends, respectively. “***” denotes P value < 0.001, “**” denotes   trends, respectively. “***” denotes P value < 0.001, “**” denotes
P value < 0.01, and “*” denotes P value < 0.05).                    P value < 0.01, and “*” denotes P value < 0.05).

monthly SPEI has been used to assess drought characteris-           the start and end dates of a drought event (Kassaye et al.,
tics and their impacts worldwide from the regional scale to         2020; Vicente-Serrano et al., 2010; Wang et al., 2014). Our
the global scale (Stagge et al., 2015; Vicente-Serrano et al.,      newly developed daily SPEI can compensate for the short-
2010; Wang et al., 2014). The SPEI with different timescales        comings of monthly SPEI in drought characterization and as-
is relevant for meteorological drought (1-month timescale),         sessment. In addition, we used the well-received GEV prob-
agricultural drought (3–6-month timescale, about 90–180 d),         ability distribution for the SPEI calculation for our dataset
hydrological drought (12-month timescale, about 360 d), and         (Stagge et al., 2015).
socioeconomic drought (24-month timescale, about 720 d),               Although the daily SPEI has better performance in drought
respectively (Homdee et al., 2016; Potop et al., 2014; Tiri-        characterization and assessment (Jevšenak, 2019; Wang et
varombo et al., 2018; Vicente-Serrano et al., 2010).                al., 2017), the uncertainty of daily SPEI still needs to be
   Our new SPEI dataset with multiple timescales was de-            evaluated in future works. Our daily SPEI dataset used the
veloped and compiled using the daily SPEI algorithm in the          simple Hargreaves model based on temperature and solar ra-
previous study (Wang et al., 2015). The daily SPEI has been         diation to estimate daily potential evapotranspiration (Harg-
used in drought characterization and assessment and was val-        reaves and Samani, 1982; Wang et al., 2017). We will fur-
idated by drought characterization and assessment (Jevše-           ther investigate effects of various evapotranspiration mod-
nak, 2019; Jia et al., 2018; Salvador et al., 2019; Wang et         els (such as the CRAE model, Penman algorithm, Thorn-
al., 2015, 2017). The global SPEI database with monthly             thwaite algorithm, Makkink algorithm, and Priestley–Taylor
temporal resolution and 0.5◦ spatial resolution is available        algorithm) on the calculation of SPEI (Makkink, 1957; Mor-
(https://spei.csic.es/database.html, last access: 25 July 2017).    ton, 1983; Penman, 1948; Priestley and Taylor, 1972; Thorn-
The database covers the period between January 1901 and             thwaite, 1944). We only chose SPEI based on the 90 d (3-
December 2018. Although the database can be used effec-             month) timescale as an example to analyze drought charac-
tively for meteorological, agricultural, hydrological, and so-      teristics, and the results demonstrated that there were no ob-
cioeconomic droughts, it cannot identify and detect flash           vious intensifying trends for drought across mainland China,
drought with less than 1-month duration. In addition, the           which is consistent with other studies (Han et al., 2020).
monthly database can only detect the start month and end            Meanwhile, our newly developed daily SPEI will be further
month of drought events, and therefore it fails to determine        validated in other regions of the world. In addition, SPEI val-

https://doi.org/10.5194/essd-13-331-2021                                              Earth Syst. Sci. Data, 13, 331–341, 2021
338                                              Q. Wang et al.: A multi-scale daily SPEI dataset for drought characterization

                                                                    6   Summary

                                                                    In the present study, we have produced a daily SPEI dataset
                                                                    from 1960 to 2018 at 427 meteorological stations across
                                                                    mainland China. Our open-access dataset is an important
                                                                    contribution to drought assessment, and it can overcome the
                                                                    disadvantages of the commonly used monthly SPEI database.
                                                                    Our daily dataset can help monitor and assess the spatial
                                                                    and temporal characteristics of droughts. It can be used to
                                                                    assess the impacts of droughts on ecological systems, hy-
                                                                    drological processes, and other natural resources. Our daily
                                                                    multi-timescale SPEI dataset can be widely used in studies
                                                                    on meteorological drought (1-month timescale), agricultural
                                                                    drought (3–6-month timescale), hydrological drought (12-
                                                                    month timescale), and socioeconomic drought (24-month
                                                                    timescale). The dataset will reduce the time spent on research
                                                                    and avoid the duplication of efforts, which will be highly at-
                                                                    tractive to meteorological, geographical, and natural hazard
                                                                    researchers and researchers from other areas.

                                                                    Author contributions. QW led the study, developed the method,
Figure 8. The spatial distribution of the changing trends of ATDF   and wrote the manuscript with input from all the authors. JQ and
(the red and green triangles indicate increasing and decreasing     XZ discussed the results and revised the manuscript. All the authors
trends, respectively. “***” denotes P value < 0.001, “**” denotes   contributed to the final paper. QW, JY, RZ, XW, and XZ collected
P value < 0.01, and “*” denotes P value < 0.05).                    and analyzed data over time, providing statistics and material (fig-
                                                                    ures and tables) for the paper.

ues at different timescales can be used as a proxy for other        Competing interests. The authors declare that they have no con-
types of droughts, but it lacks the complete picture (no soil       flict of interest.
moisture condition, streamflow, etc.) (Zargar et al., 2011).
   Our long-term daily SPEI dataset has contributed signifi-
cantly to our understanding of drought evolution, especially        Acknowledgements. This research received financial sup-
                                                                    port from the National Natural Science Foundation of China
flash drought. The dataset can be used to monitor and as-
                                                                    (41601562), the Strategic Priority Research Program of the Chi-
sess different drought types (meteorological drought, agri-
                                                                    nese Academy of Sciences (XDA13020506), and the China Schol-
cultural drought, and hydrological drought) through different       arship Council (201806655014). The authors sincerely thank James
timescale data. It can also identify the start and end dates for    Howard Stagge for his help on the codes and calculation of SPEI.
drought. The dataset is valuable to meteorological research         Special thanks go to the meteorological data provider from the
and natural hazard communities for various purposes such as         China Meteorological Administration (http://cdc.cma.gov.cn/, last
assessment of extreme climate or drought effect evaluation.         access: 15 July 2020).

                                                                    Financial support. This research received financial support
                                                                    from the National Natural Science Foundation of China (grant
5   Data availability                                               no. 41601562), the Strategic Priority Research Program of the Chi-
                                                                    nese Academy of Sciences (grant no. XDA13020506), and the
All daily SPEI datasets including data and their descrip-           China Scholarship Council (grant no. 201806655014).
tion at 427 observed meteorological stations are provided
open access via figshare (Wang et al., 2020c), available at
https://doi.org/10.6084/m9.figshare.12568280. This deposi-          Review statement. This paper was edited by Ge Peng and re-
                                                                    viewed by five anonymous referees.
tory includes the five files of the daily SPEI data with five
scales (30 d about 1 month, 90 d about 3 months, 180 d about
6 months, 360 d about 12 months, 720 d about 24 months)
and station information for 427 meteorological stations.

Earth Syst. Sci. Data, 13, 331–341, 2021                                                 https://doi.org/10.5194/essd-13-331-2021
Q. Wang et al.: A multi-scale daily SPEI dataset for drought characterization 339
References ble of global hydrological models, Hydrol. Earth Syst. Sci., 22,
4649–4665, https://doi.org/10.5194/hess-22-4649-2018, 2018.
Grismer, M., Orang, M., Snyder, R., and Matyac, R.: Pan evapora-
tion to reference evapotranspiration conversion methods, J. Irrig.
Abramowitz, M. and Stegun, I.: Handbook of Mathematical Func- Drain. E., 128, 180–184, 2002.
tions, with Formulas, Graphs, and Mathematical Tables, New Han, X., Wu, J., Zhou, H., Liu, L., Yang, J., Shen, Q., and Wu,
York, NY, Dover, 1046 pp., 1965. J.: Intensification of historical drought over China based on a
Agrawala, S., Barlow, M., Cullen, H., and Lyon, B.: The drought multi-model drought index, Int. J. Climatol., 40, 5407–5419,
and humanitarian crisis in Central and Southwest Asia: a https://doi.org/10.1002/joc.6527, 2020.
climate perspective, IRI special report N. 01-11, Interna- Hargreaves, G. H. and Samani, Z. A.: Estimating potential evapo-
tional Research Institute for Climate Prediction, Palisades, 24, transpiration, J. Irrig. Drain. E., 108, 225–230, 1982.
https://doi.org/10.7916/D8NZ8FHQ, 2001. Homdee, T., Pongput, K., and Kanae, S.: A comparative perfor-
Barella-Ortiz, A. and Quintana-Seguí, P.: Evaluation of drought mance analysis of three standardized climatic drought indices in
representation and propagation in regional climate model sim- the Chi River basin, Thailand, Agr. Nat. Resour., 50, 211–219,
ulations across Spain, Hydrol. Earth Syst. Sci., 23, 5111–5131, 2016.
https://doi.org/10.5194/hess-23-5111-2019, 2019. Jevšenak, J.: Daily climate data reveal stronger climate-
Boroneant, C., Ionita, M., Brunet, M., and Rimbu, N.: CLIVAR- growth relationships for an extended European tree-
SPAIN contributions: seasonal drought variability over the ring network, Quaternary Sci. Rev., 221, 105868,
Iberian Peninsula and its relationship to global sea sur- https://doi.org/10.1016/j.quascirev.2019.105868, 2019.
face temperature and large scale atmospheric circulation, Jia, Y., Zhang, B., and Ma, B.: Daily SPEI reveals long-term change
WCRP OSC: Climate Research in Service to Society, in drought characteristics in Southwest China, Ch. Geogr. Sci.,
Denver, USA, available at: https://www.wcrp-climate.org/ 28, 680–693, 2018.
conference2011/posters/C4/C4_Boroneant_TH197A_0.pdf (last Kassaye, A. Y., Shao, G., Wang, X., and Wu, S.: Quantification of
access: 9 February 2021), 24–28 October 2011. drought severity change in Ethiopia during 1952–2017, Environ.
Bussi, G. and Whitehead, P. G.: Impacts of droughts on low flows Dev. Sustain., 1–26, https://doi.org/10.1007/s10668-020-00805-
and water quality near power stations, Hydrol. Sci. J., 65, 898– y, 2020.
913, 2020. Kendall, M. G.: Rank correlation methods, Charles Griffin, London,
Carlson, T. N., Gillies, R. R., and Perry, E. M.: A method to make p. 202, 1948.
use of thermal infrared temperature and NDVI measurements to Kogan, F.: World droughts in the new millennium from AVHRR-
infer surface soil water content and fractional vegetation cover, based vegetation health indices, T. AGU, 83, 557–563, 2002.
Remote Sens. Rev., 9, 161–173, 1994. Lai, C., Zhong, R., Wang, Z., Wu, X., Chen, X., Wang, P., and Lian,
Chen, C., Wang, E., and Yu, Q.: Modelling the effects of climate Y.: Monitoring hydrological drought using long-term satellite-
variability and water management on crop water productivity and based precipitation data, Sci. Total Environ., 649, 1198–1208,
water balance in the North China Plain, Agr. Water Manage., 97, 2019.
1175–1184, 2010. Li, Y., Yuan, X., Zhang, H., Wang, R., Wang, C., Meng, X., Zhang,
Dai, A., Trenberth, K. E., and Qian, T.: A global dataset of Palmer Z., Wang, S., Yang, Y., and Han, B.: Mechanisms and early warn-
Drought Severity Index for 1870–2002: Relationship with soil ing of drought disasters: Experimental drought meteorology re-
moisture and effects of surface warming, J. Hydrometeorol., 5, search over China, B. Am. Meteorol. Soc., 100, 673–687, 2019.
1117–1130, 2004. Lu, J., Sun, G., McNulty, S. G., and Amatya, D. M.: A Comparison
Doesken, N. J., McKee, T. B., and Garen, D. : Drought monitoring of Six Potential Evapotranspiration Methods for Regional Use in
in the western United States using a Surface Water Supply Index, the Southeastern United States 1, J. Am. Water Resour. As., 41,
7th Conf. AppI. Climatology, Proc., American Meteorological 621–633, 2005.
Society, Boston, Mass., 10–13, 1991. Makkink, G. F.: Testing the Penman formula by means of lysime-
Eslamian, S., Ostad-Ali-Askari, K., Singh, V. P., Dalezios, N. R., ters, J. Inst. Water Eng., 11, 277–288, 1957.
Ghane, M., Yihdego, Y., and Matouq, M.: A review of drought Mallya, G., Mishra, V., Niyogi, D., Tripathi, S., and Govindaraju, R.
indices, Int. J. Constr. Res. Civ. Eng., 3, 48–66, 2017. S.: Trends and variability of droughts over the Indian monsoon
Feng, K. and Su, X.: Spatiotemporal Characteristics of Drought in region, Weather Climate Extremes, 12, 43–68, 2016.
the Heihe River Basin Based on the Extreme-Point Symmetric Mann, H.: Non-Parametric Tests against Trend, Econmetrica, 13,
Mode Decomposition Method, Int. J. Dis. Risk Sci., 10, 591– 245–259, 1945
603, 2019. Martí, P., Zarzo, M., Vanderlinden, K., and Girona, J.: Parametric
Fuchs, B., Svoboda, M., Nothwehr, J., Poulsen, C., Sorensen, W., expressions for the adjusted Hargreaves coefficient in Eastern
and Guttman, N.: A new national drought risk Atlas for the US Spain, J. Hydrol., 529, 1713–1724, 2015.
from the National Drought Mitigation Center, National Drought McGuire, J. K. and Palmer, W. C.: The 1957 drought in the eastern
Mitigation Center, Univ. of Nebraska, Lincoln, NE, USA, 2012. United States, Mon. Weather Rev., 85, 305–314, 1957.
Garrick, D. E., Hall, J. W., Dobson, A., Damania, R., Grafton, R. Q., McKee, T. B., Doesken, N. J., and Kleist, J.: The relationship of
Hope, R., Hepburn, C., Bark, R., Boltz, F., and De Stefano, L.: drought frequency and duration to time scales Eighth Conference
Valuing water for sustainable development, Science, 358, 1003– on Applied Climatology, American Meteorological Society,
1005, 2017. Boston, Eighth Conf. Appl. Climatol., available at: https:
Gevaert, A. I., Veldkamp, T. I. E., and Ward, P. J.: The effect of
climate type on timescales of drought propagation in an ensem-
https://doi.org/10.5194/essd-13-331-2021 Earth Syst. Sci. Data, 13, 331–341, 2021340 Q. Wang et al.: A multi-scale daily SPEI dataset for drought characterization
//climate.colostate.edu/pdfs/relationshipofdroughtfrequency.pdf Trenberth, K. E., Dai, A., Van Der Schrier, G., Jones, P. D.,
(last access: 9 February 2021), 1993. Barichivich, J., Briffa, K. R., and Sheffield, J.: Global warming
Mendicino, G. and Senatore, A.: Regionalization of the Hargreaves and changes in drought, Nat. Clim. Change, 4, 17–22, 2014.
coefficient for the assessment of distributed reference evapotran- Van der Schrier, G., Jones, P., and Briffa, K.: The sensitivity of the
spiration in Southern Italy, J. Irrig. Drain. Eng., 139, 349–362, PDSI to the Thornthwaite and Penman-Monteith parameteriza-
2013. tions for potential evapotranspiration, J. Geophys. Res.- Atmos.,
Men-Xin, W. and Hou-Quan, L.: A modified vegetation water sup- 116, https://doi.org/10.1029/2010JD015001, 2011.
ply index (MVWSI) and its application in drought monitoring Vicente-Serrano, S. M., Beguería, S., and López-Moreno, J. I.: A
over Sichuan and Chongqing, China, J. Integr. Agr., 15, 2132– multiscalar drought index sensitive to global warming: the stan-
2141, 2016. dardized precipitation evapotranspiration index, J. Climate, 23,
Mishra, A. K. and Singh, V. P.: A review of drought concepts, J. 1696–1718, 2010.
Hydrol., 391, 202–216, 2010. Vicente-Serrano, S. M., López-Moreno, J. I., Beguería, S., Lorenzo-
Monish, N. and Rehana, S.: Suitability of distributions for standard Lacruz, J., Azorin-Molina, C., and Morán-Tejeda, E.: Accurate
precipitation and evapotranspiration index over meteorologically computation of a streamflow drought index, J. Hydrol. Eng. 17,
homogeneous zones of India, J. Earth Syst. Sci., 129, 2132–2141, 318–332, 2012.
2020. Wan, Z., Wang, P., and Li, X.: Using MODIS land surface tem-
Morton, F. I.: Operational estimates of areal evapotranspiration and perature and normalized difference vegetation index products for
their significance to the science and practice of hydrology, J. Hy- monitoring drought in the southern Great Plains, USA, Int. J. Re-
drol., 66, 1–76, 1983. mote Sens., 25, 61–72, 2004.
Pendergrass, A. G., Meehl, G. A., Pulwarty, R., Hobbins, M., Hoell, Wang, Q., Wu, J., Lei, T., He, B., Wu, Z., Liu, M., Mo, X., Geng, G.,
A., AghaKouchak, A., Bonfils, C. J., Gallant, A. J., Hoerling, M., Li, X., and Zhou, H.: Temporal-spatial characteristics of severe
and Hoffmann, D.: Flash droughts present a new challenge for drought events and their impact on agriculture on a global scale,
subseasonal-to-seasonal prediction, Nat. Clim. Change, 10, 191– Quatern. Int., 349, 10–21, 2014.
199, 2020. Wang, Q., Shi, P., Lei, T., Geng, G., Liu, J., Mo, X., Li, X., Zhou, H.,
Penman, H. L.: Natural evaporation from open water, bare soil and and Wu, J.: The alleviating trend of drought in the Huang-Huai-
grass, Proc. R. Soc. Lon. Ser.-A, 193, 120–145, 1948. Hai Plain of China based on the daily SPEI, Int. J. Climatol., 35,
Potop, V., Boroneanţ, C., Možný, M., Štěpánek, P., and Skalák, 3760–3769, 2015.
P.: Observed spatiotemporal characteristics of drought on vari- Wang, Q., Wu, J., Li, X., Zhou, H., Yang, J., Geng, G., An, X.,
ous time scales over the Czech Republic, Theor. Appl. Climatol., Liu, L., and Tang, Z.: A comprehensively quantitative method of
115, 563–581, 2014. evaluating the impact of drought on crop yield using daily multi-
Priestley, C. H. B. and Taylor, R.: On the assessment of surface heat scale SPEI and crop growth process model, Int. J. Biometeorol.,
flux and evaporation using large-scale parameters, Mon. Weather 61, 685–699, 2017.
Rev., 100, 81–92, 1972. Wang, Q., Tang, J., Zeng, J., Qu, Y., Zhang, Q., Shui, W.,Wang,
Salvador, C., Nieto, R., Linares, C., Diaz, J., and Gimeno, L.: Ef- W., Yi, L., and Leng, S.: Spatial-temporal evolution of vegetation
fects on daily mortality of droughts in Galicia (NW Spain) from evapotranspiration in Hebei Province, China, J. Integr. Agr., 17,
1983 to 2013, Sci. Total Environ., 662, 121–133, 2019. 2107–2117, 2018.
Sen, P. K.: Estimates of the regression coefficient based on Wang, Q., Qi, J., Li, J., Cole, J., Waldhoff, S. T., and
Kendall’s tau, J. Am. Stat. Assoc., 63, 1379–1389, 1968. Zhang, X.: Nitrate loading projection is sensitive to
Sheffield, J., Andreadis, K., Wood, E. F., and Lettenmaier, D.: freeze-thaw cycle representation, Water Res., 186, 116355,
Global and continental drought in the second half of the twentieth https://doi.org/10.1016/j.watres.2020.116355, 2020a.
century: severity–area–duration analysis and temporal variability Wang, Q., Qi, J., Wu, H., Zeng, Y., Shui, W., Zeng, J., and Zhang,
of large-scale events, J. Climate, 22, 1962–1981, 2009. X.: Freeze-Thaw cycle representation alters response of water-
Sohn, S. J., Ahn, J. B., and Tam, C. Y.: Six month–lead downscaling shed hydrology to future climate change, Catena, 195, 104767,
prediction of winter to spring drought in South Korea based on a https://doi.org/10.1016/j.catena.2020.104767, 2020b.
multimodel ensemble, Geophys. Res. Lett., 40, 579–583, 2013. Wang, Q., Zeng J., Qi J., Zhang, X., Zeng, Y., Shui, W., Xu. Z.,
Stagge, J. H., Tallaksen, L. M., Gudmundsson, L., Van Loon, A. F., Zhang, R., and Wu, X.: muliti-scale daily SPEI dataset over the
and Stahl, K.: Candidate distributions for climatological drought Mainland China from 1961–2018 (version June 2020), dataset,
indices (SPI and SPEI), Int. J. Climatol., 35, 4027–4040, 2015. Figshare, https://doi.org/10.6084/m9.figshare.12568280, 2020c.
Thomas, A.: Spatial and temporal characteristics of potential evap- Wang, Y., Zhao, W., Zhang, Q., and Yao, Y.-B.: Characteristics of
otranspiration trends over China, Int. J. Climatol., 20, 381–396, drought vulnerability for maize in the eastern part of Northwest
2000. China, Sci. Rep.-UK, 9, 1–9, 2019.
Thornthwaite, C.: Report of the Committee on Transpiration and Wilhite, D. A. and Glantz, M. H.: Understanding: the drought phe-
Evaporation 1943-44, T. AGU, 25, 683–693, 1944. nomenon: the role of definitions, Water Int., 10, 111–120, 1985.
Tirivarombo, S., Osupile, D., and Eliasson, P.: Drought monitoring Yang, P., Xia, J., Zhang, Y., Zhan, C., and Qiao, Y.: Comprehensive
and analysis: standardised precipitation evapotranspiration index assessment of drought risk in the arid region of Northwest China
(SPEI) and standardised precipitation index (SPI), Phys. Chem. based on the global palmer drought severity index gridded data,
Earth, 106, 1–10, 2018. Sci. Total Environ., 627, 951–962, 2018.
Yevjevich, V. M.: Objective approach to definitions and investiga-
tions of continental hydrologic droughts, Hydrology papers (Col-
Earth Syst. Sci. Data, 13, 331–341, 2021 https://doi.org/10.5194/essd-13-331-2021Q. Wang et al.: A multi-scale daily SPEI dataset for drought characterization 341 orado State University), no. 23, https://doi.org/10.1016/0022- Zambrano, F., Vrieling, A., Nelson, A., Meroni, M., and Tadesse, 1694(69)90110-3, 1967. T.: Prediction of drought-induced reduction of agricultural pro- Yu, M., Li, Q., Hayes, M. J., Svoboda, M. D., and Heim, R. R.: Are ductivity in Chile from MODIS, rainfall estimates, and climate droughts becoming more frequent or severe in China based on oscillation indices, Remote Sens. Environ., 219, 15–30, 2018. the standardized precipitation evapotranspiration index: 1951– Zargar, A., Sadiq, R., Naser, B., and Khan, F. I.: A review of drought 2010?, Int. J. Climatol., 34, 545–558, 2014. indices, Environ. Rev., 19, 333–349, 2011. https://doi.org/10.5194/essd-13-331-2021 Earth Syst. Sci. Data, 13, 331–341, 2021
You can also read