Retrospective methodology to estimate daily infections from deaths (REMEDID) in COVID 19: the Spain case study - Nature
←
→
Page content transcription
If your browser does not render page correctly, please read the page content below
www.nature.com/scientificreports
OPEN Retrospective methodology
to estimate daily infections
from deaths (REMEDID)
in COVID‑19: the Spain case study
David García‑García1, María Isabel Vigo1, Eva S. Fonfría2, Zaida Herrador3, Miriam Navarro2 &
Cesar Bordehore2,4*
The number of new daily infections is one of the main parameters to understand the dynamics
of an epidemic. During the COVID-19 pandemic in 2020, however, such information has been
underestimated. Here, we propose a retrospective methodology to estimate daily infections from
daily deaths, because those are usually more accurately documented. Given the incubation period,
the time from illness onset to death, and the case fatality ratio, the date of death can be estimated
from the date of infection. We apply this idea conversely to estimate infections from deaths. This
methodology is applied to Spain and its 19 administrative regions. Our results showed that probable
daily infections during the first wave were between 35 and 42 times more than those officially
documented on 14 March, when the national government decreed a national lockdown and 9 times
more than those documented by the updated version of the official data. The national lockdown
had a strong effect on the growth rate of virus transmission, which began to decrease immediately.
Finally, the first inferred infection in Spain is about 43 days before the official data were available
during the first wave. The current official data show delays of 15–30 days in the first infection relative
to the inferred infections in 63% of the regions. In summary, we propose a methodology that allows
reinterpretation of official daily infections, improving data accuracy in infection magnitude and dates
because it assimilates valuable information from the National Seroprevalence Studies.
The key parameter to understand and model the evolution of the COVID-19 pandemic is the number of daily
infections. Despite its importance, however, it is difficult to estimate reliable data due to the bias in official
figures1. For symptomatic patients, there are delays of 5.79 days from infection to symptom onset and 5.82
days from symptom onset to diagnosis2. In addition, the presence of asymptomatic people and those with mild
symptoms hinder their detection. For example, 86% of infections were undetected in Wuhan, China, prior to 23
January 2020, when travel restrictions were imposed3. Additionally, not all patients with COVID-19 compatible
symptoms are tested, especially at the beginning of the pandemic. So, it is widely assumed that the reported infec-
tions are just a fraction of the actual ones. In Spain, a National Seroprevalence Study based on ~ 55,000 random
participants estimated that only 10.7% (CI 95% 10.1%-11.3%) of the actual infections had been detected during
the first wave (before 22 June 2020)4,5.
Another problem is the inconsistency of daily infection time series and the variability of the case definitions.
For example, on 13 February 2020, China changed the parameters to confirm new cases and ~ 15,000 new infec-
tions were counted in a single day, while daily infections during the previous week were less than 3 5006. In Spain,
the method of counting official numbers of infections has been modified several times since the pandemic was
decreed. On 22 April 2020, a total of 213,024 cases were reported from positive PCR and antibody t ests7; however,
total cases decreased to 202,990 the next day and thereafter, because only positive PCRs were included in the total
cases8. Accumulated cases on a given day are obtained by adding the new cases that day to the accumulated cases
of the previous day. That has not always been the method, however, because some Spanish regions reviewed and
modified the cases in previous d ays9,10. This inconsistency of time series hampers any kind of accurate analysis.
1
Department of Applied Mathematics, University of Alicante, Alicante, Spain. 2Multidisciplinary Institute for
Environmental Studies “Ramon Margalef”, University of Alicante, Campus San Vicente del Raspeig, 03690 Alicante,
Spain. 3National Centre of Epidemiology, Instituto de Salud Carlos III, Madrid, Spain. 4Department of Ecology,
University of Alicante, Alicante, Spain. *email: cesar.bordehore@ua.es
Scientific Reports | (2021) 11:11274 | https://doi.org/10.1038/s41598-021-90051-7 1
Vol.:(0123456789)
www.nature.com/scientificreports/
Figure 1. Probability density functions (PDF) of incubation period (IP, blue line) and illness onset to death
period (IOD, red line) from Linton et al.12. Green line, f(t), is the convolution of both and represents the PDF of
infection to death. Black dotted line is a lognormal PDF with the same mean and median as f(t).
Additionally, data are continuously being updated. In Spain, official daily infection data available during the first
wave reported 1832 new infected on 14 March 2020, but current official data (as downloaded in February 2021)
reported 7478 new cases for the same date.
High fidelity time series of each parameter of an epidemic are crucial to run reliable epidemiological models.
The number of new infections per unit time is one of the essential parameters. The official data do not reflect
the actual day of infection nor the real number of infections. To overcome this limitation, we propose a retro-
spective methodology to infer daily infections from daily deaths, believing the number of deaths to be a more
reliable parameter than the official number of daily i nfections1. These estimated infections are closer to the date
of infection, avoiding delays from the incubation period and symptom onset to diagnosis. Then, the time series
of daily infections would help to better understand the pandemic dynamics and to quantify the effectiveness of
the different control strategies, avoiding the bias of the official data. In addition, those numbers can be used to
feed epidemiological models with more realistic data. Finally, we will apply this methodology in Spain as a whole
and each of its 19 administrative regions (17 autonomous communities and 2 autonomous cities).
Methods
REMEDID. We named this methodology REMEDID, REtrospective Methodology to Estimate Daily Infec-
tions from Deaths and it is described as follows. Date of infection (DI) of an individual may be estimated from
the death date (DD) by subtracting the incubation period (IP) and illness onset to death (IOD) periods, hence
DI + IP + IOD = DD.
Therefore, DI can be estimated from DD as far as IP and DD are known; however, neither IP nor IOD are
fixed values. On the contrary, they are random variables that can be approximated by probability distributions.
From dozens of cases in Wuhan, Linton et al.11 approximated IP for COVID-19 with a lognormal distribution,
XIP, with a mean of 5.6 days and median of 5 days, and IOD with a lognormal distribution, XIOD, with a mean of
14.5 days and median of 13.2 days. Therefore, the infection to death period is a random variable, XIP+IOD, that
follows the distribution XIP + XIOD.
Although the addition of two lognormal distributions does not follow any commonly used probability dis-
tribution, its probability density function (PDF) can be estimated convolving the PDF of the two v ariables12. If
g(t) and h(t) are the PDF of IP and IOD, respectively, then their convolution defines the PDF of XIP+IOD,
+∞
f (t0 ) = g(t0 − t) · h(t)dt,
−∞
where t0 is a positive real number representing days from infection. Then, f(t) is the PDF of the time from infec-
tion to death, with a mean of 20.1 days and a median of 18.8 days. Figure 1 shows g(t), h(t), and f(t), as well as a
lognormal PDF with the same mean and median as f(t) for comparison. Note that the probability that XIP+IOD is
less than or equal to 33 days is 0.95.
Given a time series of deaths produced by the illness, x(t), we estimate the infection time series that produced
such deaths, y(t). If we assume a case fatality ratio (CFR) of 100%, y(t) would represent all daily infections. To
calculate y(t), we use the following likelihood-based estimation procedure.
Scientific Reports | (2021) 11:11274 | https://doi.org/10.1038/s41598-021-90051-7 2
Vol:.(1234567890)
www.nature.com/scientificreports/
Because the relative likelihood that a given infection will produce a death t days later is f(t), the infections at
a given time t0 can be estimated as
+∞
y(t0 ) = x(t) · f (t − t0 )dt.
t0
In practice, x(t) is a discrete time series and could be written as x(n), where n is an integer representing entire
days. Let F(n) be a discrete approximation to f(t) as follows:
n+1
F(n) = f (t)dt.
n
Then,
+∞
y(n0 ) = x(n) · F(n − n0 ). (1)
n=n0
A similar analysis was used previously to estimate a time-variable effective reproduction number for the
severe acute respiratory syndrome (SARS) in 2 00313.
For a different CFR, the associated/estimated infections are estimated from y(n) in Eq. (1) as
y(n)
Inferred infections(n) = × 100. (2)
CFR(n)
Equations (1) and (2) constitute the kernel of the REMEDID algorithm. Validation of the capacity of REME-
DID to reproduce the number of new daily infections is in Supplementary Material. Note that any delay in death
reporting will produce an underestimate of the infections. Then, interpretation of the last days of the time series
must be done carefully.
Data. Official numbers of COVID‑19 infections and deaths. COVID-19 daily infections and deaths for Spain
are reported by the Centro de Coordinación de Alertas y Emergencias Sanitarias (CCAES), which depends on the
Ministry of Health, Social Services and Equality. Time series for the 19 regions of Spain can be downloaded from
the national organization that compiles and publishes the data from all regions, the Instituto de Salud Carlos III
(ISCIII; https://covid19.isciii.es/). Time series for Spain were estimated by adding the time series of the 19 re-
gions. The final access to infections from official data was on 16 February 2021 (hereafter referred as IO21). Those
data have been greatly improved with respect to the daily situation reports published by CCAES during the
first wave in the first semester of 2020 (hereafter referred as IO20; https://www.mscbs.gob.es/profesionales/salud
Publica/ccayes/alertasActual/nCov-China/situacionActual.htm). For example, IO20 cases were given the date of
diagnosis, whereas IO21 cases were given the date at symptoms onset. When the date of symptoms onset was not
available, it was estimated as follows: infections prior to 10 May 2020 were given the diagnosis date minus 6 days,
whereas only 3 days were subtracted from the date of diagnosis of infections after 11 May 2020. Asymptomatic
cases were given the diagnosis date. These corrections brought reported cases closer to the real infection dates,
although they were still delayed by the length of the incubation period. In addition, re-evaluation of the suspi-
cious cases brought out new infections. As a consequence, the first case in IO21 is set now on 1 January 2020,
while it was on 20 February 2020 in IO20. The first official death was reported on 13 February 2020, although it
was an isolated case. Deaths reported in consecutive days started on 3 March 2020. Then, time spans we consid-
ered for IO21 is from 1 January 2020 to 29 November 2020 and for official daily deaths from 3 March 2020 to 1
January 2021, specifically with 33 extra days as required to apply the REMEDID methodology.
When applying REMEDID the use of a reliable CFR is essential. Thus, to determine a realistic CFR in Spain,
we used the total infections data from the longitudinal seroprevalence study conducted by ISCIII in 4 phases.
The first three phases were completed from 27 April to 22 June and the results were published on 6 July 20204,5. In
this longitudinal cohort study, ~ 68,000 people were randomly selected and ~ 55,000 of them agreed to be inter-
viewed and tested in the three phases. The study found that 5.2% (CI 95% 4.9–5.5%) of the participants presented
SARS-Cov2 IgG antibodies. Extrapolation of this result to the ~ 47 million of the population in Spain yielded
2.45 million infections until 22 June, which, with 29,674 accumulated COVID-19 deaths on 22 June, would give
a CFR of 1.21% (CI 95% 1.15–1.29%). We assumed this value in our analysis for Spain until 22 June. The fourth
phase of the study was completed from 16 to 29 November 2020 and the results published on 15 December
202014. In that study, ~ 51,000 people agreed to participate. The study found that 9.9% (CI 95% 9.4–10.4%) of
the participants presented SARS-Cov2 IgG antibodies at any of the four phases. Then, there were 4.75 millions
of accumulated infections in Spain, meaning 2.30 million new infections from 23 June to 29 November. Because
there were 47,113 accumulated COVID-19 deaths on 29 November (17,439 new deaths from 23 June), it would
give a CFR of 0.76% (CI 95% 0.71–0.81%). Thus, we assumed different CFRs for the different periods, in order
to smooth the discontinuity effects, we propose a CFR time series segmentation as follows: (i) a constant value
of 1.21% from 1 January to 22 June 2020, (ii) a constant value of 0.76% from 29 June to 29 November 2020, and
(iii) a linear function from 23 to 28 June that would correspond to the interpolation of the CFR values for 22
June and 29 June. The CFRs of each region were estimated analogously (summarized in Tables 1, 2). Prior to 22
June, Asturias, Castilla-La Mancha, Castilla y León, Extremadura, País Vasco, and La Rioja had CFRs greater
Scientific Reports | (2021) 11:11274 | https://doi.org/10.1038/s41598-021-90051-7 3
Vol.:(0123456789)
www.nature.com/scientificreports/
Percentage of
infections4,5 Official data MoMo data
ED minus
COVID-19 Days with lower COVID-19
Region 2019 Population % (CI 95%) deaths CFR (CI 99%) ED (CI 95%) limit > 0 CFR (CI 95%) deaths
45,119 (37,593;
Spain 47,026,208 5.2 (4.9; 5.5) 29,674 1.21 (1.15; 1.29) 57 1.85 (1.74; 1.96) 15,445*
55,098)
Andalucía 8,414,240 3.0 (2.6; 3.6) 1441 0.57 (0.48; 0.66) 2123 (651; 5168) 23 0.84 (0.70; 0.97) 682
Aragón 1,319,291 4.8 (3.7; 6.2) 915 1.44 (1.12; 1.87) 1073 (408; 2165) 30 1.69 (1.31; 2.20) 158
Asturias 1,022,800 1.9 (1.3; 2.6) 336 1.73 (1.26; 2.53) 689 (73; 1885) 14 3.54 (2.59; 5.18) 353
Islas Baleares 1,149,460 1.4 (0.8; 2.4) 226 1.4 (0.82; 2.46) 279 (11; 1090) 6 1.73 (1.01; 3.03) 53
Canarias 2,153,389 2.3 (1.5; 3.5) 166 0.33 (0.22; 0.51) 337 (13; 1585) 5 0.68 (0.45; 1.04) 171
Cantabria 581,078 3.7 (2.5; 5.4) 212 0.99 (0.68; 1.46) 296 (34; 932) 10 1.38 (0.94; 2.04) 84
Castilla-La
2,032,863 9.6 (7.8; 11.6) 2951 1.51 (1.25; 1.86) 5468 (4464; 7003) 47 2.80 (2.32; 3.45) 2517*
Mancha
Castilla y León 2,399,548 7.8 (6.8; 9.0) 2829 1.51 (1.31; 1.73) 3813 (2763; 5452) 45 2.04 (1.77; 2.34) 984
12,182 (10,034;
Cataluña 7,675,217 5.9 (5.0; 7.1) 6507 1.44 (1.19; 1.7) 54 2.69 (2.24; 3.17) 5675*
15,537)
Ceuta 84,777 0.7 (0.3; 1.8) 5 0.84 (0.33; 1.97) 85 (5; 170) 3 14.24 (5.54; 33.22) 80
C. Valenciana 5,003,769 2.4 (1.9; 3.1) 1450 1.21 (0.94; 1.53) 2078 (753; 4391) 29 1.73 (1.34; 2.19) 628
Extremadura 1,067,710 3.1 (2.2; 4.3) 513 1.55 (1.12; 2.18) 919 (298; 2044) 25 2.78 (2.00; 3.91) 406
Galicia 2,699,499 1.9 (1.5; 2.4) 618 1.20 (0.95; 1.53) 755 (122; 2472) 13 1.47 (1.16; 1.86) 137
14,443 (12,766;
Madrid 6,663,394 11.7 (.3; 13.3) 8720 1.12 (0.98; 1.27) 62 1.85 (1.63; 2.10) 5723*
16,612)
Melilla 86,487 3.4 (2.3; 5.1) 2 0.07 (0.05; 0.10) 63 (0; 144) 0 2.14 (1.43; 3.17) 61
Murcia 1,493,898 1.6 (1.0; 2.7) 147 0.62 (0.36; 0.98) 387 (37; 1437) 9 1.62 (0.96; 2.59) 240
Navarra 654,214 6.6 (5.1; 8.5) 528 1.22 (0.95; 1.58) 776 (400; 1494) 29 1.80 (1.39; 2.32) 248
País Vasco 2,207,776 3.6 (2.9; 4.7) 1555 1.96 (1.50; 2.43) 1,866 (838; 3388) 32 2.35 (1.80; 2.91) 311
La Rioja 316,798 3.7 (2.8; 4.9) 367 3.13 (2.36; 4.14) 386 (59; 849) 21 3.29 (2.49; 4.35) 19
Table 1. Accumulated COVID-19 deaths and MoMo excess deaths (ED) for Spain and its 19 regions. Values
from 3 March to 22 June 2020. Population data from INE. *Differences beyond the error estimation.
Percentage of
infections14 Official data MoMo data
Days with lower ED minus COVID-
Region % (CI 95%) COVID-19 deaths CFR (CI 95%) ED (CI 99%) limit > 0 CFR (CI 95%)) 19 deaths
23,612 (11,356;
Spain 4.9 (4.6; 5.2) 17,439 0.76 (0.71; 0.81) 104 1.02 (0.97; 1.09) 6173
39,690)
Andalucía 4.1 (3.5; 4.7) 3007 0.87 (0.76; 1.02) 5814 (2173; 10,738) 77 1.69 (1.47; 1.97) 2807
Aragón 7.1 (5.9; 8.4) 1416 1.51 (1.28; 1.82) 1666 (421; 3263) 59 1.78 (1.50; 2.14) 250
Asturias 3.7 (2.8; 5.1) 709 1.87 (1.36; 2.48) 1198 (320; 2933) 31 3.17 (2.30; 4.18) 489
Islas Baleares 4.7 (3.4; 6.3) 218 0.40 (0.30; 0.56) 470 (18; 1666) 6 0.87 (0.65; 1.20) 252
Canarias 1.4 (1.0; 2.0) 178 0.59 (0.41; 0.83) 592 (31; 2227) 9 1.96 (1.37; 2.75) 414
Cantabria 2.7 (2.0; 3.6) 109 0.70 (0.52; 0.94) 287 (6; 1127) 4 1.83 (1.37; 2.47) 178
Castilla-La Mancha 7.2 (6.6; 8.0) 1020 0.70 (0.63; 0.76) 1601 (214; 3748) 36 1.09 (0.98; 1.19) 581
Castilla y León 4.6 (4.1; 5.1) 1843 1.67 (1.51; 1.87) 2053 (481; 4397) 47 1.86 (1.68; 2.09) 210
Cataluña 6.1 (5.1; 7.1) 1914 0.41 (0.35; 0.49) 3677 (777; 8125) 37 0.79 (0.67; 0.94) 1763
Ceuta 8.9 (6.2; 12.2) 51 0.68 (0.49; 0.97) 144 (6; 276) 4 1.90 (1.39; 2.73) 93
C. Valenciana 3.4 (2.7; 4.2) 970 0.57 (0.46; 0.72) 2235 (197; 5772) 29 1.31 (1.06; 1.65) 1265
Extremadura 4.3 (3.7; 5.0) 443 0.97 (0.83; 1.12) 965 (72; 2480) 16 2.10 (1.81; 2.44) 522
Galicia 2.4 (1.8; 3.2) 600 0.93 (0.70; 1.23) 1148 (64; 3,972) 10 1.77 (1.33; 2.36) 548
Madrid 8.2 (7.3; 9.1) 2757 0.51 (0.46; 0.57) 2930 (793; 6,373) 61 0.54 (0.48; 0.60) 173
Melilla 8.4 (6.1; 11.3) 39 0.54 (0.40; 0.74) 135 (6; 260) 5 1.86 (1.38; 2.56) 96
Murcia 4.0 (2.8; 5.4) 478 0.80 (0.60; 1.14) 785 (58; 2212) 13 1.31 (0.97; 1.88) 307
Navarra 7.9 (6.8; 9.1) 361 0.70 (0.61; 0.81) 472 (24; 1474) 7 0.91 (0.79; 1.06) 111
País Vasco 4.4 (3.6; 5.3) 1038 1.07 (0.89; 1.31) 1311 (174; 3494) 25 1.35 (1.12; 1.65) 273
La Rioja 5.2 (3.4; 7.6) 183 1.12 (0.76; 1.71) 341 (24; 956) 12 2.07 (1.42; 3.17) 158
Table 2. Accumulated COVID-19 deaths and MoMo excess deaths (ED) for Spain and its 19 regions. Values
from 23 June to 29 November 2020. The percentages for this period were estimated as differences between the
accumulated percentages on 29 November and on 22 June.
Scientific Reports | (2021) 11:11274 | https://doi.org/10.1038/s41598-021-90051-7 4
Vol:.(1234567890)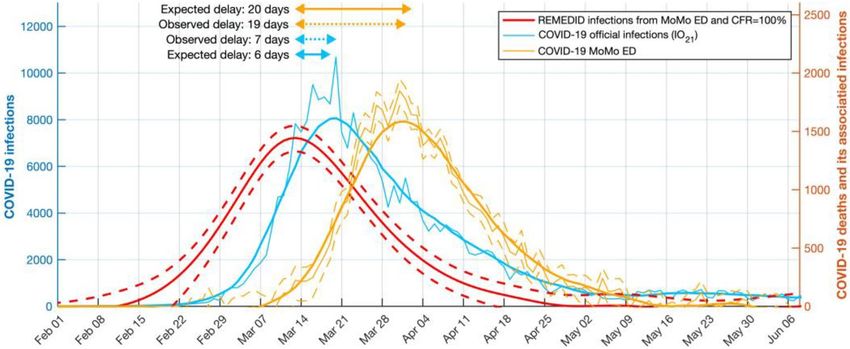
www.nature.com/scientificreports/
than 1.5%. In contrast, Andalucía, Canarias, Melilla, and Murcia had CFRs less than 0.7%. After 22 June, the CFR
for Spain diminished in 0.45%, probably due to improved medical treatments and experience gained during the
first wave. In this period, the number of regions with a CFR below 0.7% increased to 10 and those with a CFR
greater than 1.5% decreased to 3. Most of the regions revealed certain improvement, particularly remarkable
was La Rioja, with a CFR decrease from 3.13 to 1.12%.
Excess of expected deaths from MoMo. Expected deaths from any cause, with an error band representing a 99%
confidence interval, are modelled by the Mortality Monitoring (MoMo) surveillance system for 22 countries in
Europe (www.euromomo.eu). In Spain, MoMo depends on the ISCIII15 and data are available at https://momo.
isciii.es/public/momo/dashboard/momo_dashboard.html#nacional. MoMo also collects daily deaths from any
cause from the Spanish Instituto Nacional de Estadística (INE) and the notaries and civil registries. Daily deaths
within the error estimates of the expected deaths are considered usual. Any deviation allows identification of
unusual mortality patterns, as for the COVID-19 pandemic. The useful variable here is the excess deaths (ED),
estimated as the difference between actual and expected deaths. The error band for ED can be estimated from
the error band of the expected deaths by subtracting the latter from the actual deaths. Note that ED can show
negative values (Fig. 2). By cautiously assuming that all significant ED is caused by COVID-19, ED can be used
to estimate non-reported COVID-19 deaths. In this case, negative values for ED make no sense and are set to
zero. The MoMo time series was downloaded on 16 February 2021 and we considered the period from 3 March
2020 (first non-isolated official COVID-19 death) to 1 January 2021.
Given that MoMo ED in Spain was 45,119 (CI 99% 37,593–55,098) deaths from 3 March to 22 June, and
23,612 (CI 99% 11,356–39,690) from 23 June to 29 November, the CFR for the country estimated similarly as
in “Official numbers of COVID-19 infections and deaths” section was 1.85% (CI 95% 1.74–1.96%) prior to 22
June, and 1.02% (CI 95% 0.97–1.09%) after 23 June. For each region, the CFRs were estimated similarly and are
provided in Tables 1 and 2. In all cases, we used a piece wise CFR time series segmented as described in “Official
numbers of COVID-19 infections and deaths” section.
Results
COVID‑19 vs. MoMo. The COVID-19 official deaths and MoMo ED time series overlaped for the period
from 3 March 2020 to 1 January 2021 for Spain and its 19 regions (Fig. 2). In general, there was good agreement
between both datasets, meaning that most of MoMo ED were related to COVID-19 deaths. During the first wave,
the most important differences were observed in Spain, Madrid, Cataluña, Castilla-La Mancha, and Castilla y
León. Before 22 June in Spain, MoMo ED showed 15,445 accumulated deaths more than the official COVID-19
deaths, which is beyond the error band. That difference comes basically from the four regions with the largest
numbers of deaths (Madrid, Cataluña, Castilla-La Mancha, and Castilla y León). Table 1 shows the accumulated
values before 22 June, which were used to estimate the CFR for Spain and its 19 regions according to the third
phase of the National Seroprevalence Study4,5. For all regions, the CFR estimated from MoMo ED was larger than
the CFR estimated from COVID-19 deaths. In particular, Asturias, Canarias, and Murcia were twice as large.
Ceuta and Melilla dramatically increased their CFR from MoMo ED, although that may be biased due to their
small populations and numbers of deaths.
Similarly, the same variables for the period from 23 June to 29 November 2020 are reported in Table 2. In
Spain, MoMo ED showed 6173 accumulated deaths more than the official COVID-19 deaths. This difference is
a third of the difference observed prior to 22 June; because this is within the error band, there was a significant
improvement in the detection of COVID-19 deaths in this period. Figure 2 also shows a general agreement
between MoMo ED and official COVID-19 deaths time series after the first wave, with the exception of late July
and early August. These differences were due to two heat waves that were responsible for at least 25% of the
MoMo ED16.
Infections estimated from COVID‑19 deaths. To illustrate the delay between official daily infec-
tions data and REMEDID estimated daily infections, we applied REMEDID from COVID-19 deaths assuming
CFR = 100%. Figure 3 shows the current IO21 and the infections associated with COVID-19 deaths for the first
wave. The latter in Spain reached a maximum on 13 March 2020 (Table 3), the day before the national govern-
ment decreed a state of emergency and national lockdown. Thus, the adopted measures had an immediate effect,
which was observed in the official data IO21 7 days later (20 March). This delay is similar to the incubation period
(mean 5.78 d ays2), which could be explained because official infections were reported when symptoms appeared.
This delay reached 16 days when we compared with earlier version IO20 (not shown), which highlights the
usefulness of the methodology to reinterpret official data from very early stages of the pandemic. On the other
hand, the maximum number of deaths was reached on 1 April, which was 19 days after the inferred infection
maximum, bringing this delay close to the 20 days expected between infection and death (Figs. 1, 3).
We applied REMEDID to the official COVID-19 deaths with the corresponding estimated CFRs (see “Data”
section) to obtain the time series of estimated daily infections, hereafter referred to as IRO. Figure 4 shows IRO
and the accumulated infections for Spain and its 19 regions. Note that in Spain, IRO are amplified versions of
inferred infections in Fig. 3. In Spain, the first infection, according to IRO,, is on 8 January 2020 (Table 3), 43 days
before the first infection was officially reported on 20 February 2020 according to IO20. By contrast, IO21 places
the first infection on 1 January 2020. Spain reached the maximum number of IRO on 13 March, a day before the
state of emergency and lockdown were enforced (Table 4). On 14 March, IO20 = 1832, and IO21 = 7478; however,
IRO = 63,727 (CI 95% 60,050–67,403), 35 and 9 times IO20 and IO21, respectively (Table 5). This implies that on
that day, IO20 and IO21 only reported 2.9% (CI 95% 2.7–3.1%) and 11.7% (CI 95% 11.1–12.5%) of new infections,
respectively. Although detection of infections clearly improved from IO20 to IO21, almost 90% of the infections
Scientific Reports | (2021) 11:11274 | https://doi.org/10.1038/s41598-021-90051-7 5
Vol.:(0123456789)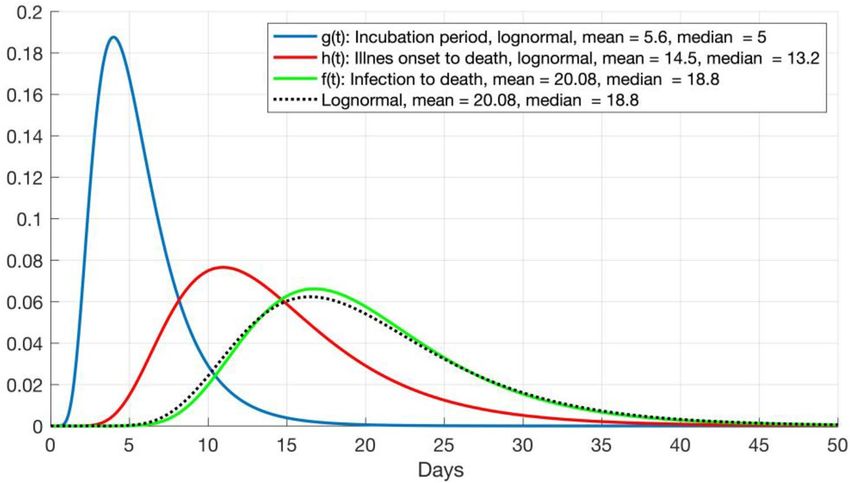
www.nature.com/scientificreports/

                                            Figure 2.  COVID-19 deaths and MoMo Excess Deaths (ED). (a) Spain; (b–t) Spanish regions. Red lines are
                                            official COVID-19 deaths, solid black lines are MoMo deaths, and thin black lines delimit MoMo death error
                                            bands (99% confidence interval).

          Scientific Reports |   (2021) 11:11274 |              https://doi.org/10.1038/s41598-021-90051-7                                               6

Vol:.(1234567890)
www.nature.com/scientificreports/
Figure 3. Official COVID-19 infections and deaths, and estimated infections with case fatality ratio (CFR)
of 100% in Spain during the first wave. Left y-axis: COVID-19 daily infections I O21 (blue curve). Right y-axis:
COVID-19 deaths (orange curve) and its REMEDID-estimated infections with CFR = 100% (red curve). All
curves are for Spain. Thin blue and orange curves are daily data, and thick curves are smoothed by 14-day
running mean. Arrows show delays between the maximum of inferred infections and maxima from COVID-19
deaths (orange arrows) and COVID-19 infections (blue arrows). Solid arrows are expected delays, dotted while
arrows are observed delays.
First infection
Official COVID-19
data
IRO (CI 95%) IRM (CI 95%) IO20 IO21
Spain 8 Jan (8–8 Jan) 9 Jan (9–10 Jan) 20 Feb 1 Jan
Andalucía 18 Jan (17–18 Jan) 12 Jan (12–13 Jan) 26 Feb 2 Feb
Aragón 21 Jan (20–22 Jan) 8 Jan (8–8 Jan) 4 March 11 Feb
Asturias 28 Jan (26–29 Jan) 20 Jan (18–21 Jan) 29 Feb 23 Feb
Islas Baleares 27 Jan (24–29 Jan) 14 Jan (11–17 Jan) 20 Feb 29 Jan
Canarias 22 Jan (20–23 Jan) 8 Jan (8–8 Jan) 20 Feb 29 Jan
Cantabria 28 Jan (26–30 Jan) 11 Jan (9–13 Jan) 29 Feb 23 Feb
Castilla-La Mancha 17 Jan (16–17 Jan) 14 Jan (13–14 Feb) 29 Feb 24 Feb
Castilla y León 19 Jan (19–20 Jan) 17 Jan (16–17 Jan) 28 Feb 20 Jan
Cataluña 16 Jan (16–17 Jan) 10 Jan (10–11 Feb) 25 Feb 3 Jan
Ceuta 16 Feb (11–21 Feb) 21 Jan (16–26 Jan) 14 March 3 March
C. Valenciana 9 Jan (8–11 Jan) 12 Jan (11–13 Jan) 25 Feb 1 Feb
Extremadura 25 Jan (24–26 Jan) 12 Jan (10–13 Jan) 29 Feb 8 Feb
Galicia 25 Jan (24–26 Jan) 14 Jan (13–15 Jan) 3 March 1 Feb
Madrid 11 Jan (10–11 Jan) 9 Jan (8–9 Jan) 25 Feb 1 Jan
Melilla 2 Feb (31 Jan–4 Feb) 17 Jan (15–19 Jan) 12 March 5 March
Murcia 28 Jan (26–29 Jan) 13 Jan (10–15 Jan) 7 March 22 Feb
Navarra 24 Jan (23–25 Jan) 8 Jan (8–8 Jan) 29 Feb 10 Feb
País Vasco 18 Jan (17–18 Jan) 9 Jan (9–11 Feb) 28 Feb 12 Feb
La Rioja 27 Jan (25–28 Jan) 14 Jan (12–15 Jan) 1 March 5 Jan
Table 3. Date of first infection for REMEDID estimated daily infections from COVID-19 deaths (IRO) and
from MoMo Excess Deaths (ED) (IRM), and for official COVID-19 daily infections released on June 2020 (IO20)
and on February 2021 (IO21). All dates refer to year 2020.
are still not documented in the peak of the first wave. The situation is similar for the accumulated infections
before 22 June 2020, as reported by the National Seroprevalence Study4,5.
In almost all regions, IO20 showed a delay of 1 month or more between the first infection and IRO (Table 3).
No delay in IO21 occurred in Islas Baleares, Castilla-León, and Galicia, while in three regions (Cataluña, Madrid,
and La Rioja), the first case occurred earlier than the first case of IRO. However, 6 regions had delays of 15 days
and other 6 regions had delays of 1 month. According to IRO, all regions except Ceuta and Melilla had some
Scientific Reports | (2021) 11:11274 | https://doi.org/10.1038/s41598-021-90051-7 7
Vol.:(0123456789)www.nature.com/scientificreports/
Figure 4. Daily and accumulated infections for official COVID-19 daily infections (IO21), and daily infections
estimated from COVID-19 deaths (IRO). Lines are daily infections and refer to the y-axis on the right; bars are
accumulated infections and refer to the y-axis on the left. Red lines and cyan bars are official COVID-19 data;
orange lines and blue bars are inferred infections with case fatality ratio (CFR) in Table 1. Thin orange lines
correspond to the CFR confidence interval.
Scientific Reports | (2021) 11:11274 | https://doi.org/10.1038/s41598-021-90051-7 8
Vol:.(1234567890)www.nature.com/scientificreports/
Relative maxima in 2020
IRO IRM IO21
Spain 13 March, 22 October 13 March, 18 July, 30 Aug, 19 Oct 20 March, 16–17 Sept, 26 Oct
Andalucía 15 March, 21 October 12 March, 19 October 20 March, 26 October
Aragón 19 March, 27 July, 24 Oct 16 March, 25 July, 21 Oct 23 March, 2 Aug, 26 Oct
12–14 March, 22–23 March, 25 July,
Asturias 25–26 March, 2–3 Nov 20 March, 9 Nov
24 Oct
Islas Baleares 17 March, 16 Aug, 5 Sept, 20–21 Oct 12 March, 30–31 July, 3 Oct 20 March, 17 Aug, 8 Nov, 20–21 Nov
Canarias 11 March, 26–27 Aug 14 March, 12 Aug 19 March, 29 Aug
Cantabria 17 March, 2 Sept, 26 Oct, 16 Nov 17 March 22 March, 4 Sept, 8 Nov
Castilla-La Mancha 12 March, 19 Oct 12 March, 18 July, 15 Oct 20 March, 17 Sept, 29 Oct
Castilla y León 15 March, 25 Oct 14 March, 21–22 Oct 21 March, 26 Oct
Cataluña 14 March, 12 Oct 15 March, 22 July, 19 Oct 20 March, 26 Oct
17–19 March, 16–17 May, 25–26 Aug,
Ceuta 22–24 July, 24–26 Aug, 14–15 Oct 23 March, 29 Oct
15–16 Oct
C. Valenciana 15 March, 1 Sept, 31 Oct 13 March, 18 July, 24 Nov 19 March, 24 Aug, 2 Nov
Extremadura 14 March, 12–13 Sept, 19 Oct 14 March, 3 July, 13 Oct 22 March, 18 Sept, 17 Oct
Galicia 18 March, 28–29 Aug, 25 Oct 17 March, 8–9 Oct 22 March, 29 Aug, 27 Oct
Madrid 11 March, 9 Sept 11 March, 18 July, 8 Sept 28 March, 16 Sept
Melilla 11 March, 20 Aug, 16 Oct 9–10 March, 17–18 July, 15 Oct 17 March, 8 Sept, 22 Oct
11–12 March, 17 April, 18–19 Aug,
Murcia 14–15 March, 28–29 Aug, 19–20 Oct 19 March, 18 Sept, 30 Oct
17–18 Oct
Navarra 16 March, 21 Oct 14 March, 23 Sept, 17 Oct 19 March, 17 Sept, 20 Oct
País Vasco 18 March, 31 Aug, 30–31 Oct 15–16 March, 30 Aug, 16 Oct 20 March, 30 Aug, 1 Nov
La Rioja 18 March, 3–4 Sept, 22–23 Oct 13–14 March, 21–22 Aug, 10–11 Oct 21 March, 14 Sept, 26 Oct
Table 4. Date of the most prominent relative maxima, for Spain and the 19 regions, of the REMEDID
estimated daily infections from COVID-19 deaths (IRO) and from MoMo excess deaths (ED) (IRM), and official
COVID-19 daily infections (IO21). Maxima of IO21 were estimated from the 14-day running mean time series.
infections in January, but in IO21 only 6 regions had infections in that month. In all scenarios, the first infections
were in Madrid and Cataluña.
During the first wave, according to IRO most of the regions had maximum daily infections around 14 March.
In Madrid, the maximum was reached on 11 March, coinciding with the educational centres closing and an offi-
cial warning by the regional government (Table 4). Asturias was the last region to reach peak infections (25–26
March). The maximum percentage of documented cases (12.6%, CI 95% 9.2–18.4%) occurred in Asturias on 14
March, but in the other regions, only between 1.2 and 8% of the infections were documented (Table 5).
Figure 4 shows how the IO21 and IRO curves of Spain and the 19 different regions fluctuated following the
same pattern until the middle of June 2020, but thereafter, they showed different patterns. This reflects the fact
that the Spanish government had decreed the control measures for the whole nation until June, but thereafter,
each regional government implemented its own control measures. For example, some regions (e.g., Aragón, Islas
Baleares, Cantabria, Comunidad Valenciana, Extremadura, Galicia, Murcia, País Vasco, and La Rioja) had two
peaks, but others had only one. An apparent maximum on 22 June in Islas Baleares is an artifact produced by
the interpolation for transition from the two CFRs. Although beyond the scope of this work, it would be very
interesting to investigate the effects of the different control measures implemented on the corresponding IRO
for the 19 regions.
The Spanish COVID-19s wave reached a maximum of daily infections on 22 October from IRO and on 26
October from IO21. The delay of 4 days is similar to the mean incubation period (5.78 days2). The estimated
number of new infections is still larger than the documented cases, but the shapes of the two curves are more
similar in the second wave than in the first wave (Fig. S1). The same is true for the 19 regions, most of which had
the largest peak around 22–26 October, with the exceptions of Canarias and Madrid, which reached maxima in
late August and early September, respectively.
Infections from MoMo excess deaths. Assuming that MoMo ED accounts for both recorded and non-
recorded COVID-19 deaths, negative deaths are meaningless, and they were set to zero. Then, the associated
daily infections can be estimated, as in “Infections estimated from COVID-19 deaths” section, with a CFR of
100% from MoMo ED for Spain (Fig. 5). Note two main differences between this time series and that estimated
from official COVID-19 deaths: (1) MoMo data present an error band that was inherited by the estimated infec-
tions; (2) MoMo ED estimated infections reached a maximum of 1443 (CI 99% 1329–1547), doubling the 776
inferred daily infections from official COVID-19 deaths in Fig. 3. This is because maximum MoMo ED was 1,584
(CI 99% 1468–1686) and maximum COVID-19 official deaths was 828, both estimated from the 14-day running
mean time series. The maximum of inferred infections was reached on 13 March, just one day prior to the state
of emergency and lockdown. The expected and observed delays with respect to official infections and MoMo ED
Scientific Reports | (2021) 11:11274 | https://doi.org/10.1038/s41598-021-90051-7 9
Vol.:(0123456789)www.nature.com/scientificreports/
Daily infections on 14 March 2020 Percentage of detected daily infections (%)
Official
COVID-19 IO20 IO21
IRD (CI 95%) IRM (CI 95%) IO20 IO21 IRD (CI 95%) IRM (CI 95%) IRD (CI 95%) IRM (CI 95%)
63,727 (60,050; 77,855 (73,364;
Spain 1832 7478 2.9 (2.7; 3.1) 2.4 (2.2; 2.5) 11.7 (11.1; 12.5) 9.6 (9.1; 10.2)
67,403) 82,347)
7144 (6192; 6788 (5883;
Andalucía 168 396 2.4 (2.0; 2.7) 2.5 (2.1; 2.9) 5.5 (4.6; 6.4) 5.8 (4.9; 6.7)
8573) 8145)
1599 (1232; 1804 (1391;
Aragón 26 107 1.6 (1.3; 2.1) 1.4 (1.1; 1.9) 6.7 (5.2; 8.7) 5.9 (4.6; 7.7)
2065) 2330)
Asturias 358 (245; 490) 346 (237; 473) 45 81 12.6 (9.2; 18.4) 13 (9.5; 19) 22.6 (16.5; 33.1) 23.4 (17.1; 34.2)
Islas Baleares 412 (235; 706) 307 (175; 526) 14 69 3.4 (2.0; 6.0) 4.6 (2.7; 8) 16.7 (9.8; 29.4) 22.5 (13.1; 39.4)
1385 (903; 1086 (708;
Canarias 19 96 1.4 (0.9; 2.1) 1.7 (1.1; 2.7) 6.9 (4.6; 10.6) 8.8 (5.8; 13.6)
2108) 1653)
Cantabria 597 (403; 871) 501 (338; 730) 20 59 3.4 (2.3; 5.0) 4 (2.7; 5.9) 9.9 (6.8; 14.6) 11.8 (8.1; 17.5)
Castilla-La 5303 (4309; 6458 (5247;
112 545 2.1 (1.7; 2.6) 1.7 (1.4; 2.1) 10.3 (8.5; 12.6) 8.4 (7; 10.4)
Mancha 6408) 7804)
4688 (4087; 5871 (5119;
Castilla y León 54 474 1.2 (1.0; 1.3) 0.9 (0.8; 1.1) 10.1 (8.8; 11.6) 8.1 (7; 9.3)
5410) 6775)
11,795 (9996; 13,854 (11,740;
Cataluña 184 1482 1.6 (1.3; 1.8) 1.3 (1.1; 1.6) 12.6 (10.4; 14.8) 10.7 (8.9; 12.6)
14,194) 16,671)
Ceuta 23 (10; 59) 9 (4; 23) 1 3 4.3 (1.7; 10.0) 11.1 (4.3; 25) 13.0 (5.1; 30) 33.3 (13; 75)
3476 (2752; 3555 (2814;
C. Valenciana 279 463 8.0 (6.2; 10.1) 7.8 (6.1; 9.9) 13.3 (10.3; 16.8) 13 (10.1; 16.5)
4490) 4592)
Extremadura 981 (696; 1361) 883 (627; 1225) 29 71 3.0 (2.1; 4.2) 3.3 (2.4; 4.6) 7.2 (5.2; 10.2) 8 (5.8; 11.3)
1476 (1165; 1443 (1139;
Galicia 80 244 5.4 (4.3; 6.9) 5.5 (4.4; 7) 16.5 (13.1; 20.9) 16.9 (13.4; 21.4)
1865) 1823)
19,565 (17,224; 24,315 (21,405;
Madrid 604 2622 3.1 (2.7; 3.5) 2.5 (2.2; 2.8) 13.4 (11.8; 15.2) 10.8 (9.5; 12.2)
22,241) 27,640)
Melilla 139 (94; 208) 46 (31; 68) 5 3 3.6 (2.4; 5.3) 10.9 (7.4; 16.1) 2.2 (1.4; 3.2) 6.5 (4.4; 9.7)
Murcia 867 (542; 1464) 446 (279; 752) 24 84 2.8 (1.6; 4.4) 5.4 (3.2; 8.6) 9.7 (5.7; 15.5) 18.8 (11.2; 30.1)
1165 (900; 1447 (1118;
Navarra 37 121 3.2 (2.5; 4.1) 2.6 (2; 3.3) 10.4 (8.1; 13.4) 8.4 (6.5; 10.8)
1500) 1863)
1965 (1583; 2269 (1828;
País Vasco 109 421 5.5 (4.2; 6.9) 4.8 (3.7; 6) 21.4 (16.4; 26.6) 18.6 (14.2; 23)
2566) 2962)
La Rioja 314 (238; 416) 266 (201; 352) 22 137 7.0 (5.3; 9.2) 8.3 (6.3; 10.9) 43.6 (32.9; 57.6) 51.5 (38.9; 68.2)
Table 5. REMEDID estimated daily infections from COVID-19 deaths (IRO) and from MoMo excess
deaths (ED) (IRM) on 14 March, and for official COVID-19 daily infections released on June 2020 (IO20) and
released on February 2021 (IO21). Infections are inferred from COVID-19 deaths and MoMo ED with their
corresponding CFR and 95% confidence interval detailed in Table 1. Percentages are official COVID-19
infections as proportions of the estimated infections.
were similar to those observed for estimated infections from official COVID-19 deaths. Error bounds of the esti-
mated infections in Fig. 5 were computed from the MoMo ED error bounds. However, it should be highlighted
that the combination of the error bounds from MoMo ED and the estimated CFRs might lead to unrealistic error
estimates. To avoid this, the error estimates in Fig. 6 were estimated from the MoMo ED time series (no error
bounds) and the error bounds of the estimated CFRs.
The REMEDID was applied to the MoMo ED with the corresponding CFRs (see “Data” section) to obtain
the estimated daily infections, which will be referred hereafter as IRM. The IRM were calculated for Spain and its
19 regions and are depicted in Fig. 6, as well as the accumulated IRM. In Spain, the first infection shown by IRM
happened on 9 January, with an error estimate from 9 to 10 January, 41 to 42 days before the first documented
infection of IO20 on 20 February 2020 (Table 3). The maximum IRM was 77,855 (CI 95% 73,364–82,347) reached
on 13 March. On 14 March, IRM showed 14,128 infections more than IRO (Table 5). Notice that the CFR used with
MoMo ED data was larger than the one used with official COVID-19 deaths data, which makes this difference
even more remarkable, because the larger the CFR the lower the estimated infections. Therefore, if the true CFRs,
which are unknown, were used in both cases, IRM would double IRO on 14 March, as happened when a CFR of
100% was used (Figs. 3, 5). Notice that with the CFRs used, the IRM and IRO resulted in the same accumulated
infections on 22 June and 29 November, matching the results of the seroprevalence study. Nevertheless, IRM
showed 42 times more cases than IO20 and 10 times more than IO21 on 14 March, detection of official cases of
only 2.4% (2.2–2.5%) and 9.6% (9.1–10.2%), respectively.
Table 3 shows the estimated date of first infection for Spain and by region. Note that the first cases of IRM in
Spain were on 9 January and in Aragón, Canarias, and Navarra on 8 January, which is possible because signifi-
cant excess deaths in a region may not become significant for the whole country. In general, the maxima of daily
infections were closer to those on 14 March in IRM than in IRO. During the first wave, all regions showed a single
Scientific Reports | (2021) 11:11274 | https://doi.org/10.1038/s41598-021-90051-7 10
Vol:.(1234567890)www.nature.com/scientificreports/
Figure 5. Official COVID-19 infections, MoMo Excess Deaths (ED), and estimated infections with case fatality
ratio (CFR) of 100% in Spain during the first wave. Left y-axis: COVID-19 daily infections IO21 (blue curve).
Right y-axis: MoMo ED (orange curve) and its REMEDID-estimated infections with CFR = 100% (red curve).
All curves are for Spain. Thin blue and orange curves are daily data, and thick curves are smoothed by 14-days
running mean. Dashed curves represent the error estimate of MoMo ED (orange) and inferred infections (red).
Arrows show delays between the maximum of inferred infections and maxima from MoMo ED (orange arrows)
and COVID-19 infections (blue arrows). Solid arrows are expected delays, dotted while arrows are observed
delays.
maximum, except for Ceuta, Melilla, and Murcia, which showed two maxima (Fig. 6). In general, the IRM time
series in all regions were similar during that period. The official data clearly under-detected infections during
the first wave. On 14 March, IRM were comparable to IRO, overlapping CI in all regions, but not in Spain as a
whole (Table 5). During the second wave, there was improved detection of cases with differences among regions.
Discussion
Infection dynamics is key to understand and model the COVID-19 pandemic. Nevertheless, documented infec-
tions in Spain (and nearly worldwide) are of limited quality both qualitatively and quantitatively. Specifically,
reported infections were underestimated and delayed 16 days compared to the estimated date of infection during
the first months of the pandemic (according to IO20) and 6 days in the current version of the data (IO21). Accord-
ing to the National Seroprevalence Study, only 10.7% of infections were documented in Spain prior to 22 June
20204,5 and 64.3% from 23 June to 29 November 202014. The huge underreporting during the first wave is mainly
due to: (1) the lack of testing for asymptomatic and mildly symptomatic p eople3, which could have been detected
with a “test, track and trace” strategy, as done in South Korea, China, and S ingapore17; (2) deaths outside of the
hospitals, with many cases from nursing homes for the elderly, where 6664 deaths with COVID-19 and 7082
with similar symptoms, but not officially diagnosed with COVID-19, occurred from January to May 202018. This
poor quality of data hinders any options to study the infection dynamics based on official data.
To overcome these difficulties, we propose the REMEDID algorithm, which allows calculation of time series
for daily infections from daily death time series, a more reliable source, which can be applied in early stages of
any COVID-19 outbreak with only 33 days delay. The REMEDID algorithm needs only three inputs:
(1) PDF of the period from date of infection to date of death. In this study, that was calculated by combining
the PDF of the Incubation Period and the Illness Onset to Death period, as estimated by Linton et al.11
for cases in Wuhan, China. The incubation period can be assumed to be similar in China and elsewhere,
because it is a characteristic of the virus, but the illness onset to death period could be affected by the type
of health care and, thus, by each national health s ystem2 or even e thnicity19. No such information is avail-
able for Spain to date, but it would be desirable to use a local distribution of Illness Onset to Death when
available for Spain. The calculations could be redone easily by applying the MATLAB code available in
GitHub (https://github.com/isavig/REMEDID).
(2) Time series of daily deaths. We used two sources, the official COVID-19 deaths and the MoMo ED, because
official COVID-19 deaths have been underestimated, especially during the first wave in the regions of
Castilla-La Mancha, Castilla y León, Cataluña, and Madrid. Such underestimation was due to the fact that
non-hospital deaths and cases during the early pandemic were somewhat undertested (Table 1 , Fig. 2 ).
We expect that undocumented COVID-19 deaths appeared in the excess of expected deaths from any cause
calculated from M oMo15. Interpretation of those results must be made carefully because ED is a statisti-
cal variable calculated from what happened in previous years and some expected deaths, such as those
produced by traffic and work accidents, may have been reduced due to the national lockdown that began
on 14 March 2020 and gradually has been eased. Nonetheless, expected fatalities were very low (traffic and
work accidents less than 5 deaths daily 20,21) compared to the daily death toll fromCOVID-19 (300 deaths
per day average from March to May). Some non-COVID-19 deaths may have been influenced by other
pandemic-related factors22, such as breakdown in medical follow-up (especially chronic conditions and
among older patients), delays in attending to the healthcare appointments and/or being attended due to
Scientific Reports | (2021) 11:11274 | https://doi.org/10.1038/s41598-021-90051-7 11
Vol.:(0123456789)www.nature.com/scientificreports/
Figure 6. Daily and accumulated infections for official COVID-19 daily infections (IO21), and daily infections
estimated from MoMo Excess Deaths (ED) (IRM). Lines are daily infections and refer to the y-axis on the right;
and bars are accumulated infections and refer to the y-axis on the left. Red lines and cyan bars are for official
COVID-19 data; and orange lines and blue bars are for inferred infections with case fatality ratio (CFR) in
Table 1. Thin orange lines represent the error estimate of inferred infections.
Scientific Reports | (2021) 11:11274 | https://doi.org/10.1038/s41598-021-90051-7 12
Vol:.(1234567890)www.nature.com/scientificreports/
the collapse of the Health System, transplant delay and reduction in donors’ numbers from 7.2 to 1.2 per
day23, and the decrease of the interventional cardiology activity between 40 and 81%24. Thus, MoMo ED
do not exactly correspond to COVID-19 deaths and must be regarded with caution. A detailed study of
the changes in other sources of mortality is recommended. Nevertheless, MoMo ED is a valuable source
of data that must be explored considering the enormous bias in official data of daily infections.
(3) CFR estimate. CFR was defined as the ratio of deaths among total infections. Thus, the lower the docu-
mented infections, the larger the CFR and under-detection of infections leads to overestimation of the
CFR. For example, in Spain on 22 June 2020, official data showed 261,111 accumulated infections and
29,676 deaths, a CFR of 11.37%, which was clearly overestimated because the number of infections was
underestimated. The National Seroprevalence Study in Spain with random testing showed that 5.2% of the
population (~ 47 million) had already been infected4,5. Because CFR also depends on death records, we
calculated a CFR of 1.21% (CI 95% 1.15–1.29%) from official COVID-19 deaths and a CFR of 1.85% (CI
95% 1.74–1.96%) from MoMo ED. However, the CFR is not constant in time nor in space. Different regions
showed different CFRs and the fourth phase of the seroprevalence study showed a general decrease in the
CFRs for the period 23 June–29 November. In Spain, the CFR decreased from 1.21% to 0.76% (CI 95%
0.71–0.81%) from official COVID-19 deaths and from 1.85% to 1.02% (CI 95% 0.97–1.09%) from MoMo
ED. This decline is probably due to the improvement of COVID-19 treatments and experience gained since
the beginning of the pandemic25. Similar seroprevalence studies are desirable in other countries, because
CFRs from official data are so variable. For example, on 22 June 2020, CFRs of 0.6, 5.2, and 14.5% were
reported for Iceland, the world, and Italy, r espectively26. In addition, we assumed a constant CFR prior to
22 June and from 23 June to 29 November 2020, although introducing time dependence on the CFR would
enhance the infected estimates. A constant CFR does not consider who is affected by saturation of the health
systems due to limited human and material resources. However, to estimate a time-variable CFR requires
accurate infection records among other variables, which are not currently available. Moreover, CFRs among
severe cases (mostly detected) are much greater than those among asymptomatic and mild cases (mostly
undetected). Consequently, the CFR calculation has a high degree of uncertainty. Nevertheless, because
information on the CFRs is expected to improve, calculations in this study can be updated easily using
the MATLAB code for REMEDID algorithm available in GitHub (https://github.com/isavig/REMEDID).
Supplementary Material
We ran the REMEDID algorithm to provide the estimated time series of infections for Spain and for its 19
regions for the period from 8 January to 29 November 2020. These time series provided valuable information to
understand the time evolution of the pandemic. Our main findings for Spain are:
(1) On 14 March, when the national government decreed the state of emergency and national lockdown, esti-
mated infections were between 35 and 42 times larger than officially documented ones at that time, and
9–10 times more than current official data.
(2) The national lockdown had a strong effect on the transmission of the virus, as shown by a rapid slope
decrease around day 13 March.
(3) The first infection was better determined from inferred infections than from official records during the
first months of the pandemic.
The REMEDID algorithm has strengths and limitations. First, it uses the number of deaths, which are more
accurately recorded than infections. Second, it allows elucidation of the date of the infections estimated during
the seroprevalence studies, which only determines the total number of infections. Thus, the REMEDID algorithm
complements the seroprevalence studies. Third, the estimated daily infections place the probable date of infection
more accurately than the official numbers. Note that official infections are delayed by the incubation period (from
infection to illness onset). Therefore, although the maxima of infections theoretically should have coincided with
the state of emergency and the national lockdown on 14 March, official infections in Spain were maximum 6
days later. Infections estimated from death data do not show such delay, however. Determination of the actual
day of infection is very important for evaluation of the immediate effect of the implemented countermeasures.
In Madrid the estimated infections reached their maximum on 11 March when regional government warned
the population to stay at home and schools and universities were closed, forcing 1.2 million students to stay at
home. Moreover, overall recommendations on disease control and social distancing were given by the Ministry
of Health to the general public since the beginning of March (see https://www.mscbs.gob.es/en/profesionales/
saludPublica/ccayes/alertasActual/nCov-China/ciudadania.htm).
Four, the REMEDID algorithm can be applied to any region, regardless of population size, but being cautious
with small populations. For example, in this study we applied REMEDID methodology to a small city (Ceuta
with 84,777 inhabitants), a medium size region (Madrid with more than 6.6 million inhabitants), and a country
(Spain with 47 million inhabitants). This versatility allows study of different epidemic dynamics as reflected in the
variety of shapes and slopes in the curves depicting death and infection records, that show the heterogeneity of
the epidemic at each region with different population size and density, social behaviour and transmission pattern,
especially during the second wave, showing unique dynamics that must be addressed individually. Knowledge
of the real epidemic dynamics of different population nodes (regions, cities, neighbourhoods, etc.) is key to
succeed in modelling attempts, because we could calculate the sole effect of group s ize27. This spatially-explicit
information, in combination with population size per node and mobility would allow us to use a metapopulation
approach in future m odels28–30.
Scientific Reports | (2021) 11:11274 | https://doi.org/10.1038/s41598-021-90051-7 13
Vol.:(0123456789)www.nature.com/scientificreports/
Among the methodology limitations, the most important is that it can only be implemented retrospectively.
Thus, these estimates cannot be used to control the pandemic in real time. But considering that different regions
or countries are at different stages at the same time, results of this methodology for the first communities could be
applied elsewhere. Furthermore, models are valuable tools to improve our knowledge of the pandemic dynamics,
including the effectiveness of the different measures adopted to flatten the curve and design safe post-lockdown
measures31–34. In addition, more realistic and accurate models could be obtained by use of the more realistic daily
number of infections provided by REMEDID, which, in turn, would improve the model outputs and enhance
comparisons of different lockdown and post-lockdown measures.
We believe that REMEDID methodology applied to daily COVID-19 deaths (if accurately reported) or to
MoMo ED could be useful to analyse the dynamics of the pandemic retrospectively and more accurately quantify
the real daily infections with respect to the official numbers. We only need the CFR and, for greater precision,
the PDF of the period from Infections to Death or, alternatively, the PDF of Incubation Period and Illness Onset
to Death. This approach could be implemented anywhere, improving our knowledge and understanding of the
dynamics of the pandemic and the effectiveness of the confinement measures. This is of high importance to
develop successful strategies to face and reduce the effects of future epidemic episodes.
Received: 24 June 2020; Accepted: 6 May 2021
References
1. Holmdahl, S. M. I. & Buckee, D. P. C. Wrong but useful—What Covid-19 epidemiologic models can and cannot tell us. N. Engl. J.
Med. https://doi.org/10.1056/NEJMp2016822 (2020).
2. Fonfría, E. S. et al. Essential epidemiological parameters of COVID-19 for clinical and mathematical modeling purposes: A rapid
review and meta-analysis. MedRxiv. https://doi.org/10.1101/2020.06.17.20133587 (2020).
3. Li, R. et al. Substantial undocumented infection facilitates the rapid dissemination of novel coronavirus (SARS-CoV-2). Science
368, 489–493. https://doi.org/10.1126/science.abb3221 (2020).
4. Instituto de Salud Carlos III. Estudio ENE-COVID19: Estudio Nacional de sero-Epidemiología de la infección por SARS-COV-2 en
España. Informe final. https://www.mscbs.gob.es/ciudadanos/ene-covid/docs/ESTUDIO_ENE-COVID19_INFORME_FINAL.
pdf (Accessed 6 July 2020).
5. Pollán, M. et al. Prevalence of SARS-CoV-2 in Spain (ENE-COVID): A nationwide, population-based seroepidemiological study.
The Lancet 396, 535–544. https://doi.org/10.1016/S0140-6736(20)31483-5 (2020).
6. World Health Organization. Coronavirus Disease 2019 (COVID-19) Situation Report—24 (WHO, 2020).
7. Centro de Coordinación de Alertas y Emergencias Sanitarias. Actualización No 84. Enfermedad por el Coronavirus (COVID-19)
(CCAES, 2020).
8. Centro de Coordinación de Alertas y Emergencias Sanitarias. Actualización No 85. Enfermedad por el Coronavirus (COVID-19)
(CCAES, 2020).
9. Centro de Coordinación de Alertas y Emergencias Sanitarias. Actualización No 111. Enfermedad por el Coronavirus (COVID-19)
(CCAES, 2020).
10. Centro de Coordinación de Alertas y Emergencias Sanitarias. Actualización No 112. Enfermedad por el Coronavirus (COVID-19)
(CCAES, 2020).
11. Linton, N. et al. Incubation period and other epidemiological characteristics of 2019 novel coronavirus infections with right
truncation: A statistical analysis of publicly available case data. J. Clin. Med. 9(2), 538. https://doi.org/10.3390/jcm9020538 (2020).
12. Uspensky, J. V. Introduction to Mathematical Probability (McGraw-Hill Book Company, 1937).
13. Wallinga, J. & Teunis, P. Different epidemic curves for severe acute respiratory syndrome reveal similar impacts of control measures.
Am. J. Epidemiol. 160, 509–516 (2004).
14. Instituto de Salud Carlos III. Estudio ENE-COVID19: Cuarta Ronda. Estudio Nacional de Sero-Epidemiología de la infección por
SARS-COV-2 en España. Cuarta ronda. https://portalcne.isciii.es/enecovid19/informes/informe_cuarta_ronda.pdf (Accessed 6
July 2020).
15. León-Gómez, I. et al. Exceso de mortalidad relacionado con la gripe en España en el invierno de 2012. Gac Sanit 29, 258–265
(2015).
16. Gil Bellosta, Y. Y., Luz Frías, C. J., Verrieri, L., Delgado, C. &Larrauri I. L. A. Informe MOMOCalor, Estimaciones de la Mortalidad
Atribuible a Excesos de Temperatura en España, 1 de junio a 15 de septiembre de 2020. Centro Nacional de Epidemiología. Ciber de
Epidemiología y Salud Pública (CIBERESP). Instituto de Salud Carlos III (2020). https://www.isciii.es/QueHacemos/Servicios/
VigilanciaSaludPublicaRENAVE/EnfermedadesTransmisibles/MoMo/Paginas/MOMOcalor.aspx (Accessed 16 February 2021).
17. Fang Yong, S. E. et al. Connecting clusters of COVID-19: An epidemiological and serological investigation. The Lancet. https://
doi.org/10.1016/S1473-3099(20)30273-5 (2020).
18. Defunciones según la Causa de Muerte—Avance enero-mayo de 2019 y de 2020. Notas de prensa del Instituto Nacional de Estadís‑
tica (2020). https://www.ine.es/dyngs/INEbase/es/operacion.htm?c=Estadistica_C&cid=1254736176780&menu=u ltiDatos&idp=
1254735573175 (Accessed 16 February 2021).
19. Risk for COVID-19 Infection, Hospitalization, and Death by Race/Ethnicity. https://www.cdc.gov/coronavirus/2019-ncov/covid-
data/investigations-discovery/hospitalization-death-by-race-ethnicity.html (Accessed 5 March 2021).
20. Dirección General de Tráfico, Ministry of Interior. Cuadro Comparativo de Accidentes Mortales y Fallecidos a 24 h en vías Interur‑
banas (DGT, 2020).
21. Ministerio de Trabajo y Economía Social. Estadística de Accidentes de Trabajo, Avance enero-marzo 2020 (MTES, 2020).
22. Vandoros, S. Excess mortality during the Covid-19 pandemic: Early evidence from England and Wales. MedRxiv. https://doi.org/
10.1101/2020.04.14.20065706 (2020).
23. Domínguez-Gil, B. et al. COVID-19 in Spain: Transplantation in the midst of the pandemic. Am. J. Transplant. 20, 2593. https://
doi.org/10.1111/ajt.15983 (2020).
24. Rodríguez-Leor, O. et al. Impacto de la pandemia de COVID-19 sobre la actividad asistencial en cardiología intervencionista en
España. REC Interv. Cardiol. 2(2), 82–89 (2020).
25. Boudourakis, L. & Uppal, A. Decreased COVID-19 mortality—A cause for optimism. JAMA Intern. Med. https://doi.org/10.1001/
jamainternmed.2020.8438 (2020).
26. Roser, M., Ritchie, H., Ortiz-Ospina, E. & Hasell, J. Mortality Risk of COVID-19. Published online in Our World in Data. https://
ourworldindata.org/mortality-risk-covid#the-case-fatality-rate (Accessed 23 May 2020).
27. Caillaud, D., Craft, M. E. & Meyers, A. Epidemiological effects of group size variation in social species. J. R. Soc. Interface 10,
20130206. https://doi.org/10.1098/rsif.2013.0206 (2013).
Scientific Reports | (2021) 11:11274 | https://doi.org/10.1038/s41598-021-90051-7 14
Vol:.(1234567890)You can also read


